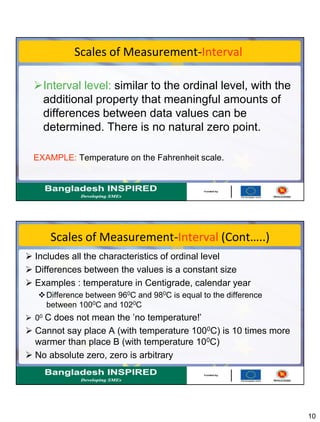
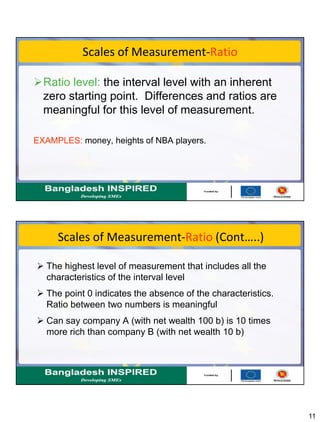
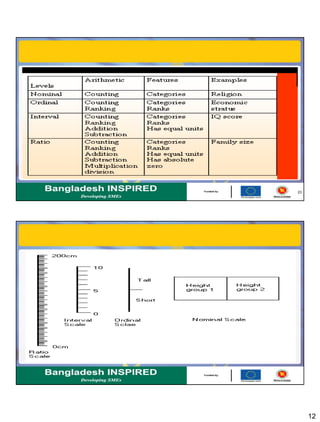
1
Introduction to Statistics
Day 1, Session I
M. Amir Hossain, Ph.D.
January 17, 2016
What is Meant by Statistics?
Statistics is the science of collecting,
organizing, presenting, analyzing, and
interpreting numerical data for the
purpose of assisting in making a more
effective decision.
2
Who Uses Statistics?
• Statistical techniques are used
extensively by marketing, accounting,
quality control, consumers, professional
sports people, hospital administrators,
educators, politicians, physicians, etc...
Why Statistics is Studied?
 We face numerical data all the time
newspapers, sports magazines, business magazines
 Statistical techniques are used to make decisions that effect our
daily lives
 Insurance companies use statistics to set rates for different
insurance
 Medical professional assess the performance of a new drug
over the existing one
 No matter what is your future line of work, you will make decisions
that will involve data
3
Types of Statistics
• Descriptive Statistics: Methods of organizing, summarizing,
and presenting data in an informative way.
• EXAMPLE 1: A social survey found that 49% of the people
knew the name of the first book of the Bible. The statistic 49
describes the number out of every 100 persons who knew
the answer.
Types of Statistics (Cont…..)
Inferential statistics: Taking a sample from a
population and making estimates/assumptions about a
population, based on a sample.
 A population is a collection of all possible individuals,
objects, or measurements of interest.
 A sample is a representative portion or part of the
population of interest.
4
Types of Variables
Variable is a characteristics that can assume any set of
prescribed values
Age, Height, Weight, Eye color, Total population of a country
Qualitative Variable (Attribute)
Quantitative Variable
Types of Variables (Cont….)
Qualitative variable or Attribute: the
characteristic or variable being studied is non-
numeric.
EXAMPLES: Gender, Religious affiliation, Type of automobile
owned, Eye color.
5
Types of Variables (Cont…..)
Quantitative variable: the variable which can
be measured and reported numerically.
EXAMPLE: Balance in your savings account, Time remaining
in class, Number of children in a family.
Types of Variables (Cont….)
Quantitative variables can be classified as
either discrete or continuous.
Discrete variables: can only assume certain
values and there are usually “gaps” between
values.
EXAMPLE: the number of bedrooms in a house. (1,2,3,..., etc...).
6
Types of Variables (Cont…)
Quantitative Variables can be classified as
either discrete or continuous.
Continuous variables: can assume any value
within a specific range.
EXAMPLE: The time it takes to fly from Florida to New York.
Scales of Measurement
Measurement means assigning numbers or other
symbols to characteristics of objects according to
certain prescribed rules.
Scaling is the generation of a continuum upon
which measured objects are located
Arithmetic and statistical operations for
summarizing and presenting data depend on the
levels of measurement
7
Scales of Measurement (Cont…..)
Four scales of measurement :
Nominal scale
Ordinal scale
Interval scale
Ratio scale
Scales of Measurement –Nominal
Nominal level (scaled): Data that can only be
classified into categories and cannot be
arranged in an ordering scheme.
EXAMPLES: eye color, gender, religious
affiliation.
8
Scales of Measurement-Nominal (Cont…)
Categories must be mutually exclusive and
exhaustive
Mutually exclusive: Categories are so defined that each member of
the population is correctly allocated to one and only one category
Exhaustive: each person, object, or item must be classified in at
least one category i.e. A classification is exhaustive when it
provides sufficient categories to accommodated all members of the
population
Scales of Measurement-Nominal (Cont…..)
Categories are not of a particular order
Table: Number of people by their place of Residence
Division Number Percent
Khulna 330 27.31
Rajshahi 251 20.78
Dhaka 400 33.11
Chittagong 118 9.77
Barisal 20 1.65
Sylhet 89 7.37
Total 1208 100
9
Scales of Measurement-Ordinal
Ordinal level: involves data that may be arranged in
some order, but differences between data values
cannot be determined or are meaningless.
EXAMPLE: During a taste test of 4 colas, cola C was ranked number
1, cola B was ranked number 2, cola A was ranked number 3, and
cola D was ranked number 4.
Scales of Measurement-Ordinal (Cont…..)
 Categories are mutually exclusive and exhaustive
 Differences between the category 1 and category 2, and
category 2 and category 3 are not the same
Table: Selected subjects by their social status
Social status Frequency
Poor 40
Middle class 110
Rich 50
Total 200
10
Scales of Measurement-Interval
Interval level: similar to the ordinal level, with the
additional property that meaningful amounts of
differences between data values can be
determined. There is no natural zero point.
EXAMPLE: Temperature on the Fahrenheit scale.
Scales of Measurement-Interval (Cont…..)
 Includes all the characteristics of ordinal level
 Differences between the values is a constant size
 Examples : temperature in Centigrade, calendar year
Difference between 960C and 980C is equal to the difference
between 1000C and 1020C
 00 C does not mean the ’no temperature!’
 Cannot say place A (with temperature 1000C) is 10 times more
warmer than place B (with temperature 100C)
 No absolute zero, zero is arbitrary
11
Scales of Measurement-Ratio
Ratio level: the interval level with an inherent
zero starting point. Differences and ratios are
meaningful for this level of measurement.
EXAMPLES: money, heights of NBA players.
Scales of Measurement-Ratio (Cont…..)
 The highest level of measurement that includes all the
characteristics of the interval level
 The point 0 indicates the absence of the characteristics.
Ratio between two numbers is meaningful
 Can say company A (with net wealth 100 b) is 10 times
more rich than company B (with net wealth 10 b)
12
23

SPSS

  • 1.
    1 Introduction to Statistics Day1, Session I M. Amir Hossain, Ph.D. January 17, 2016 What is Meant by Statistics? Statistics is the science of collecting, organizing, presenting, analyzing, and interpreting numerical data for the purpose of assisting in making a more effective decision.
  • 2.
    2 Who Uses Statistics? •Statistical techniques are used extensively by marketing, accounting, quality control, consumers, professional sports people, hospital administrators, educators, politicians, physicians, etc... Why Statistics is Studied?  We face numerical data all the time newspapers, sports magazines, business magazines  Statistical techniques are used to make decisions that effect our daily lives  Insurance companies use statistics to set rates for different insurance  Medical professional assess the performance of a new drug over the existing one  No matter what is your future line of work, you will make decisions that will involve data
  • 3.
    3 Types of Statistics •Descriptive Statistics: Methods of organizing, summarizing, and presenting data in an informative way. • EXAMPLE 1: A social survey found that 49% of the people knew the name of the first book of the Bible. The statistic 49 describes the number out of every 100 persons who knew the answer. Types of Statistics (Cont…..) Inferential statistics: Taking a sample from a population and making estimates/assumptions about a population, based on a sample.  A population is a collection of all possible individuals, objects, or measurements of interest.  A sample is a representative portion or part of the population of interest.
  • 4.
    4 Types of Variables Variableis a characteristics that can assume any set of prescribed values Age, Height, Weight, Eye color, Total population of a country Qualitative Variable (Attribute) Quantitative Variable Types of Variables (Cont….) Qualitative variable or Attribute: the characteristic or variable being studied is non- numeric. EXAMPLES: Gender, Religious affiliation, Type of automobile owned, Eye color.
  • 5.
    5 Types of Variables(Cont…..) Quantitative variable: the variable which can be measured and reported numerically. EXAMPLE: Balance in your savings account, Time remaining in class, Number of children in a family. Types of Variables (Cont….) Quantitative variables can be classified as either discrete or continuous. Discrete variables: can only assume certain values and there are usually “gaps” between values. EXAMPLE: the number of bedrooms in a house. (1,2,3,..., etc...).
  • 6.
    6 Types of Variables(Cont…) Quantitative Variables can be classified as either discrete or continuous. Continuous variables: can assume any value within a specific range. EXAMPLE: The time it takes to fly from Florida to New York. Scales of Measurement Measurement means assigning numbers or other symbols to characteristics of objects according to certain prescribed rules. Scaling is the generation of a continuum upon which measured objects are located Arithmetic and statistical operations for summarizing and presenting data depend on the levels of measurement
  • 7.
    7 Scales of Measurement(Cont…..) Four scales of measurement : Nominal scale Ordinal scale Interval scale Ratio scale Scales of Measurement –Nominal Nominal level (scaled): Data that can only be classified into categories and cannot be arranged in an ordering scheme. EXAMPLES: eye color, gender, religious affiliation.
  • 8.
    8 Scales of Measurement-Nominal(Cont…) Categories must be mutually exclusive and exhaustive Mutually exclusive: Categories are so defined that each member of the population is correctly allocated to one and only one category Exhaustive: each person, object, or item must be classified in at least one category i.e. A classification is exhaustive when it provides sufficient categories to accommodated all members of the population Scales of Measurement-Nominal (Cont…..) Categories are not of a particular order Table: Number of people by their place of Residence Division Number Percent Khulna 330 27.31 Rajshahi 251 20.78 Dhaka 400 33.11 Chittagong 118 9.77 Barisal 20 1.65 Sylhet 89 7.37 Total 1208 100
  • 9.
    9 Scales of Measurement-Ordinal Ordinallevel: involves data that may be arranged in some order, but differences between data values cannot be determined or are meaningless. EXAMPLE: During a taste test of 4 colas, cola C was ranked number 1, cola B was ranked number 2, cola A was ranked number 3, and cola D was ranked number 4. Scales of Measurement-Ordinal (Cont…..)  Categories are mutually exclusive and exhaustive  Differences between the category 1 and category 2, and category 2 and category 3 are not the same Table: Selected subjects by their social status Social status Frequency Poor 40 Middle class 110 Rich 50 Total 200
  • 10.
    10 Scales of Measurement-Interval Intervallevel: similar to the ordinal level, with the additional property that meaningful amounts of differences between data values can be determined. There is no natural zero point. EXAMPLE: Temperature on the Fahrenheit scale. Scales of Measurement-Interval (Cont…..)  Includes all the characteristics of ordinal level  Differences between the values is a constant size  Examples : temperature in Centigrade, calendar year Difference between 960C and 980C is equal to the difference between 1000C and 1020C  00 C does not mean the ’no temperature!’  Cannot say place A (with temperature 1000C) is 10 times more warmer than place B (with temperature 100C)  No absolute zero, zero is arbitrary
  • 11.
    11 Scales of Measurement-Ratio Ratiolevel: the interval level with an inherent zero starting point. Differences and ratios are meaningful for this level of measurement. EXAMPLES: money, heights of NBA players. Scales of Measurement-Ratio (Cont…..)  The highest level of measurement that includes all the characteristics of the interval level  The point 0 indicates the absence of the characteristics. Ratio between two numbers is meaningful  Can say company A (with net wealth 100 b) is 10 times more rich than company B (with net wealth 10 b)
  • 12.