Download to read offline

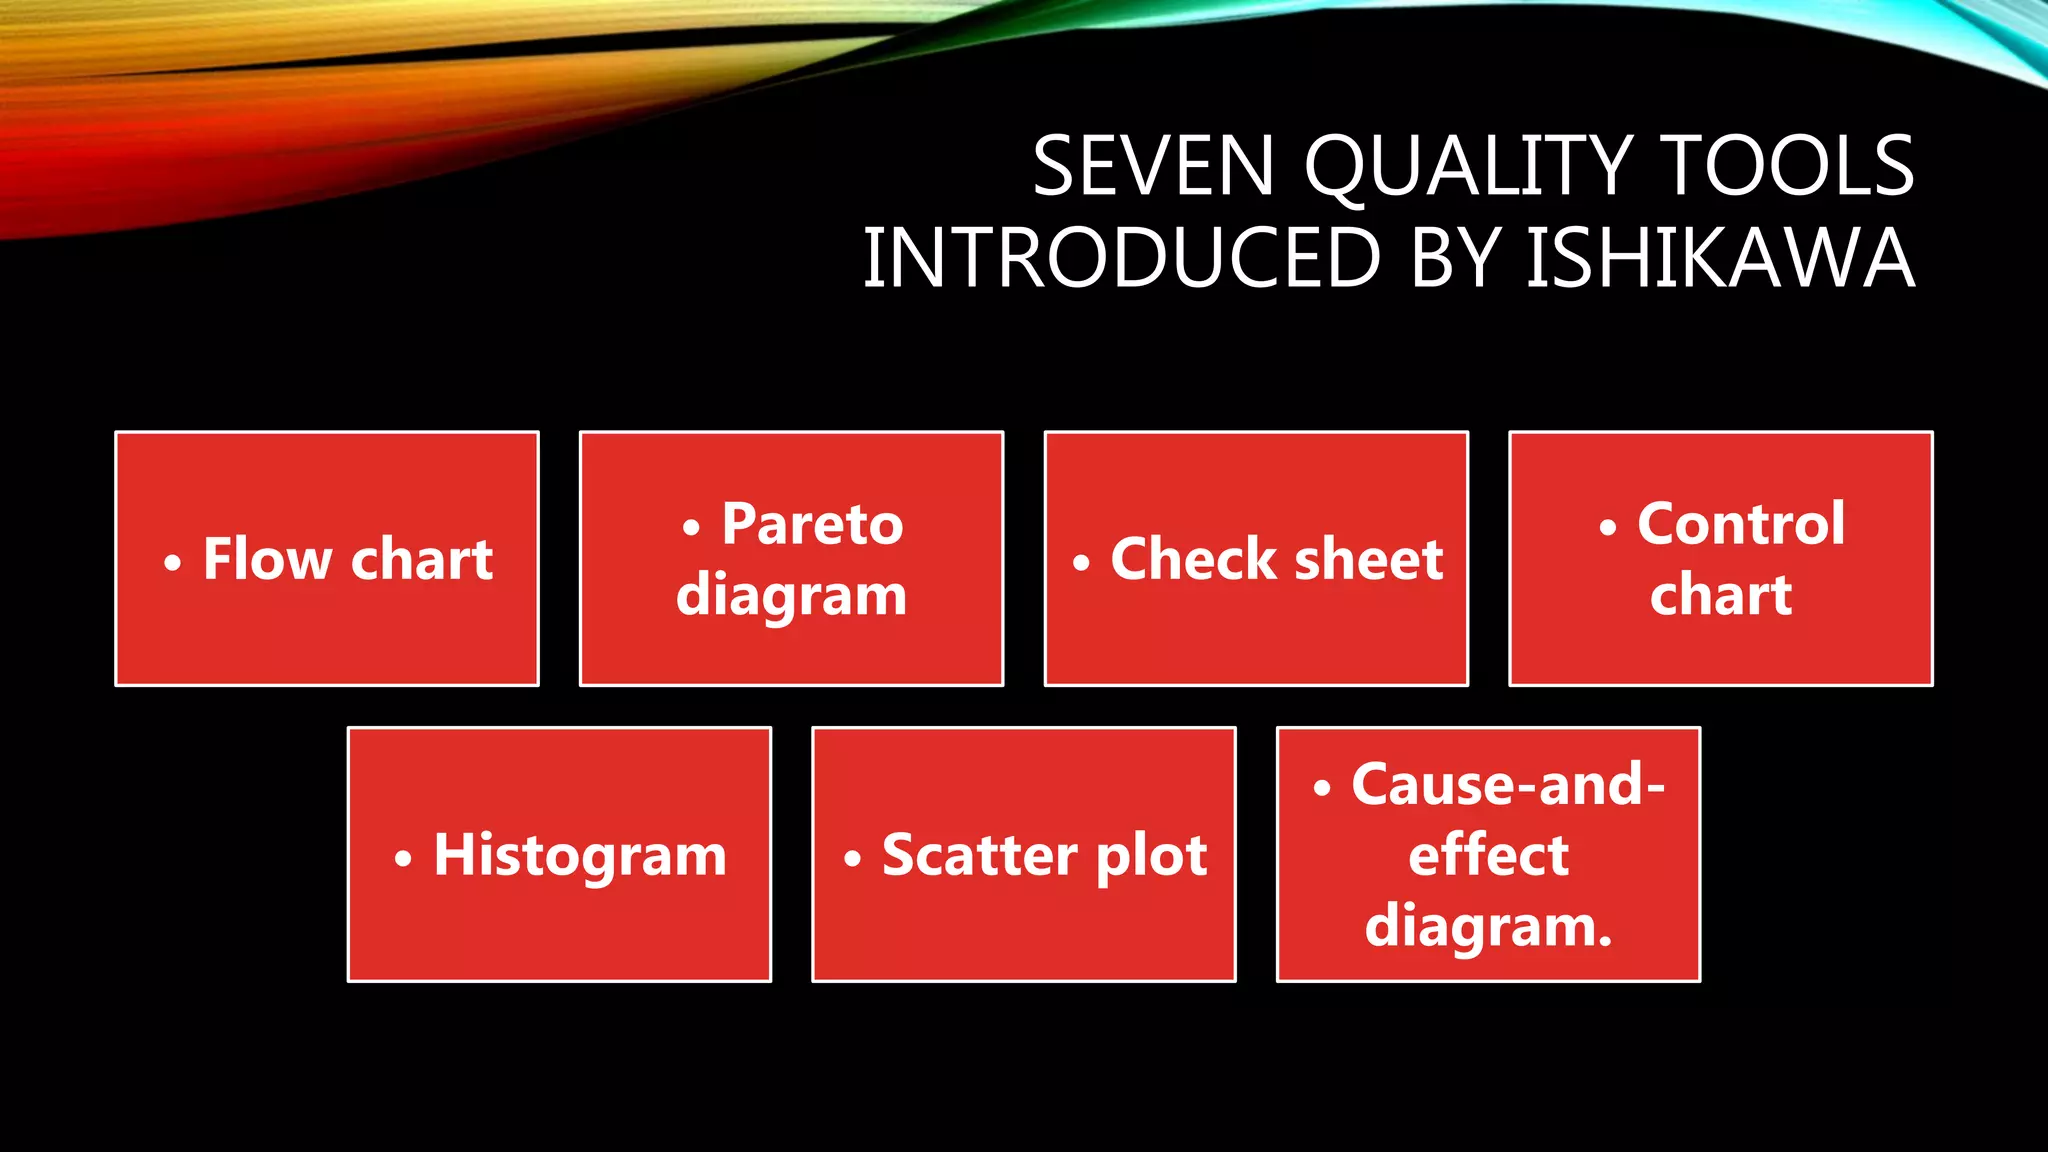
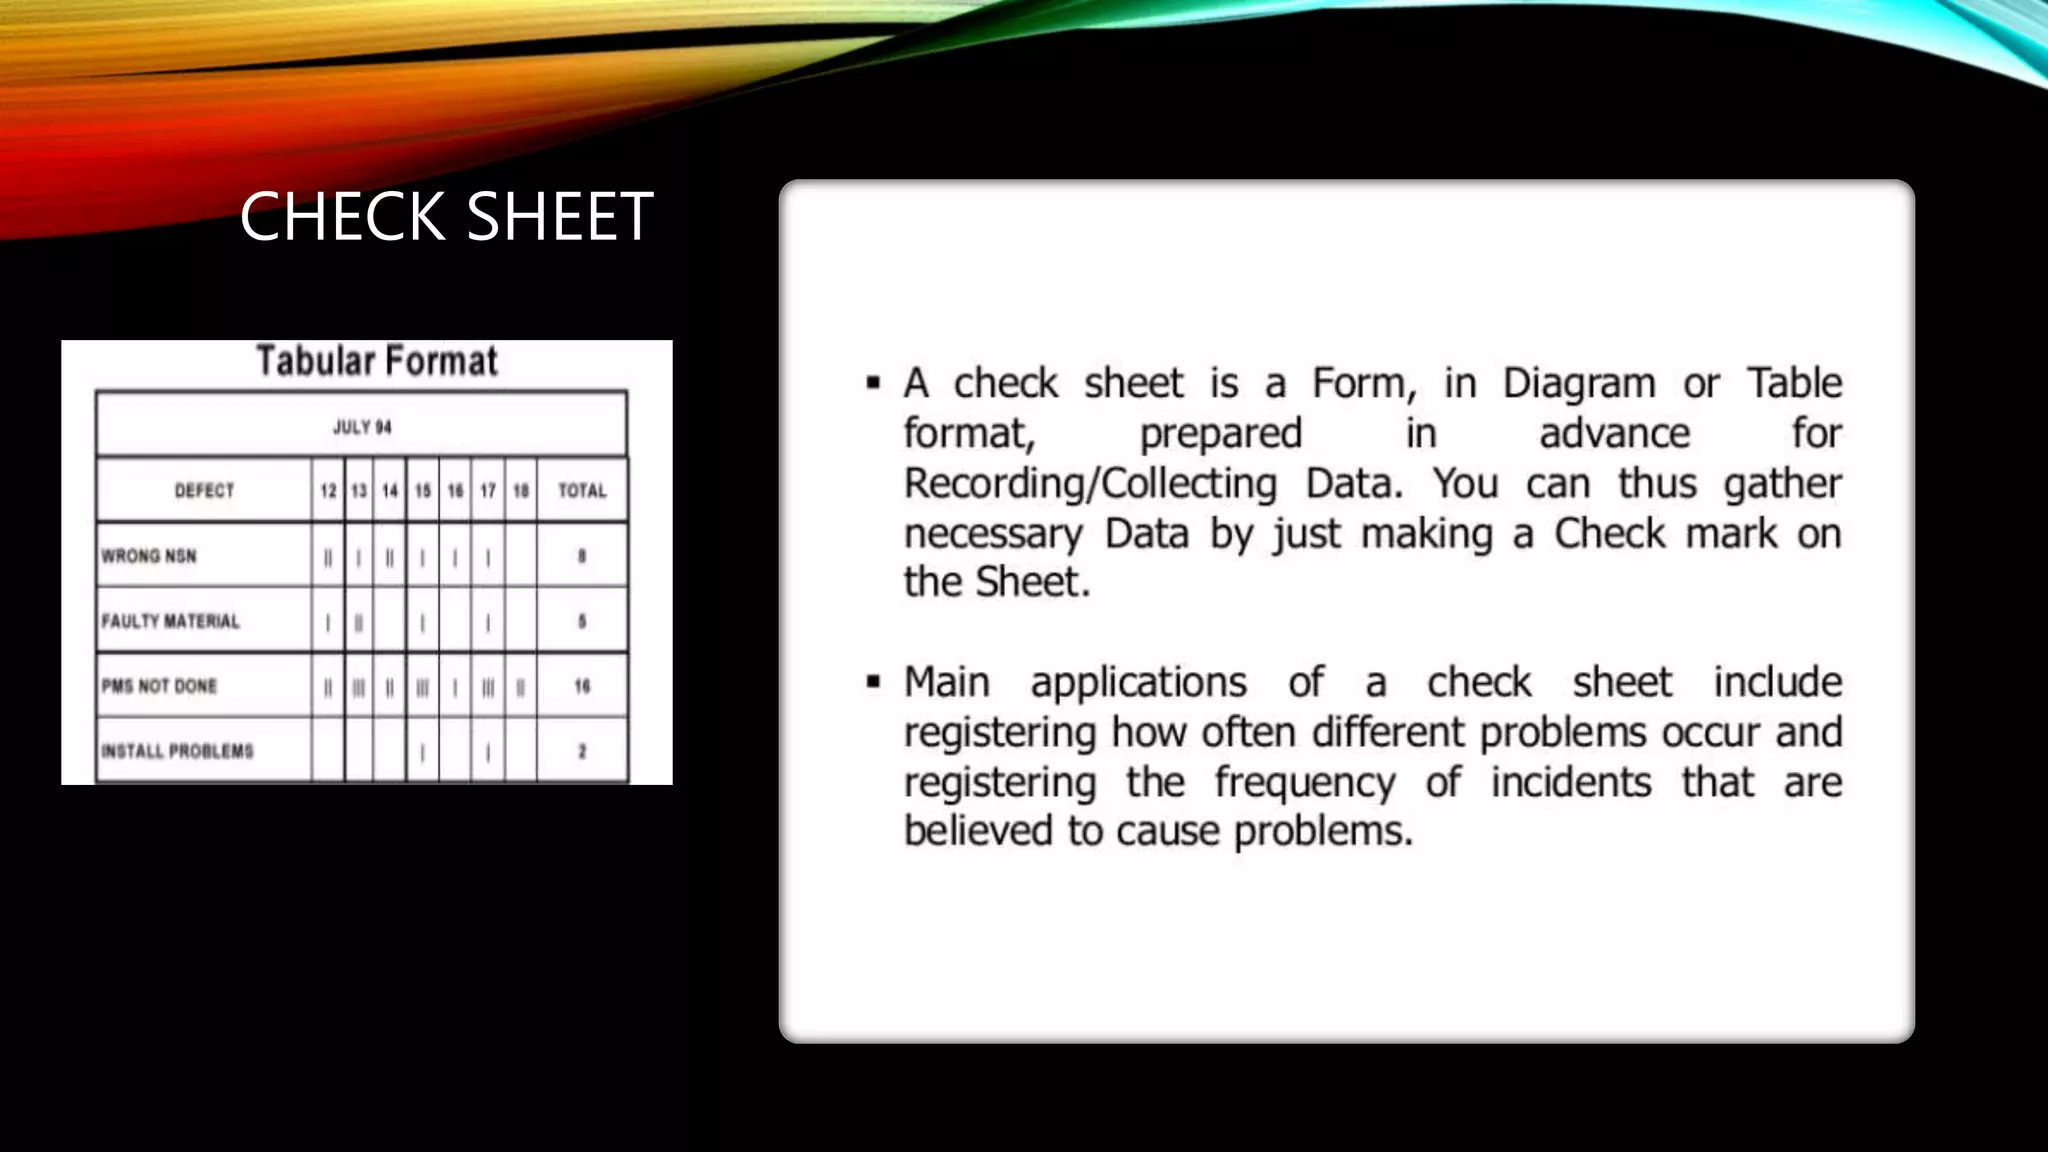
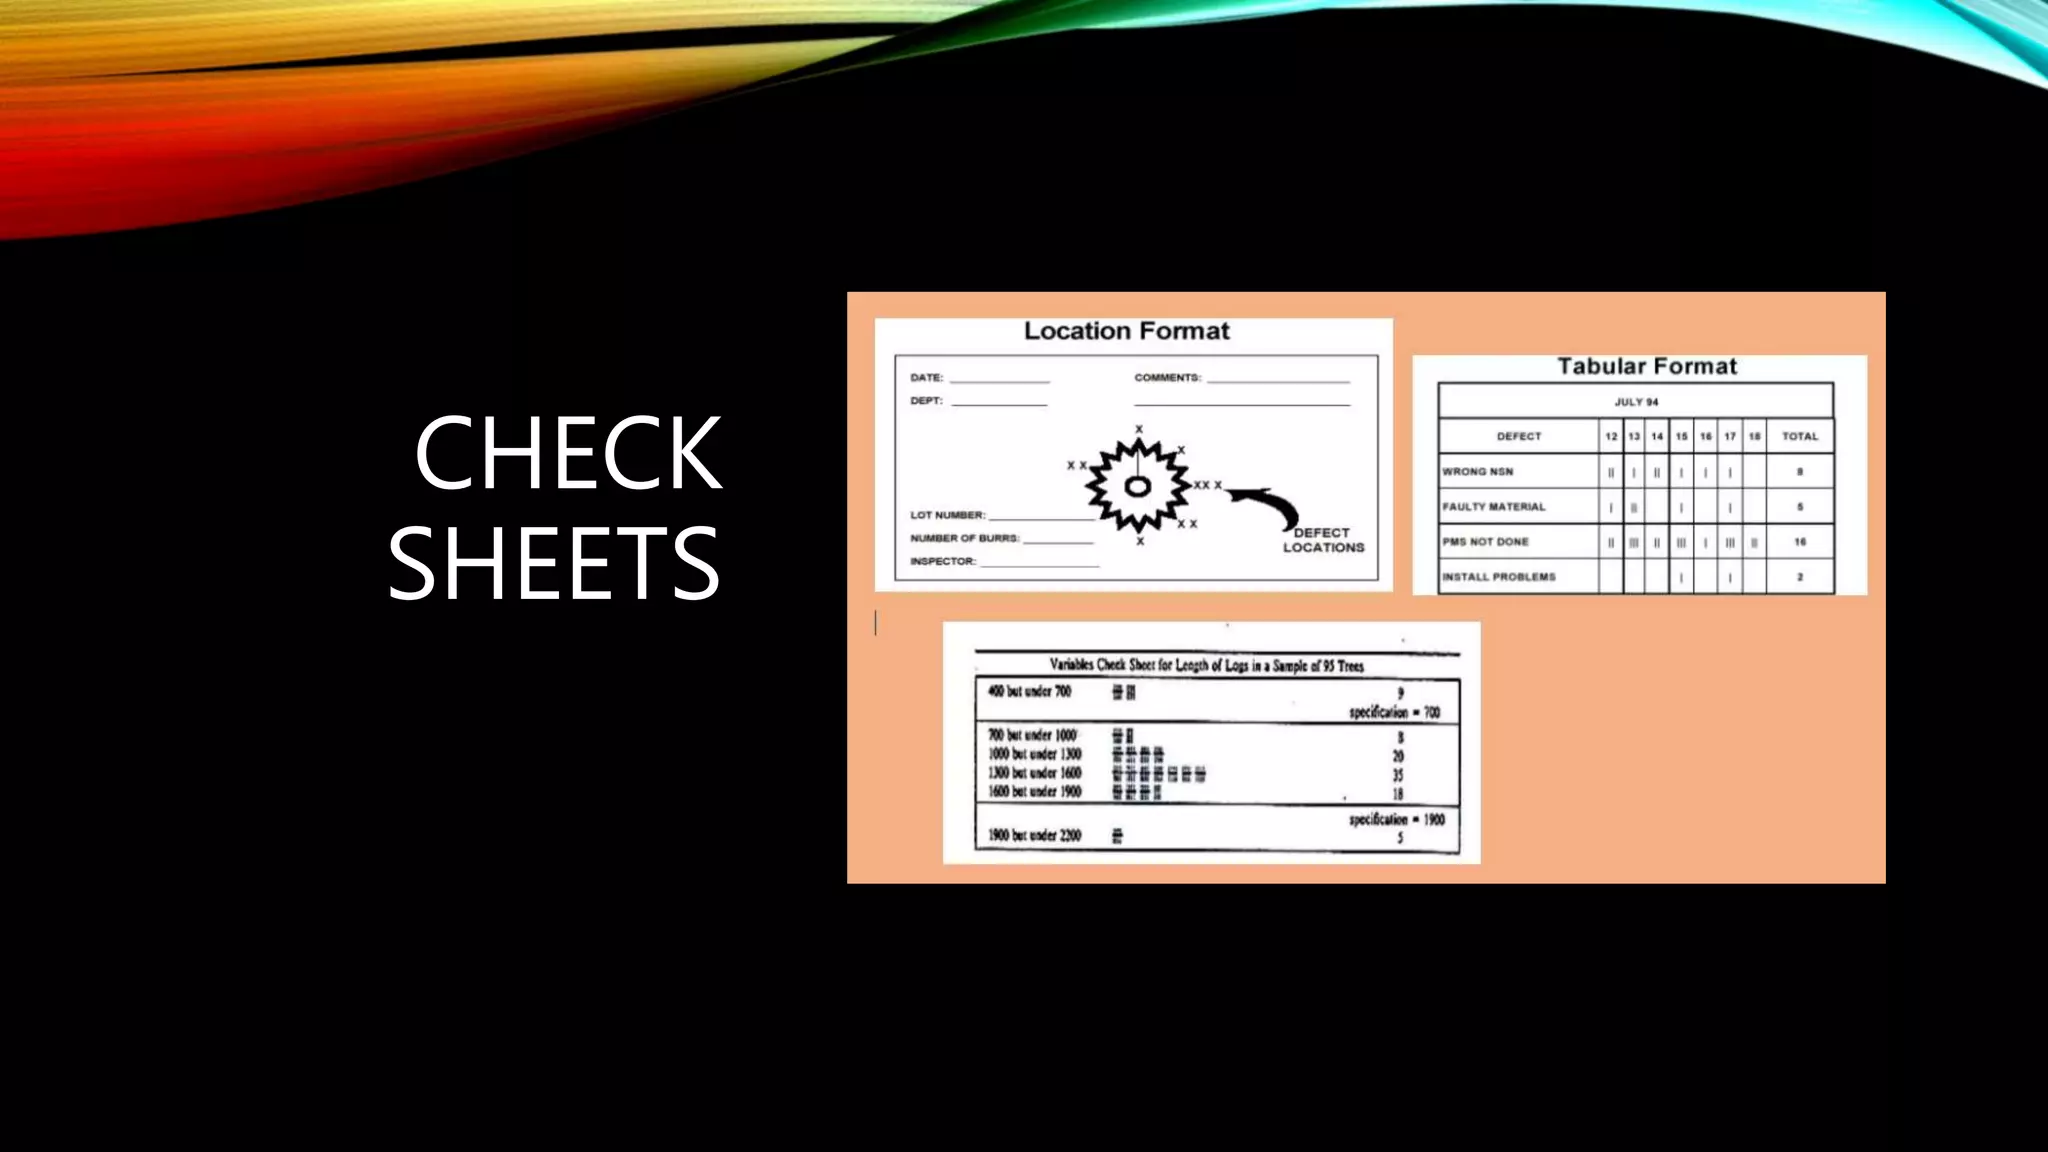
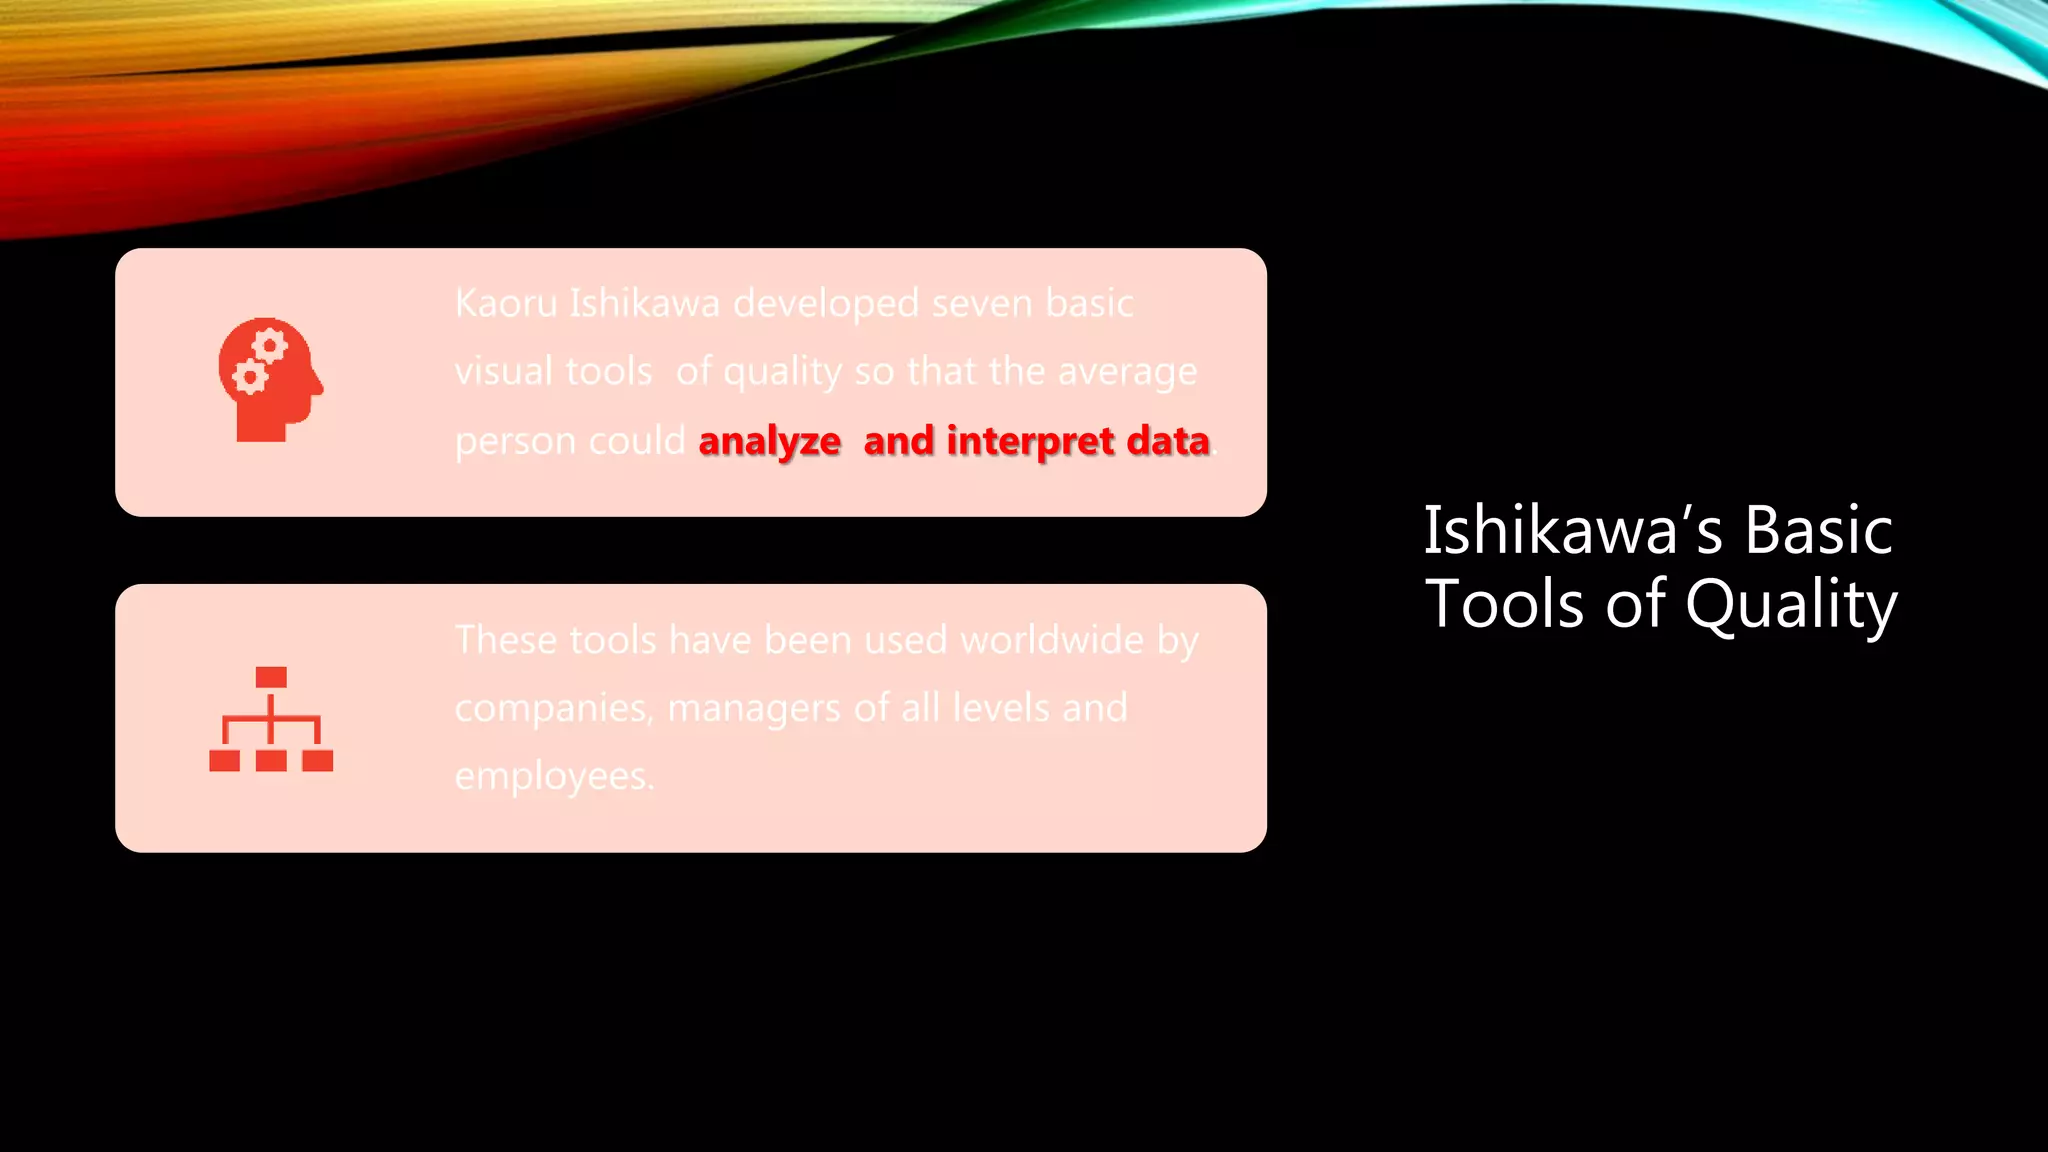
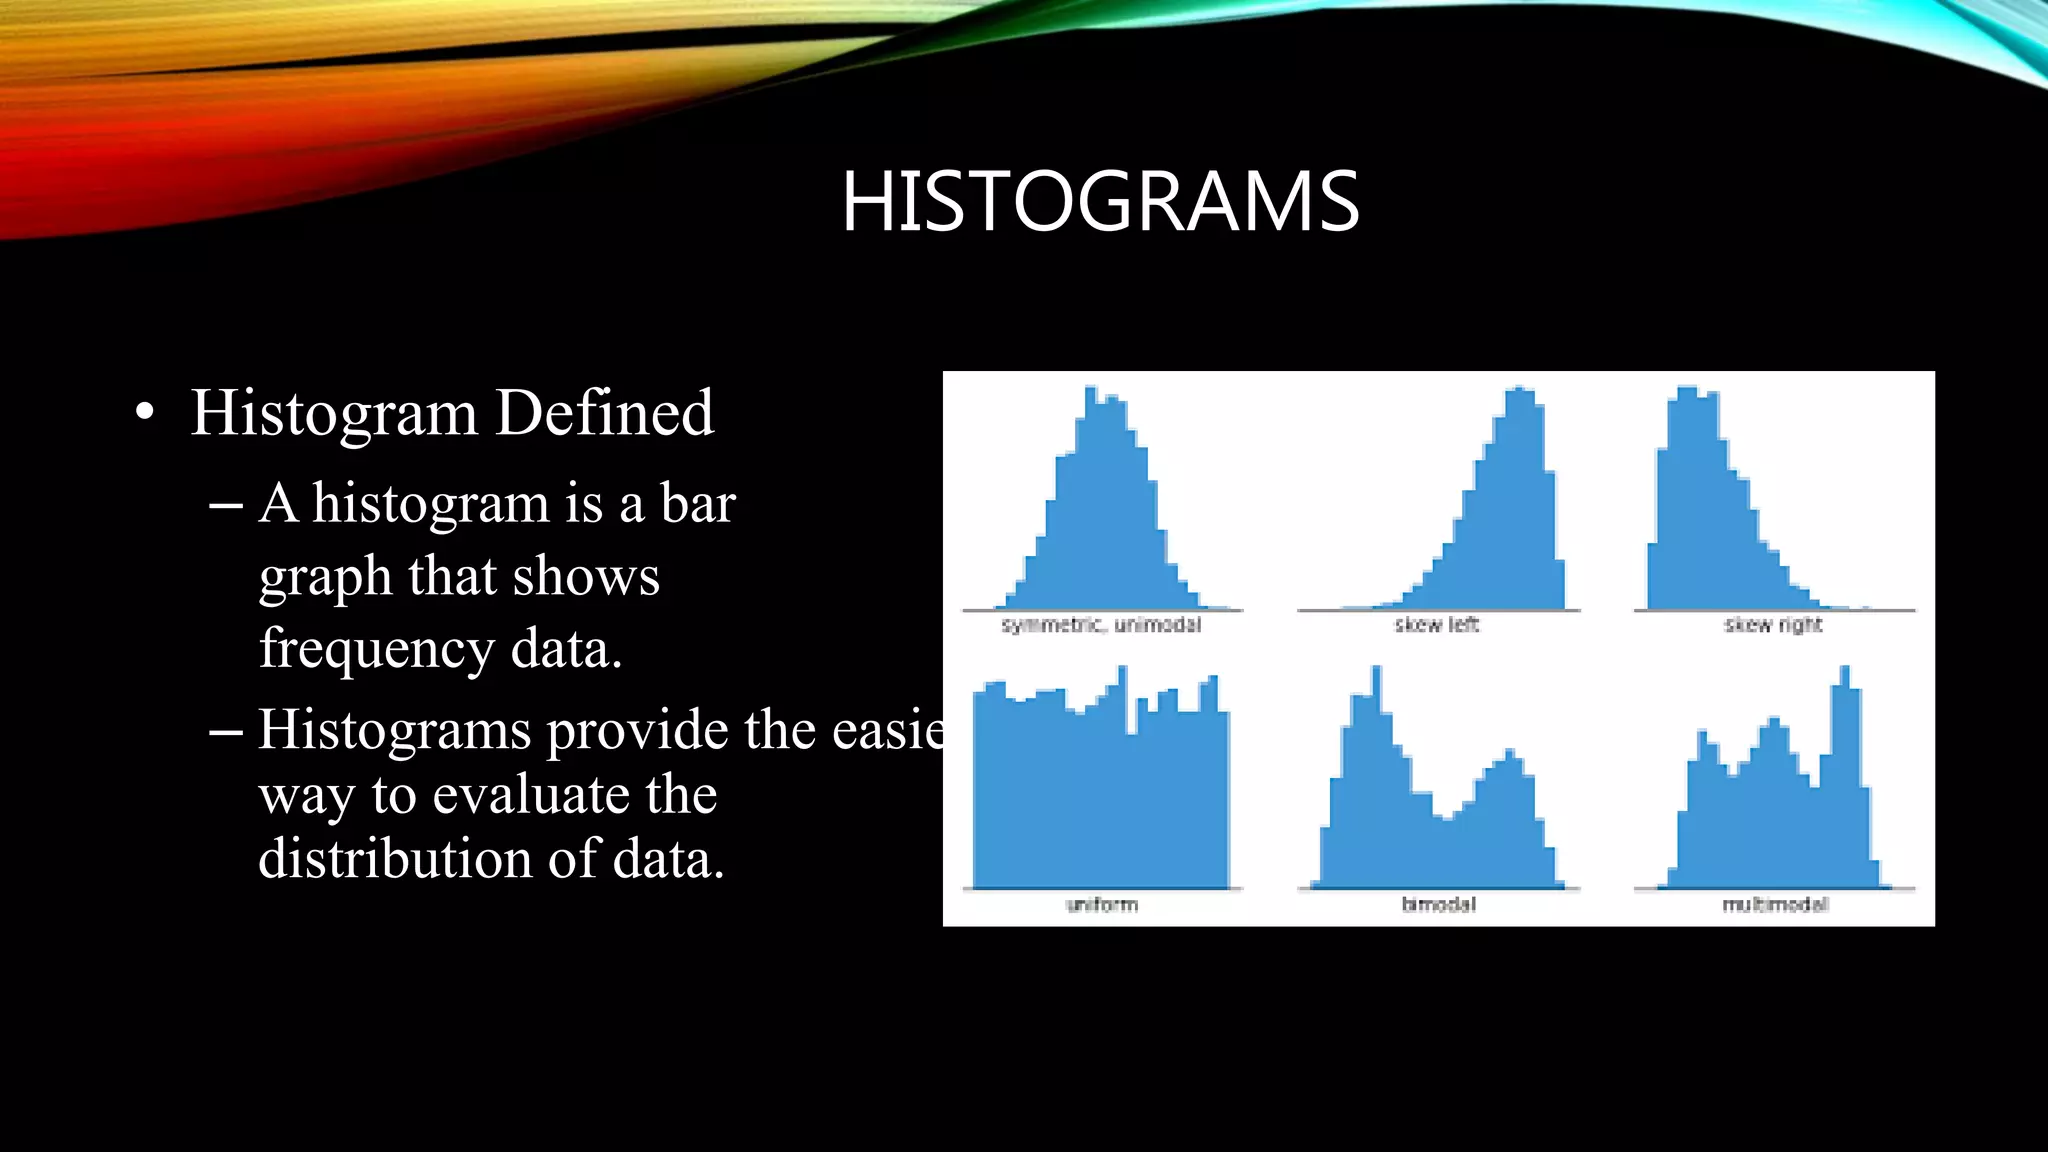
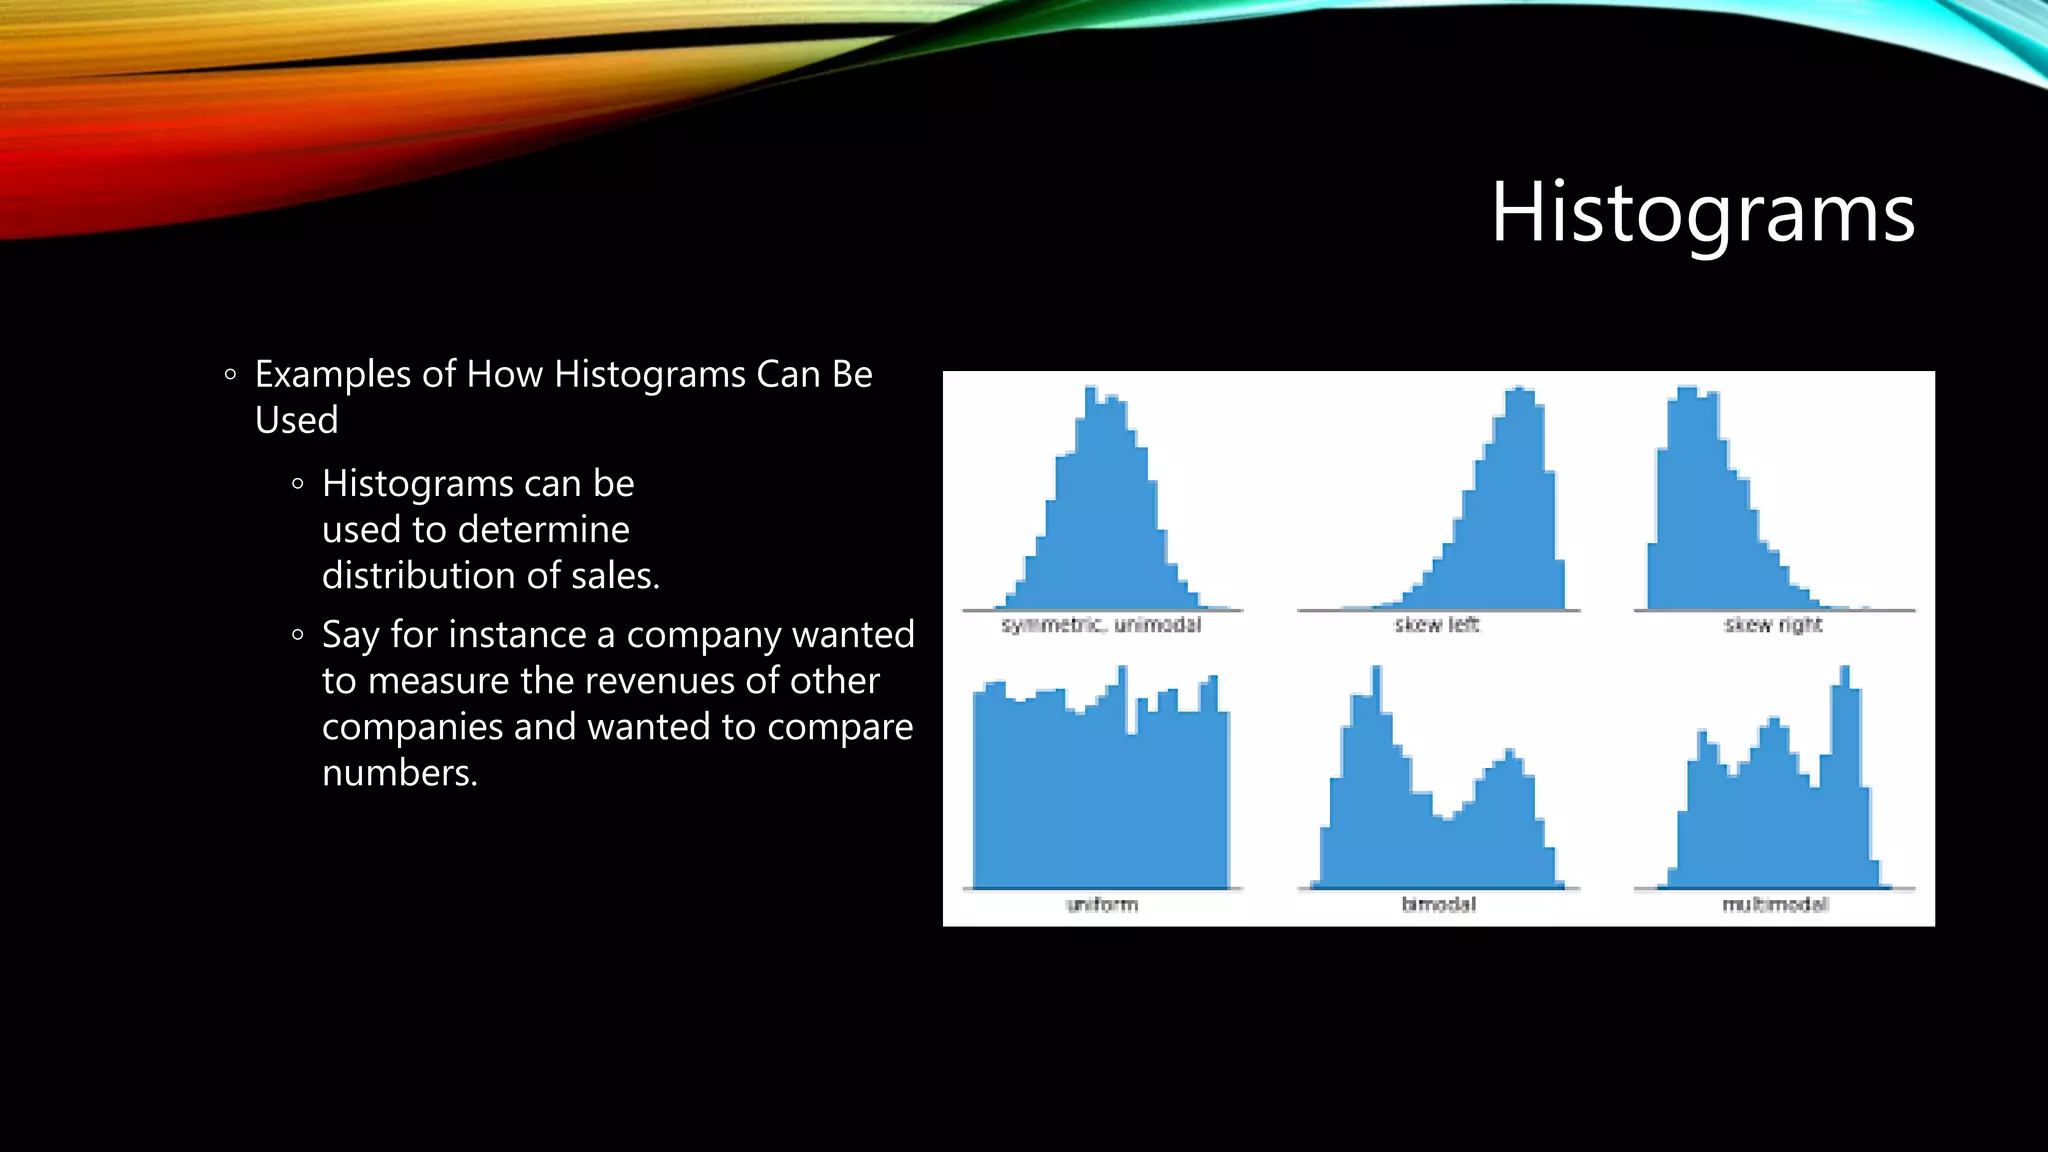
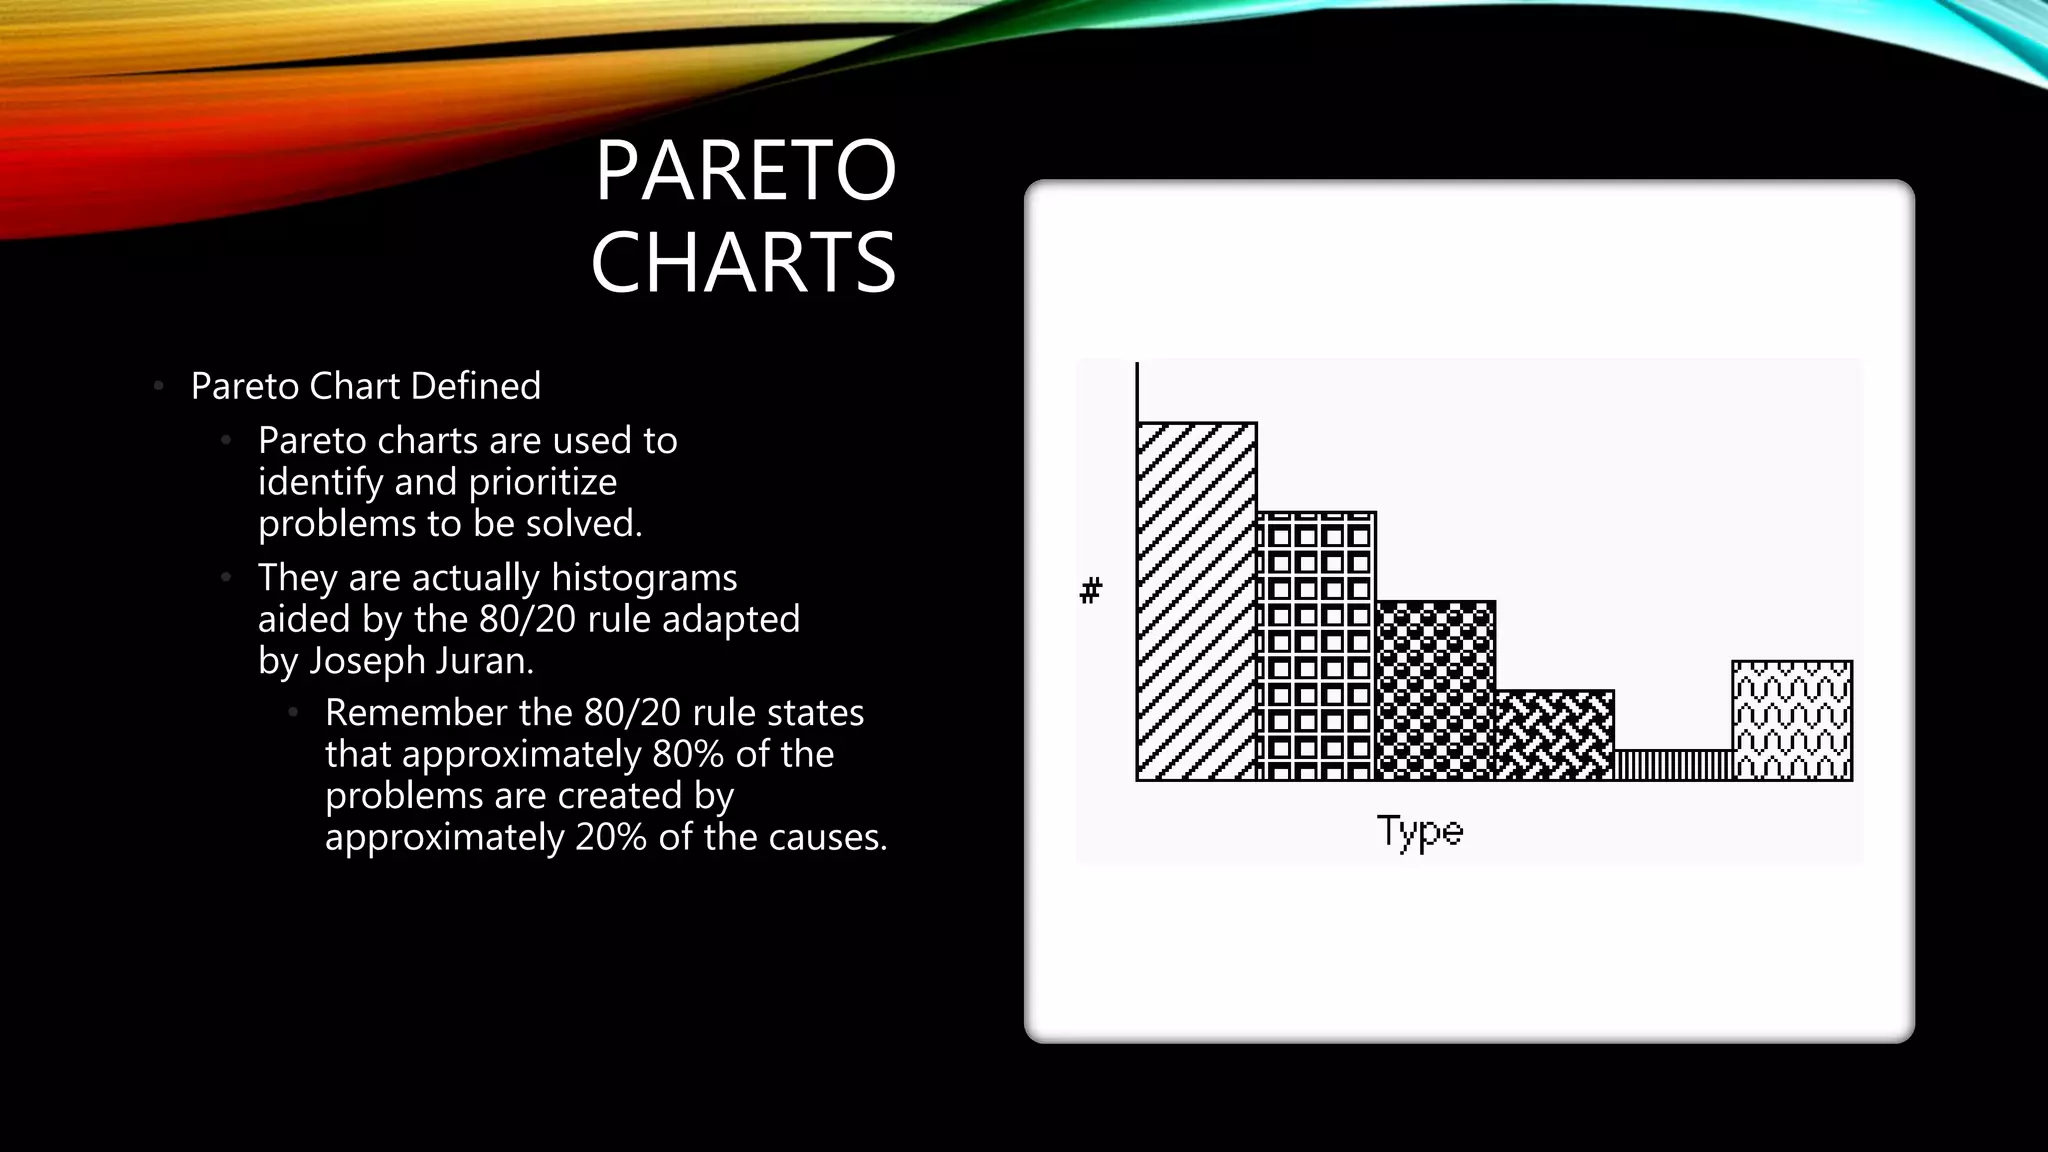
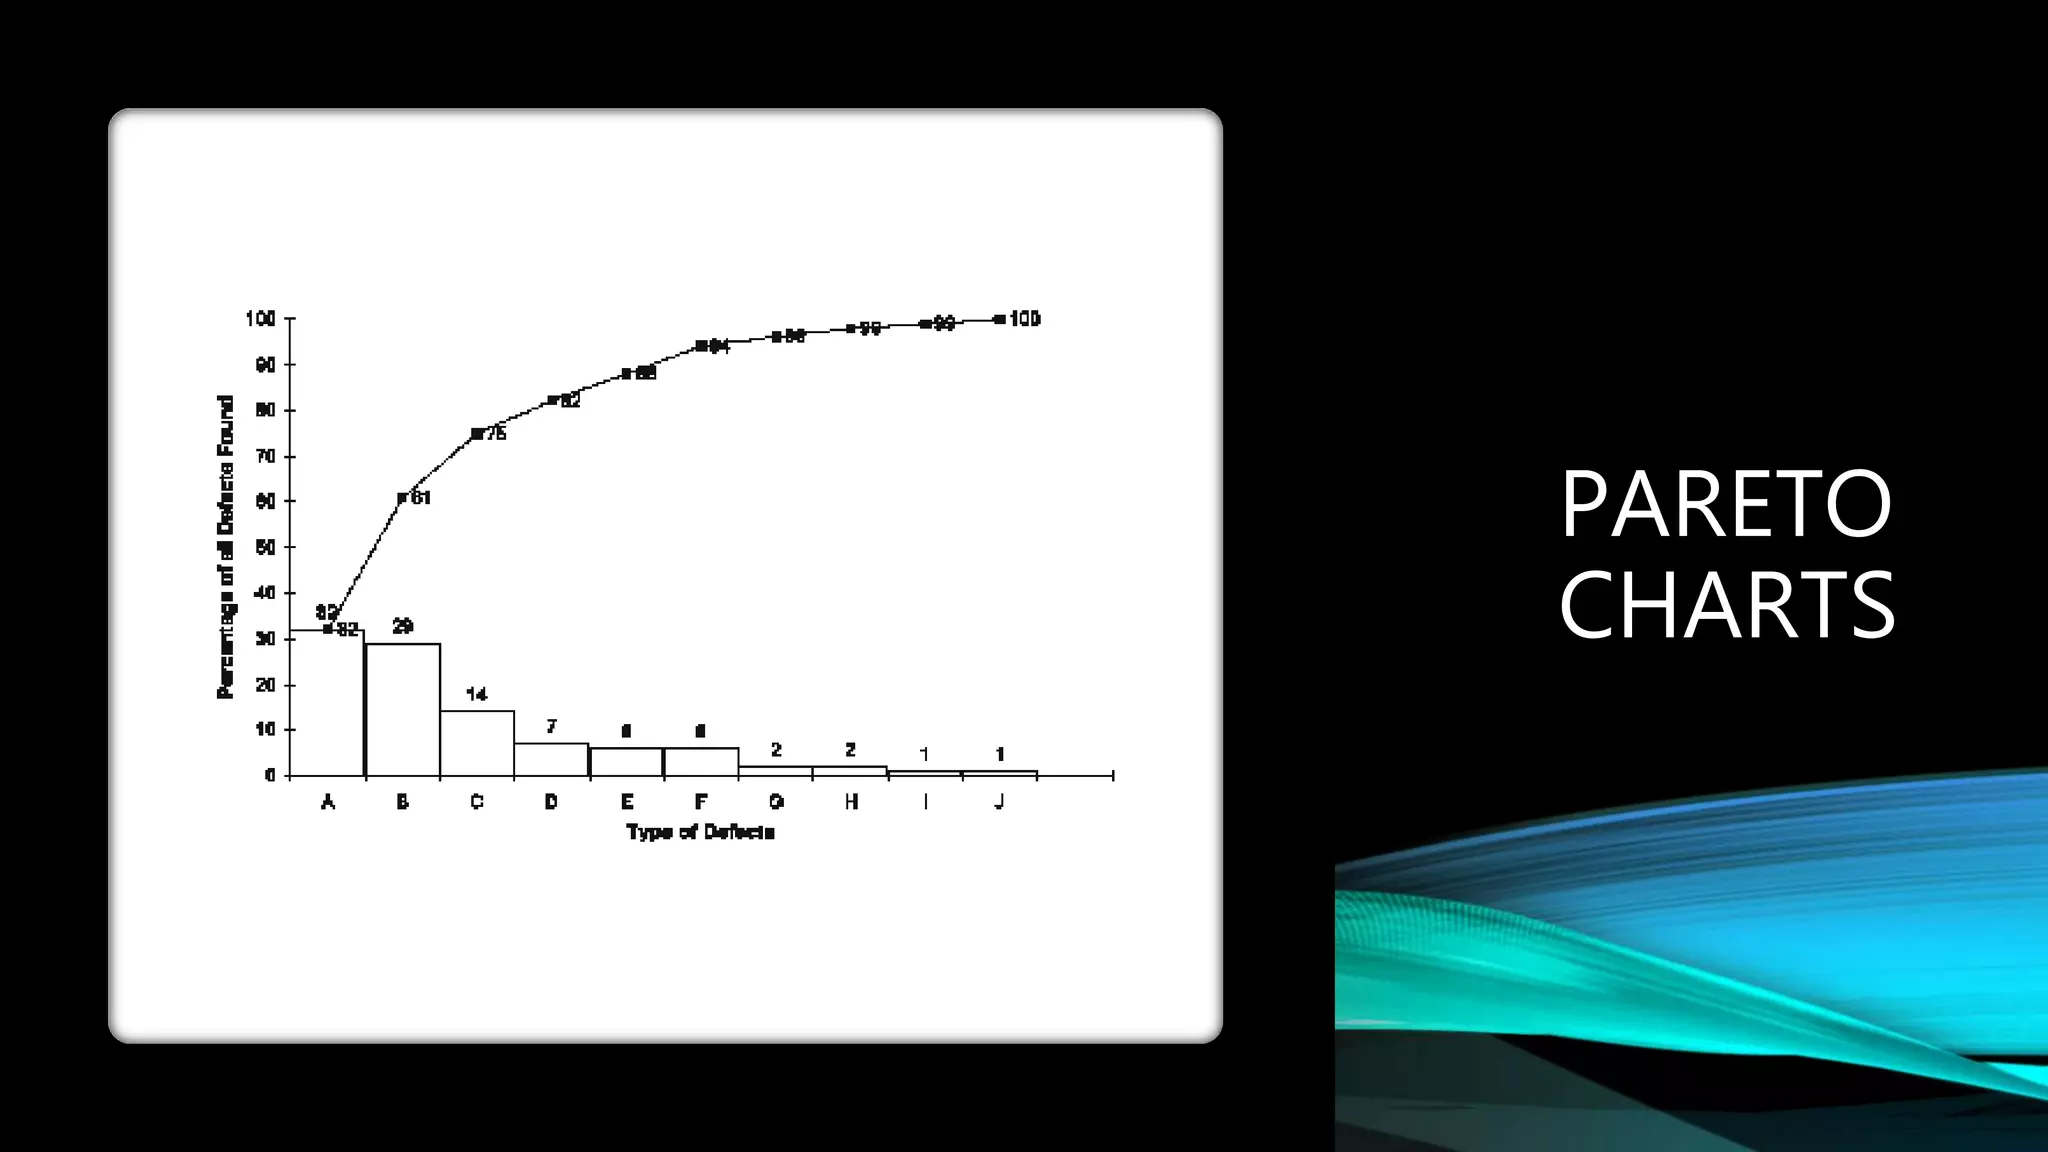
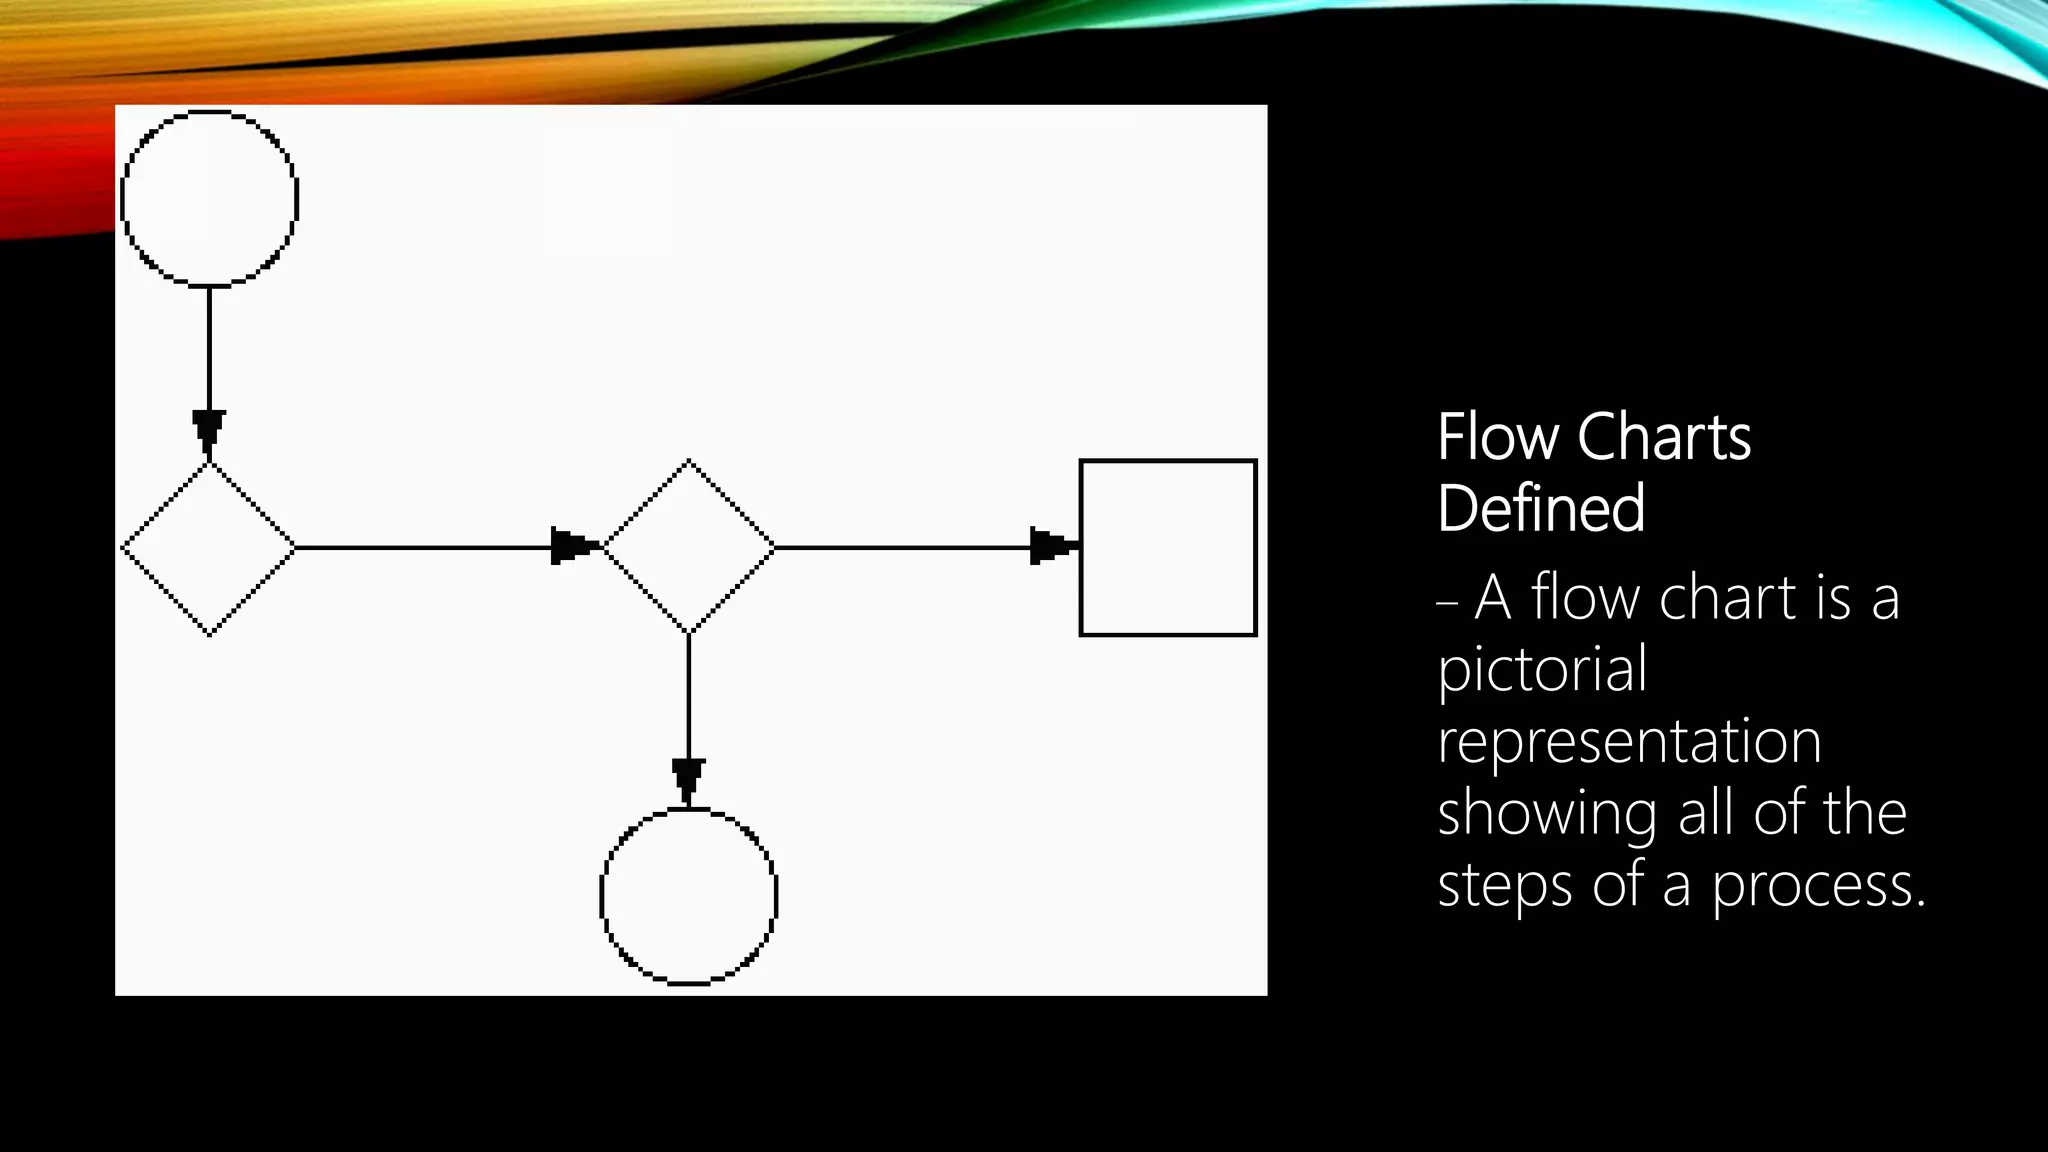
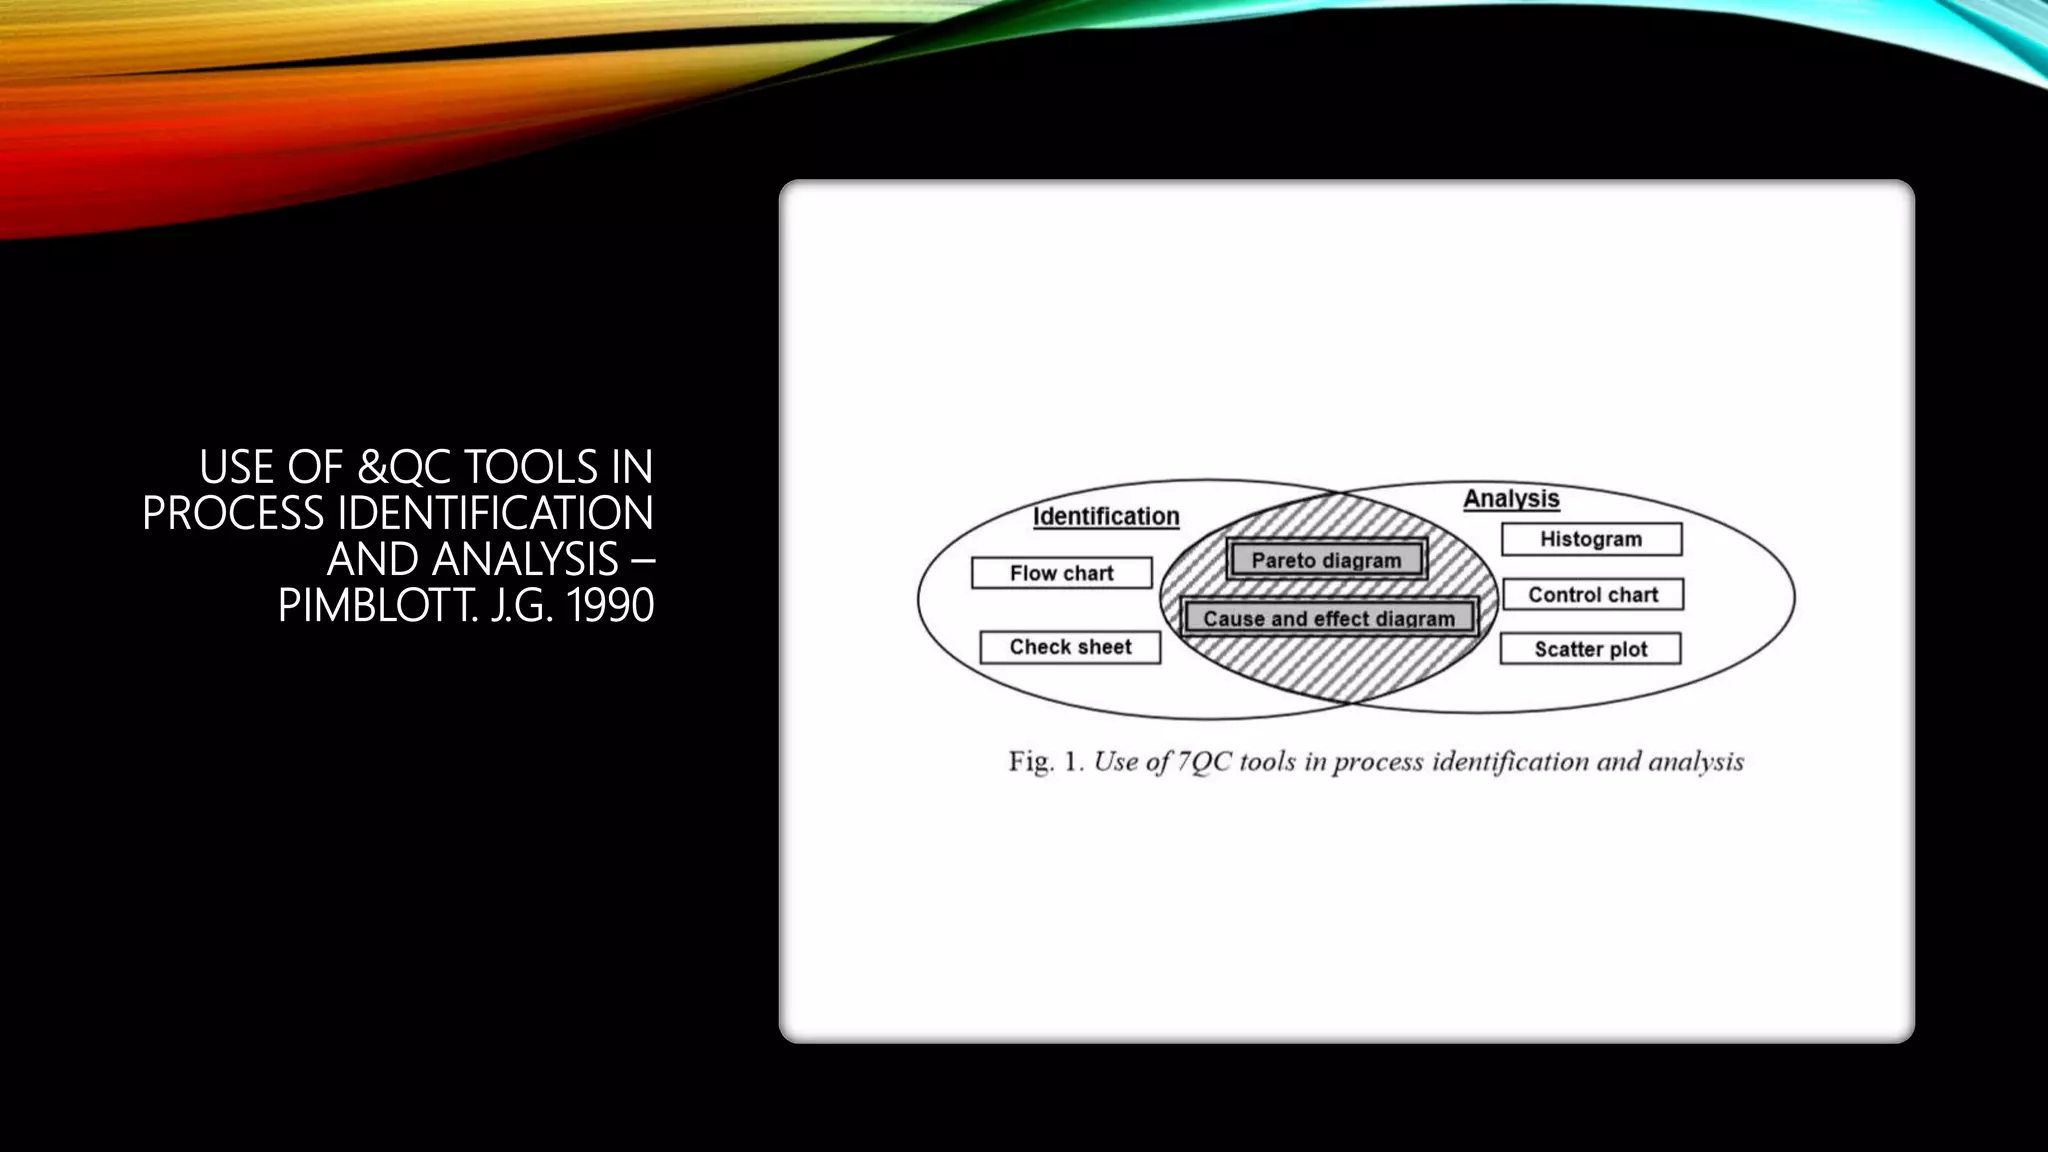
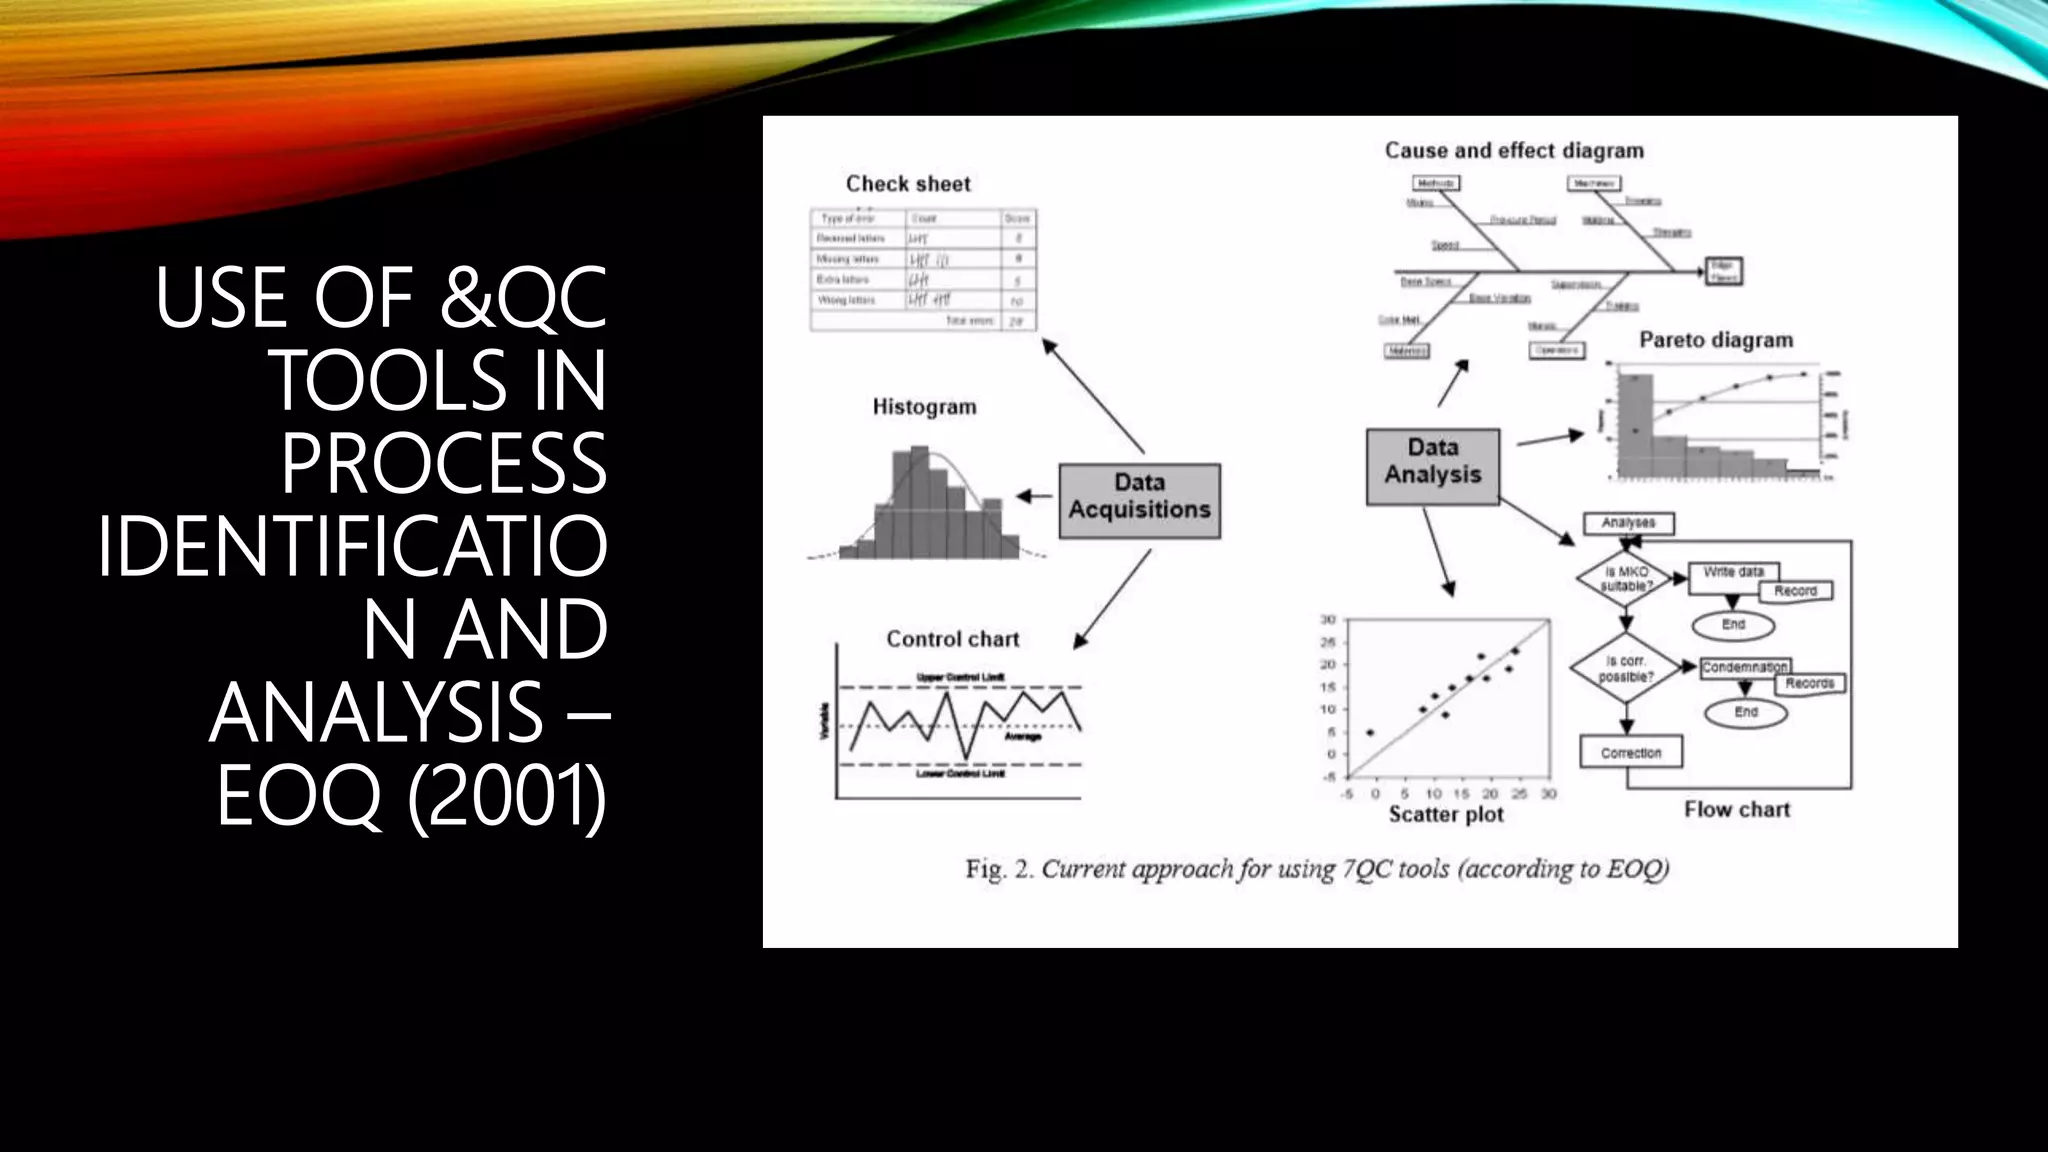
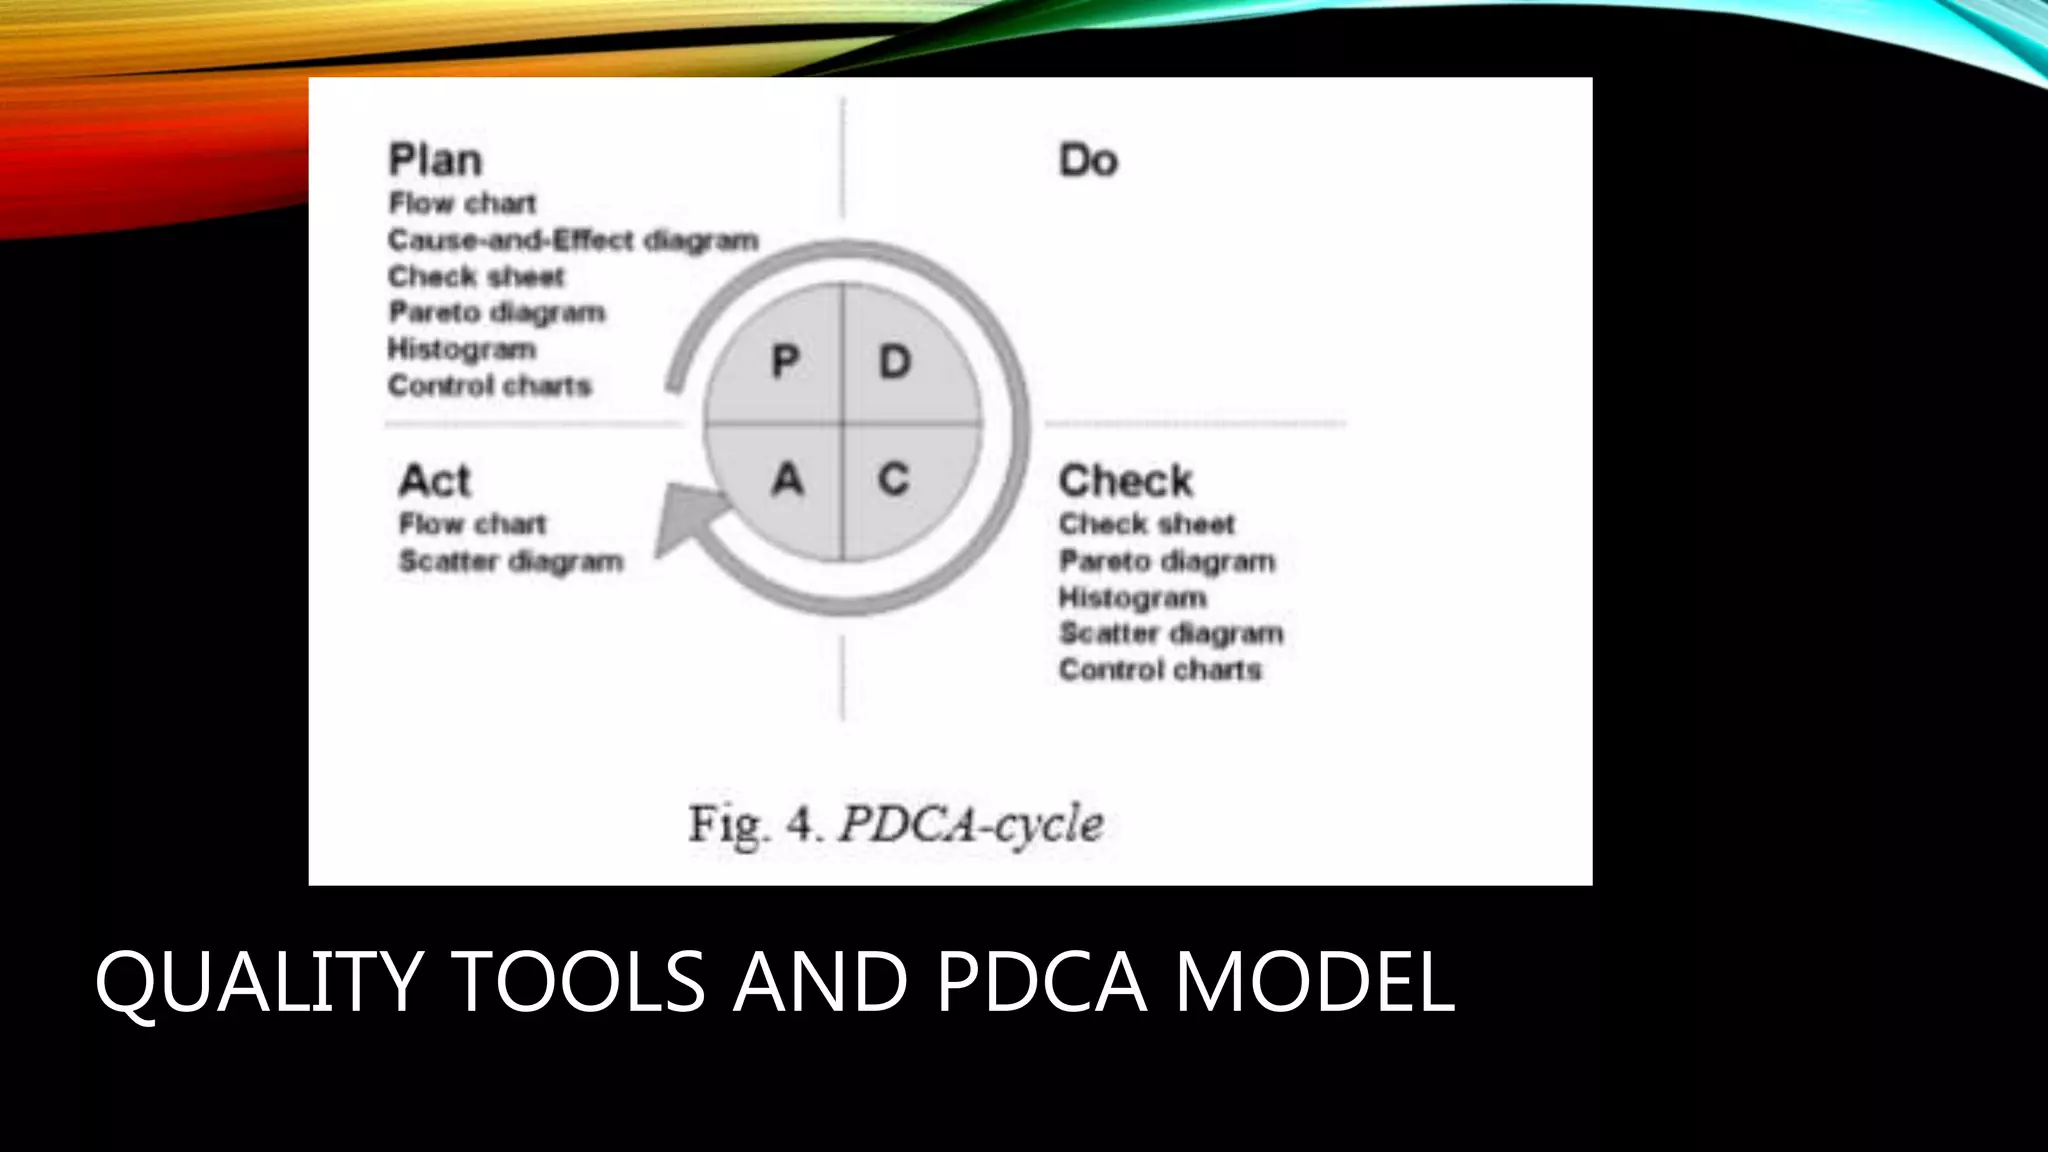
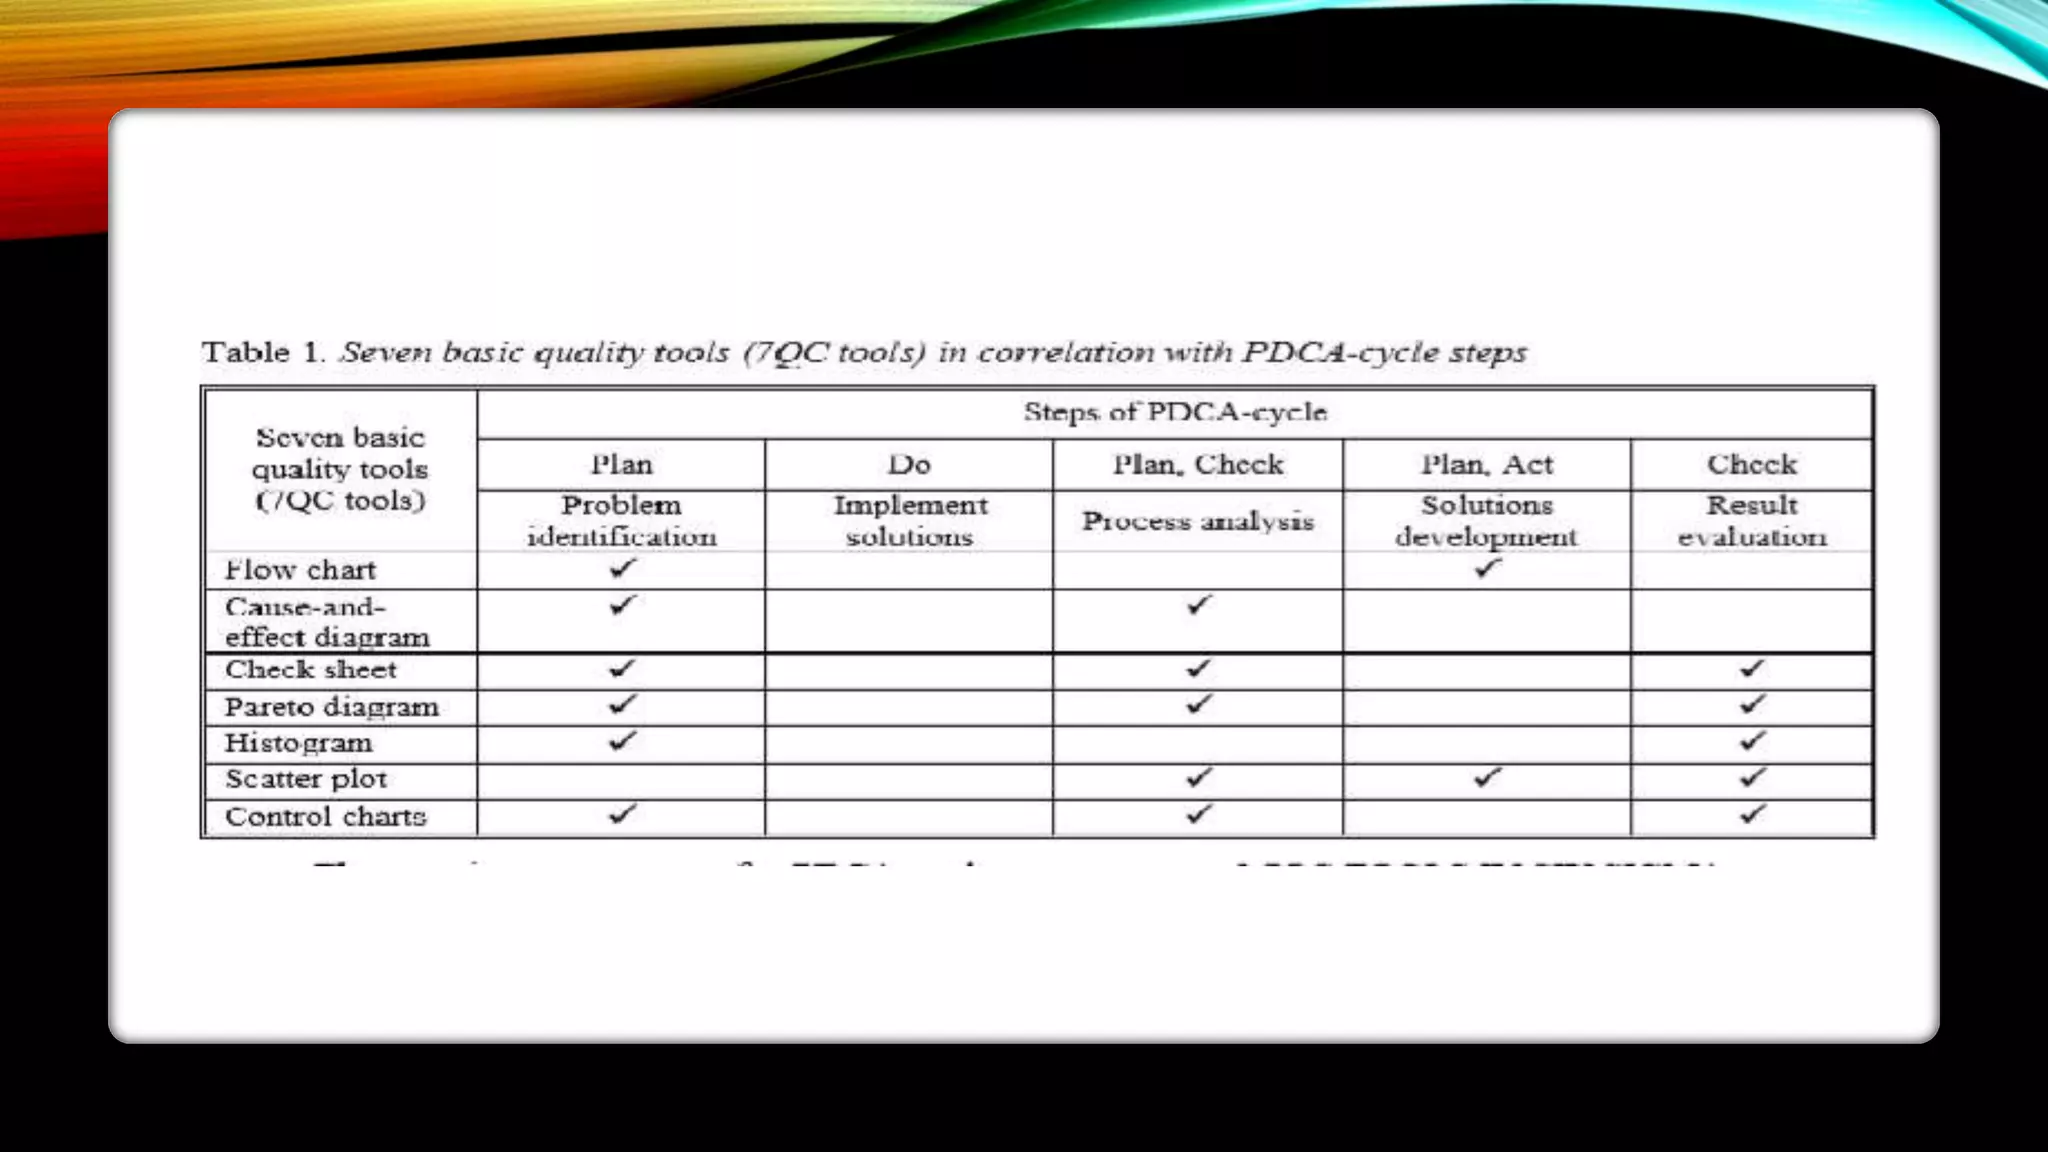


This document presents an overview of the seven basic quality tools introduced by Kaoru Ishikawa: flow chart, Pareto diagram, check sheet, control chart, histogram, scatter plot, and cause-and-effect diagram. Each tool is defined and an example is provided of how it can be used. The tools are designed to help average people analyze and interpret data to solve problems and improve processes.


![7 qc tools[1] to print](https://cdn.slidesharecdn.com/ss_thumbnails/7qctools1toprint-191017092858-thumbnail.jpg?width=640&height=640&fit=bounds)


![Qcl 14-v3 [pareto diagram]-[banathali_university]_[suyashi_rastogi]](https://cdn.slidesharecdn.com/ss_thumbnails/qcl-14-v3paretodiagrambanathaliuniversitysuyashirastogi-141231143056-conversion-gate01-thumbnail.jpg?width=640&height=640&fit=bounds)