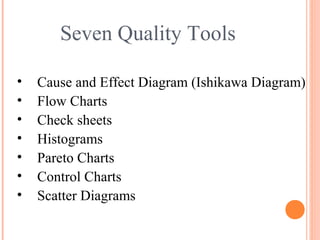
The document provides information about quality management tools including Ishikawa diagrams, Pareto charts, and Poka-Yoke. It describes each tool, providing examples and explaining their purpose and how they are used.
Ishikawa diagram
Acommon use of the Ishikawa diagram is in product design, to
identify desirable factors leading to an overall effect.
It is known as a fishbone diagram because of its shape.
Fishbone diagram (also known as Ishikawa diagram) was created
with the goal of identifying and grouping the causes which generate
a quality problem
Fishbone diagram become a very useful instrument in risk
identification stage.
4.
Ishikawa diagram
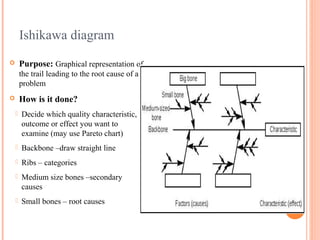
Purpose:Graphical representation of
the trail leading to the root cause of a
problem
How is it done?
Decide which quality characteristic,
outcome or effect you want to
examine (may use Pareto chart)
Backbone –draw straight line
Ribs – categories
Medium size bones –secondary
causes
Small bones – root causes
5.
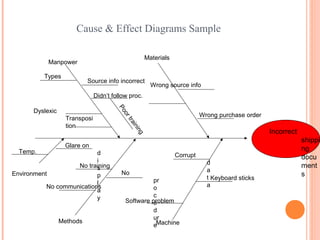
Cause & EffectDiagrams Sample
Incorrect
shippi
ng
docu
ment
s
Manpower
Materials
Methods Machine
Environment
Keyboard sticks
Wrong source info
Wrong purchase order
Types
Source info incorrect
Dyslexic
Transposi
tion
Didn’t follow proc.
Poortraining
Glare on
d
i
s
p
l
a
y
Temp.
No
pr
o
c
e
d
ur
e
No communications
No training
Software problem
Corrupt
d
a
t
a
6.
Pareto Chart
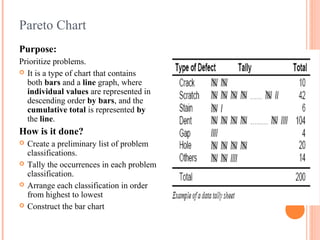
Purpose:
Prioritize problems.
It is a type of chart that contains
both bars and a line graph, where
individual values are represented in
descending order by bars, and the
cumulative total is represented by
the line.
How is it done?
Create a preliminary list of problem
classifications.
Tally the occurrences in each problem
classification.
Arrange each classification in order
from highest to lowest
Construct the bar chart
7.
Pareto Chart
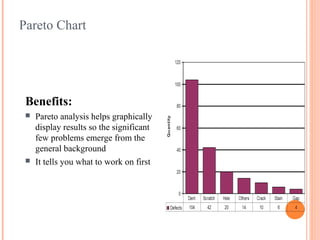
Benefits:
Paretoanalysis helps graphically
display results so the significant
few problems emerge from the
general background
It tells you what to work on first
8.
Poka Yoke
Poka-Yokewas developed by Shigeo Shingo from
Toyota Motors as a tool to achieve Zero Defects.
• The process of Zero Defects is also known as “Mistake
Proofing” or “Fail-Safe”.
• By taking over repetitive tasks or actions that depend on
vigilance or memory, Poka-Yoke can free workers’ time
and mind to pursue more value added activities.
9.
Poka Yoke
Everyinspection method has weaknesses.
• Prevention of defects is better than detection.
• Poka-yoke devices can be applied within any process.
• Focus on the critical functions and actions.
• Sources of defects can be challenged and eliminated.
10.
Poka Yoke
Mistake-proofingsystems
Does not rely on operators
catching mistakes
Inexpensive Point of Origin
inspection
Quick feedback 100% of the time


![7 qc tools[1] to print](https://cdn.slidesharecdn.com/ss_thumbnails/7qctools1toprint-191017092858-thumbnail.jpg?width=640&height=640&fit=bounds)


