Downloaded 140 times


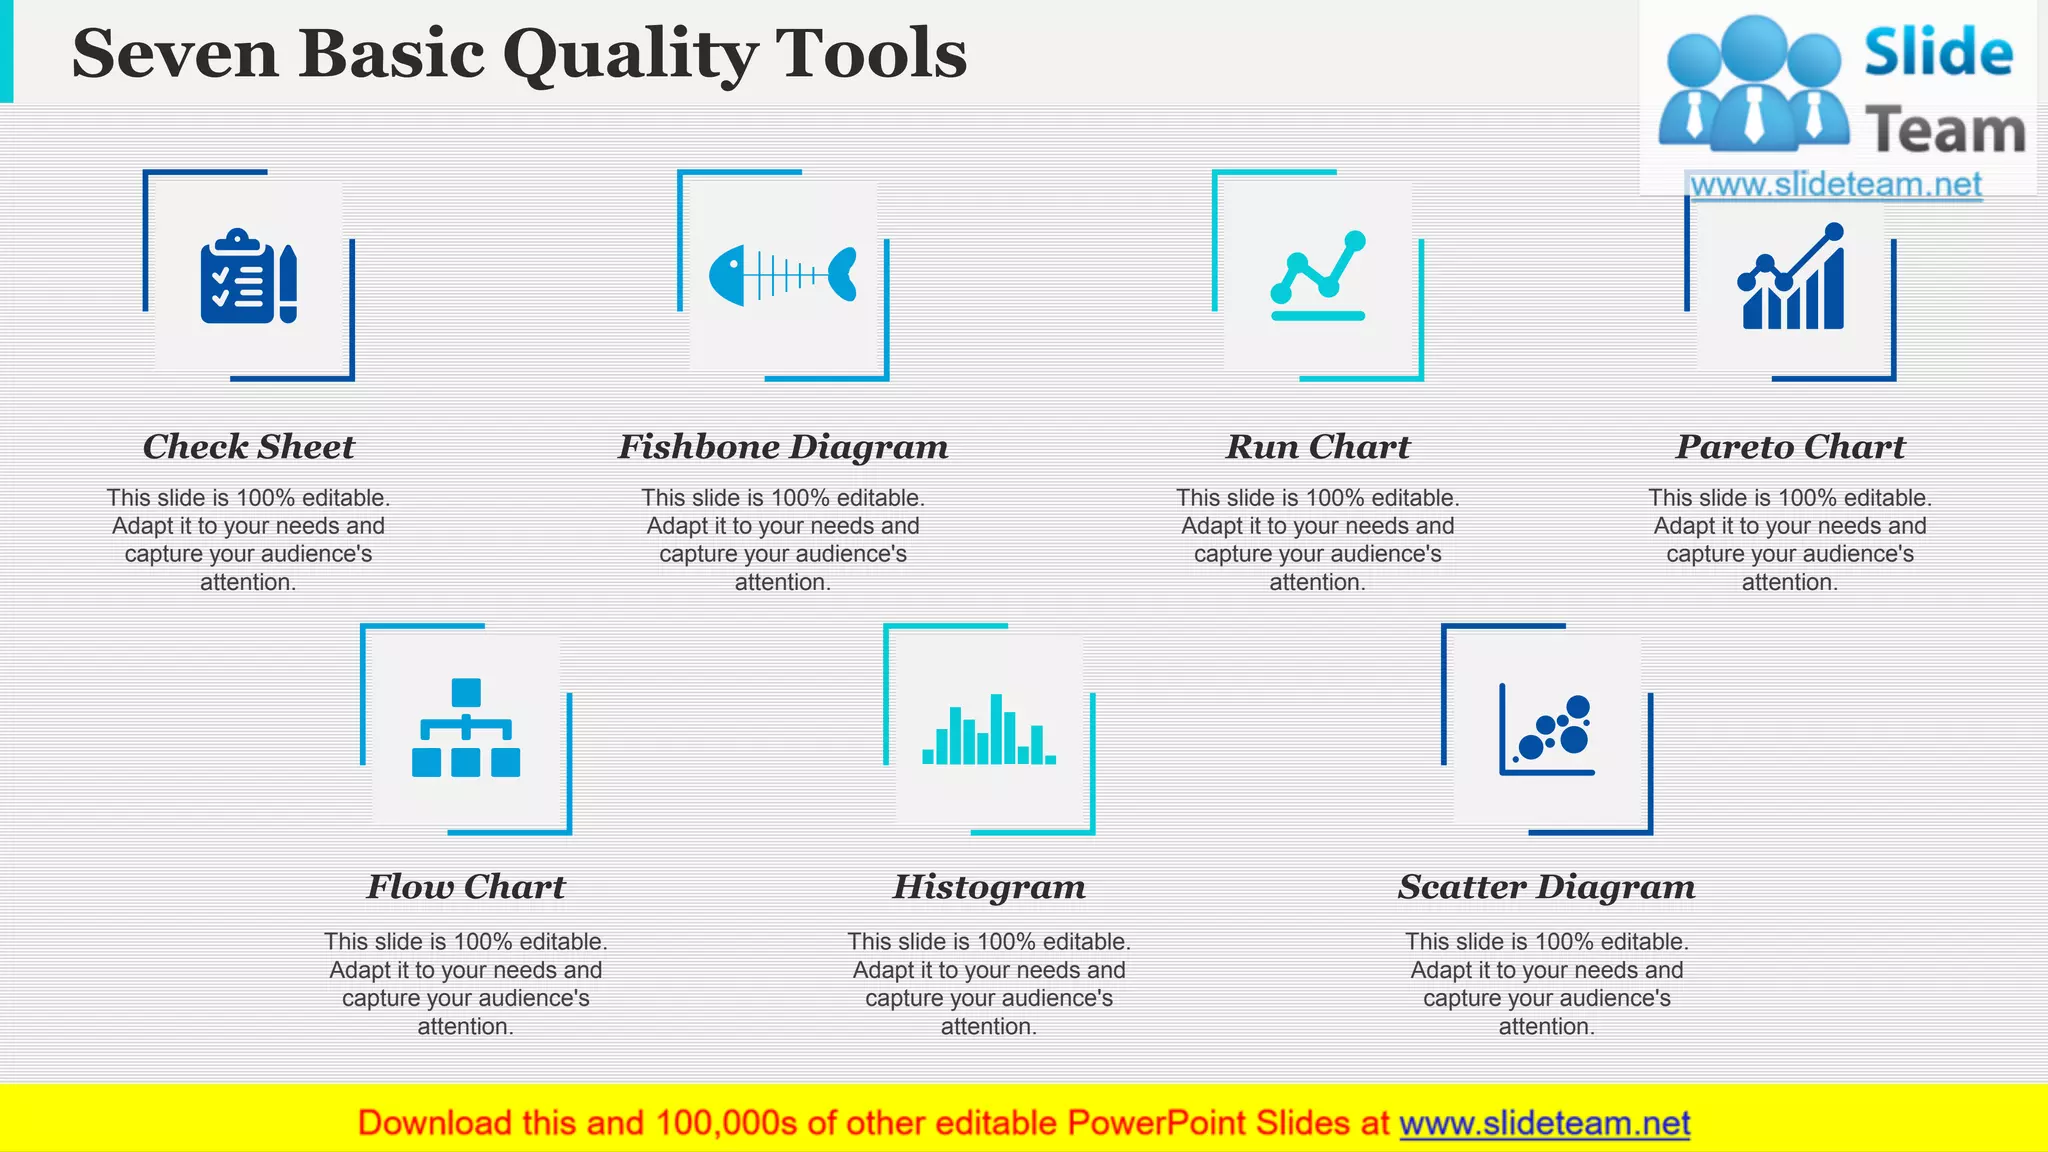
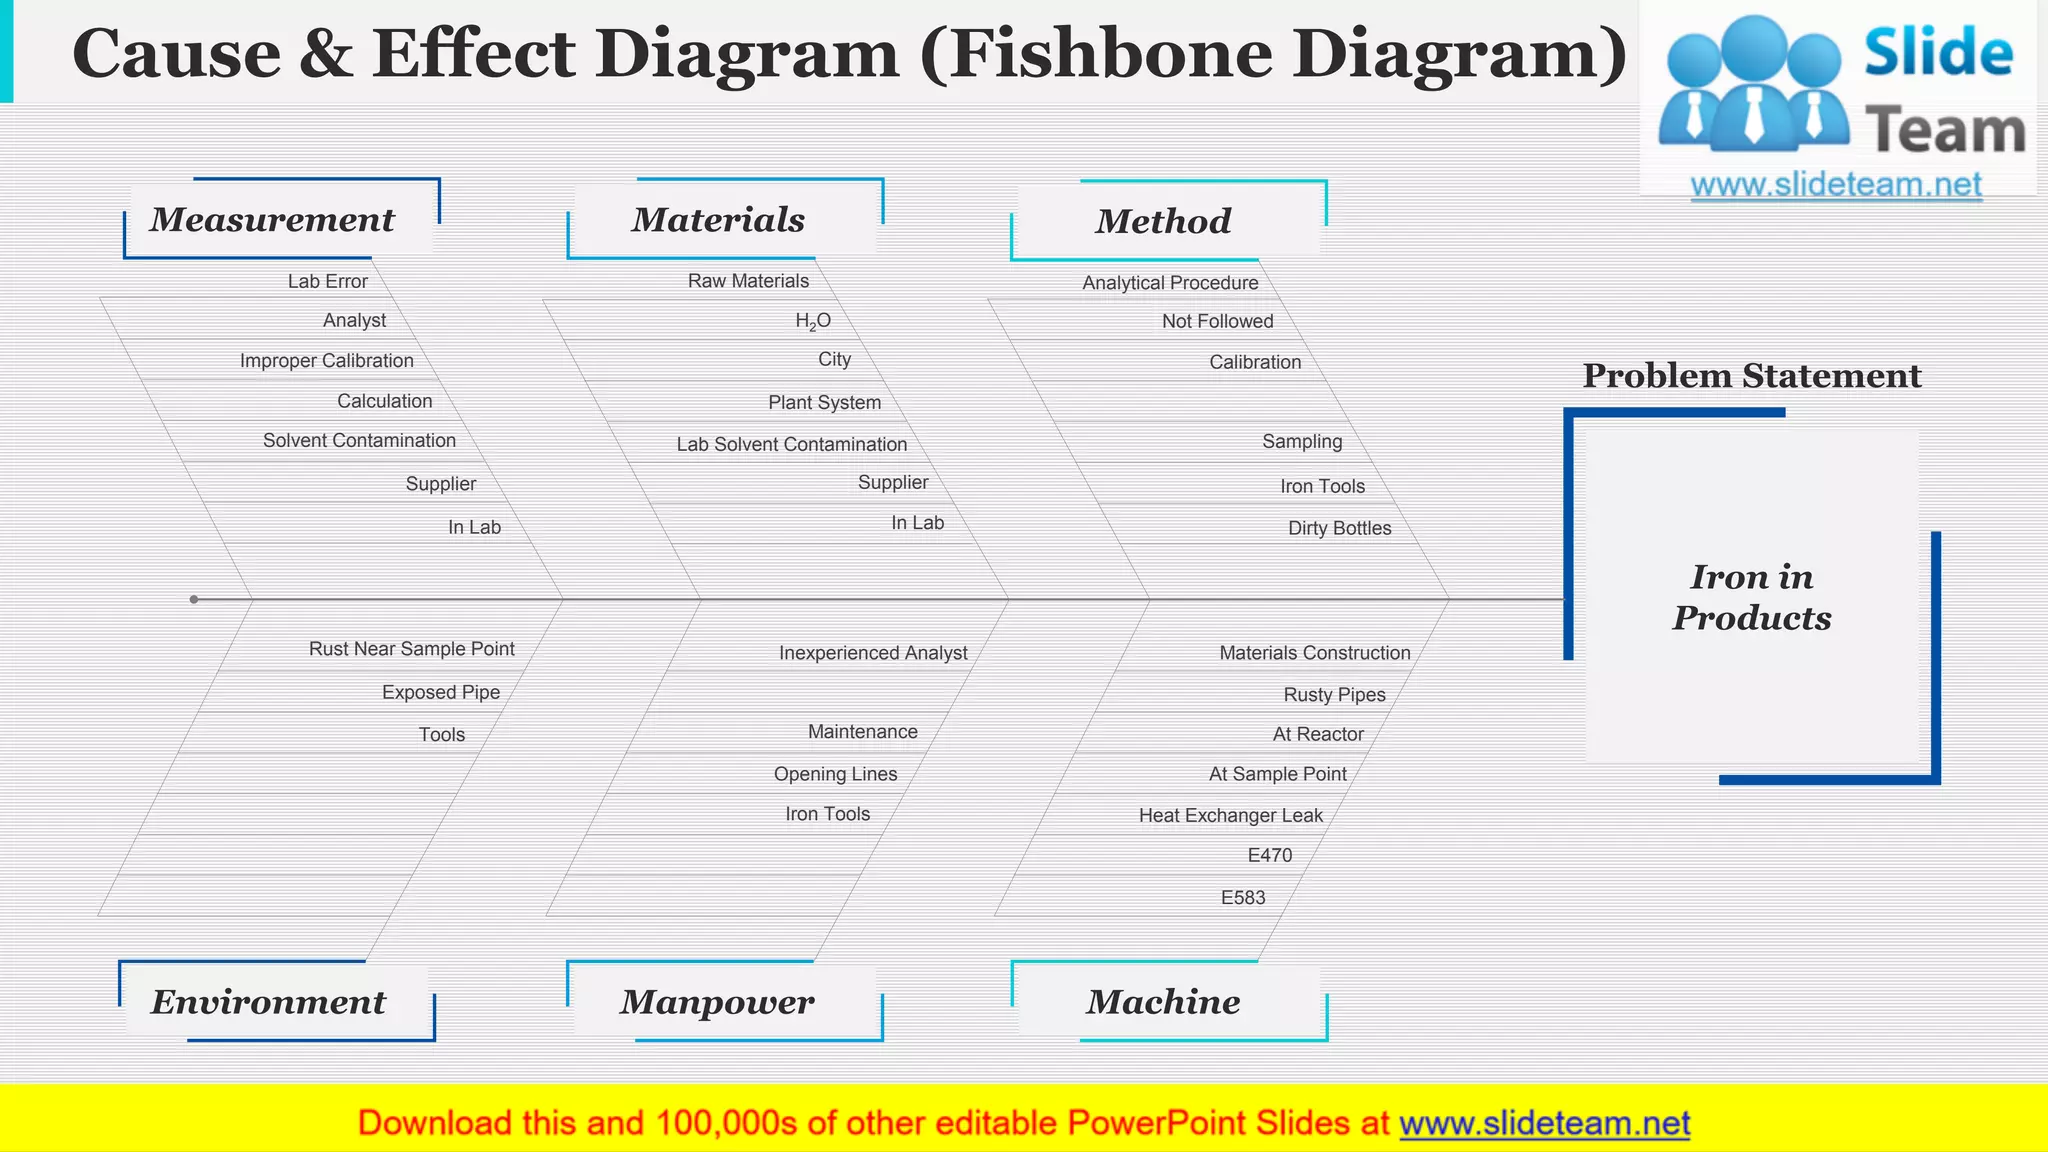
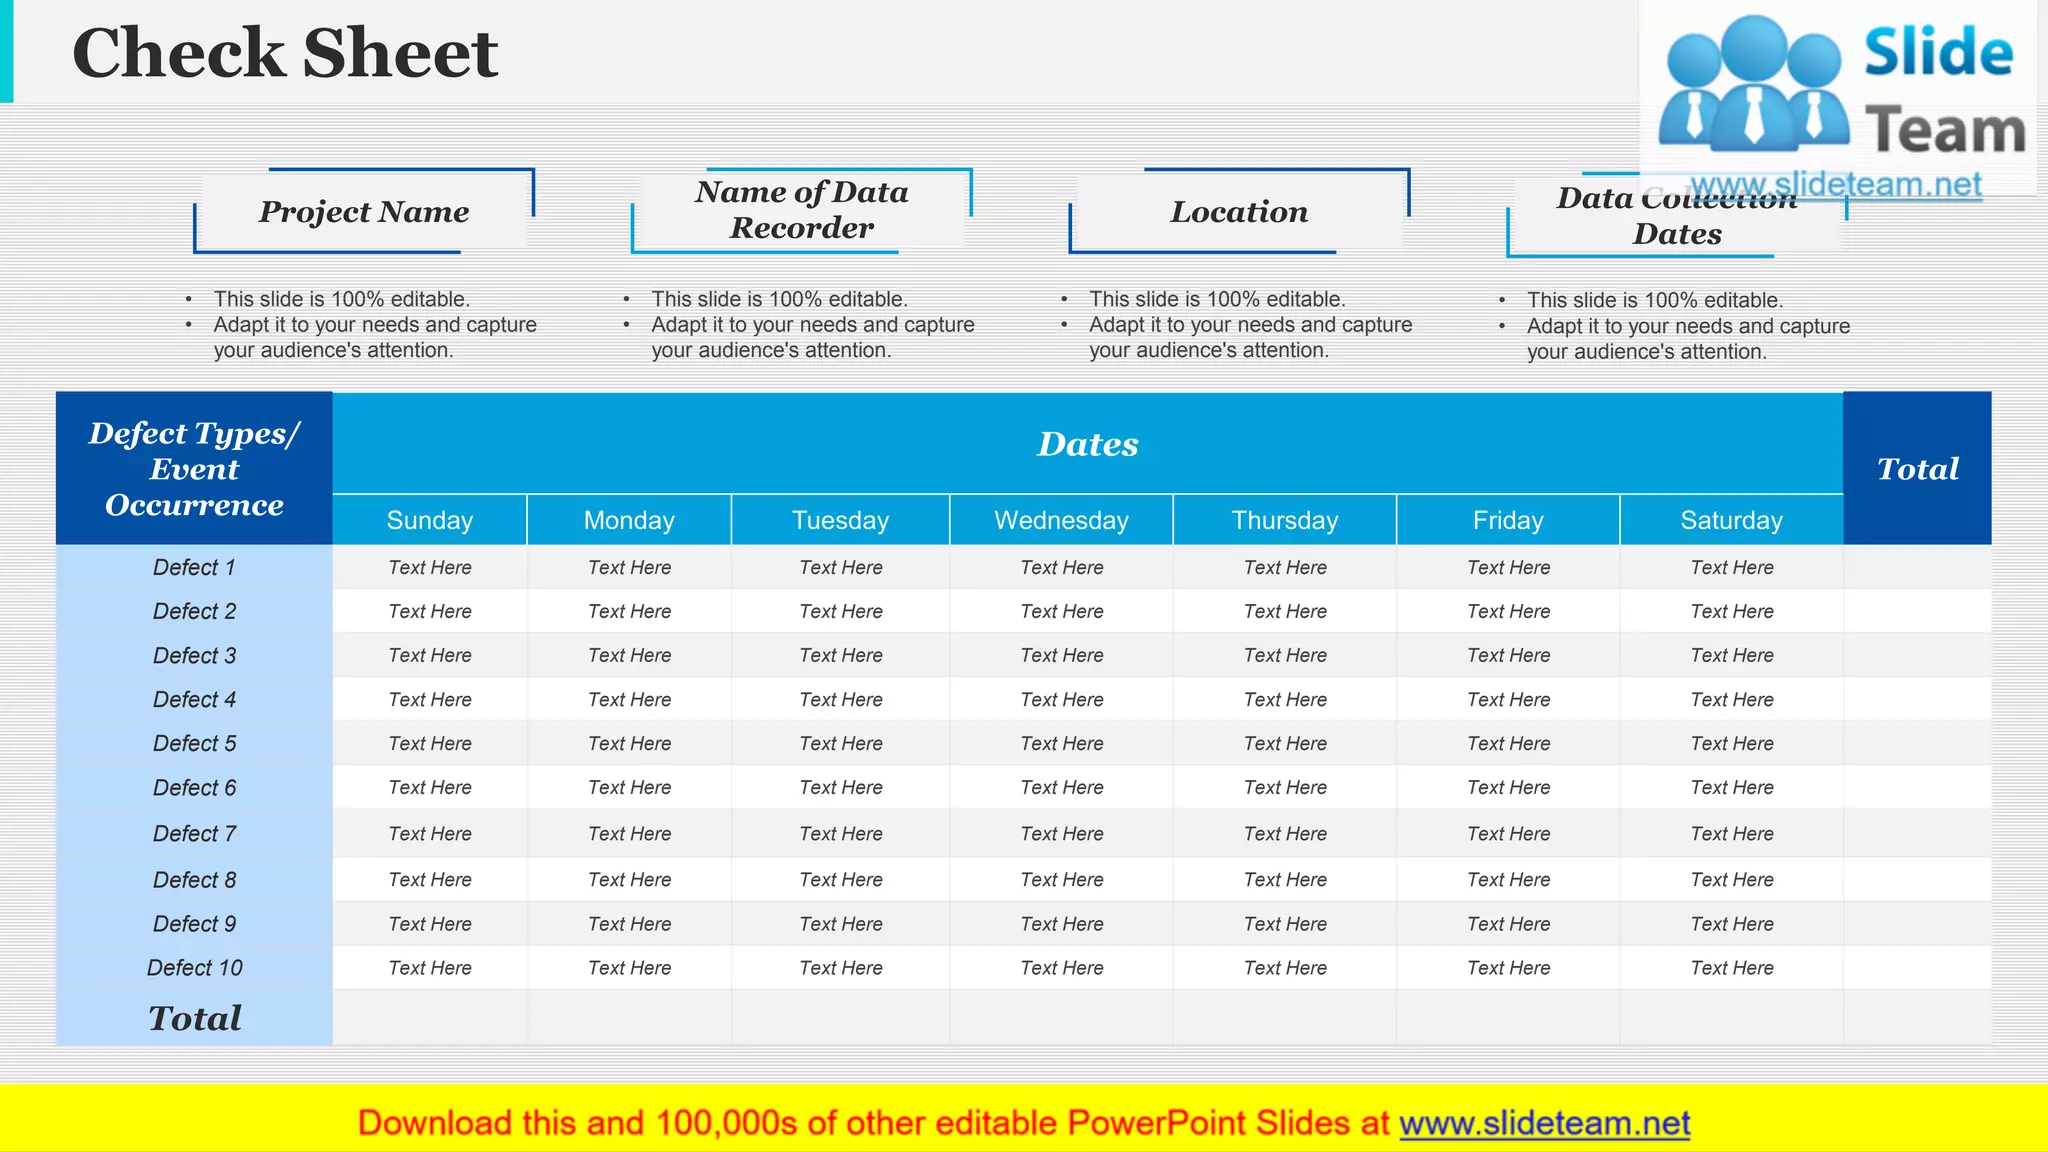
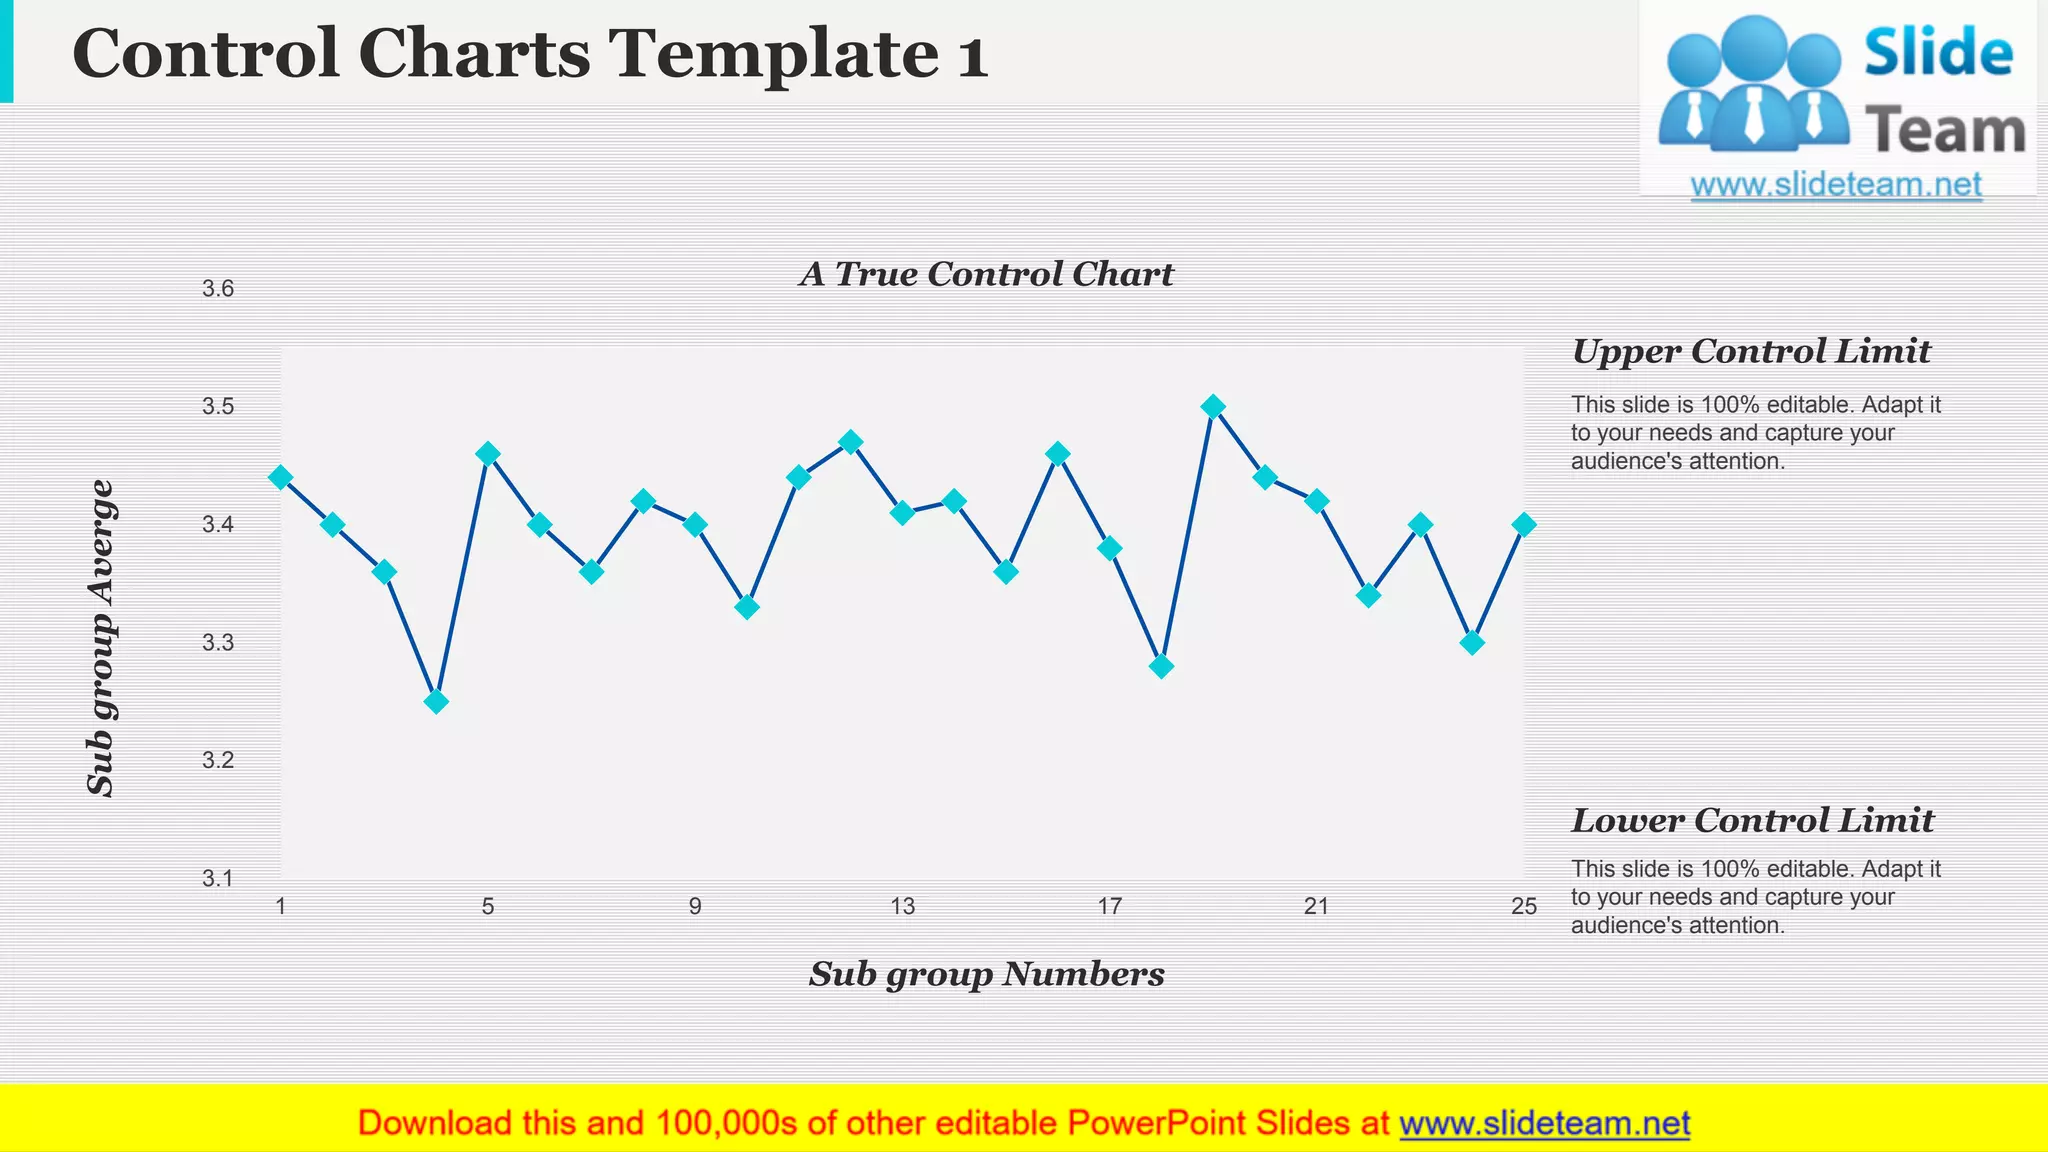
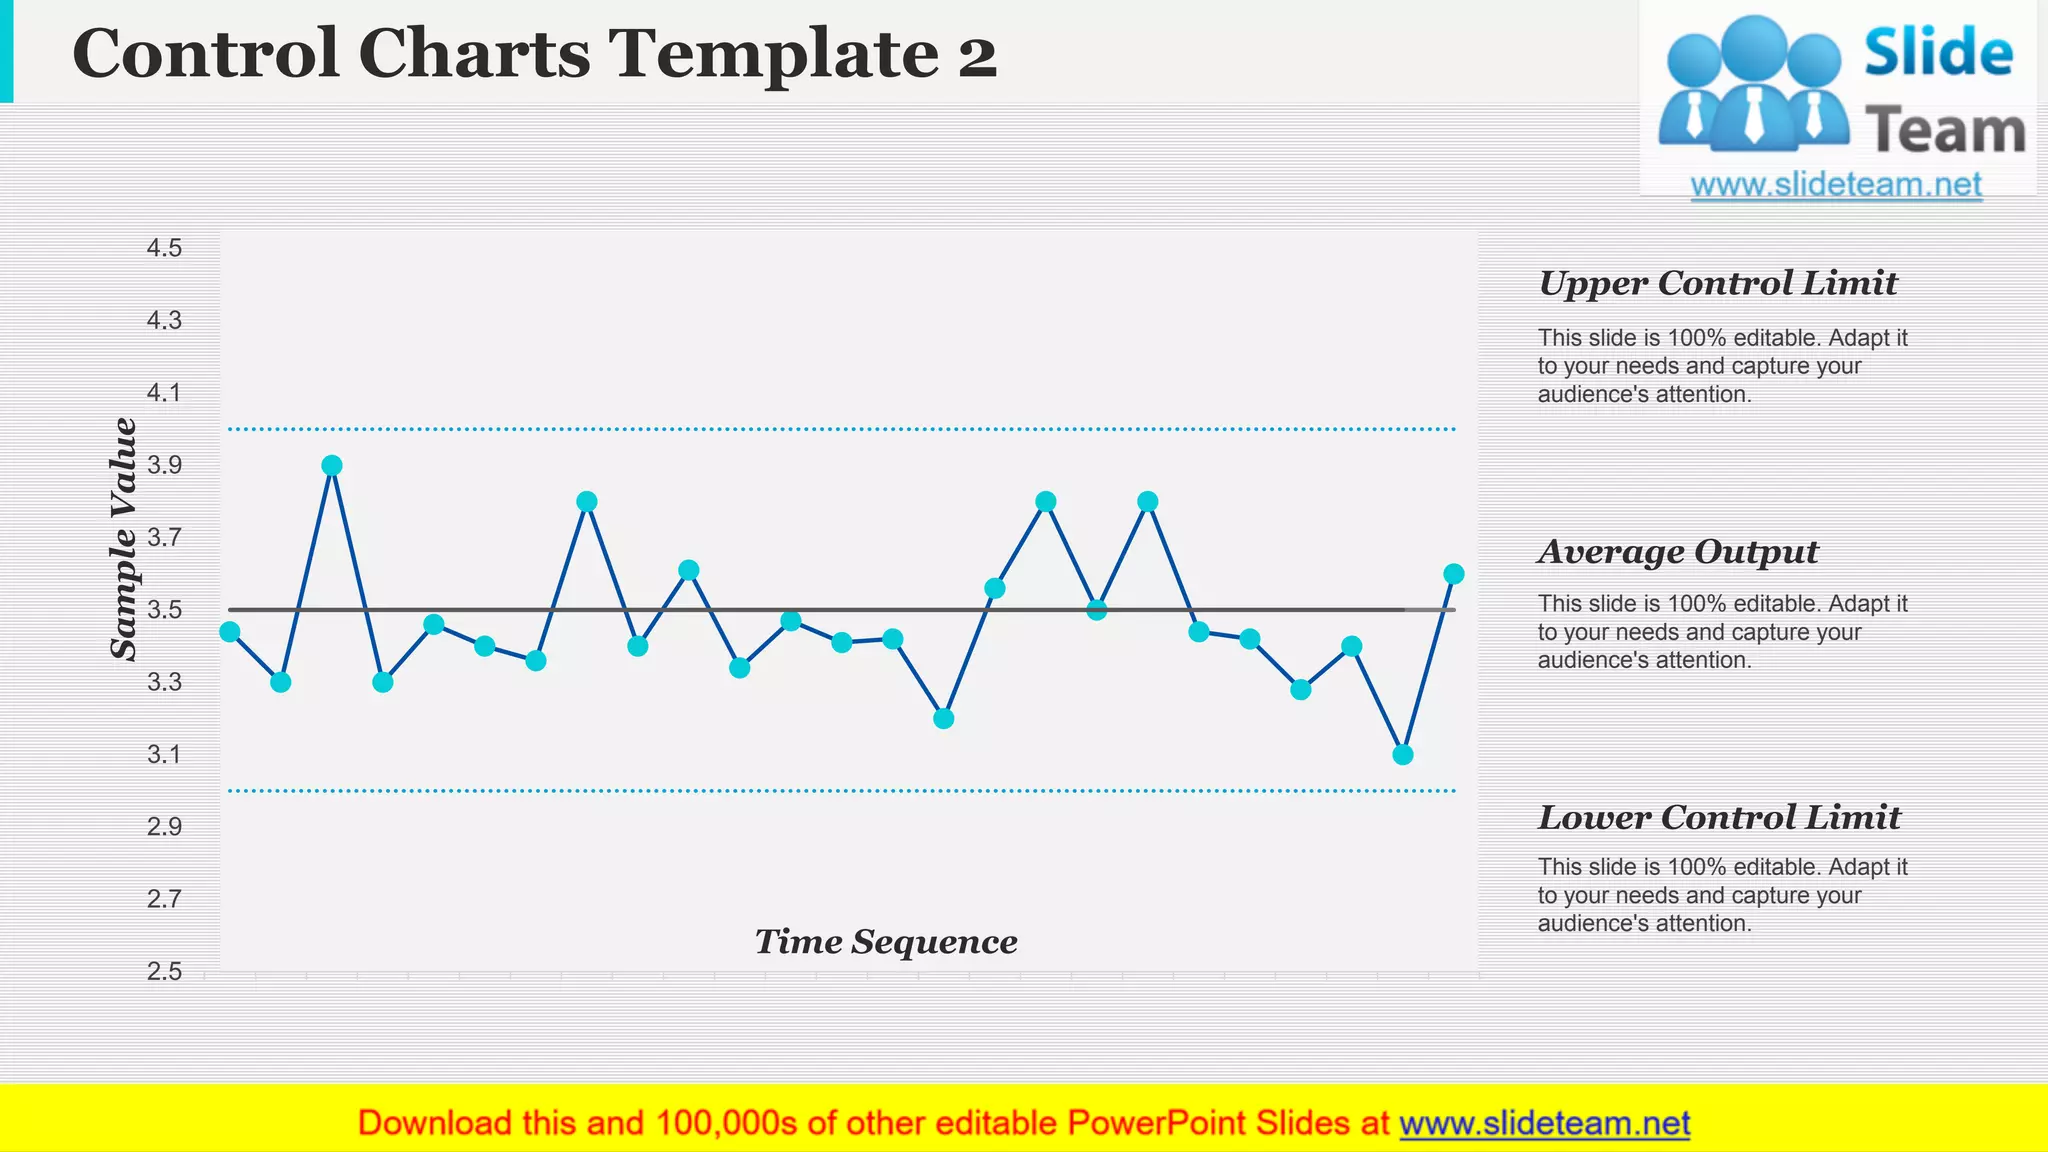
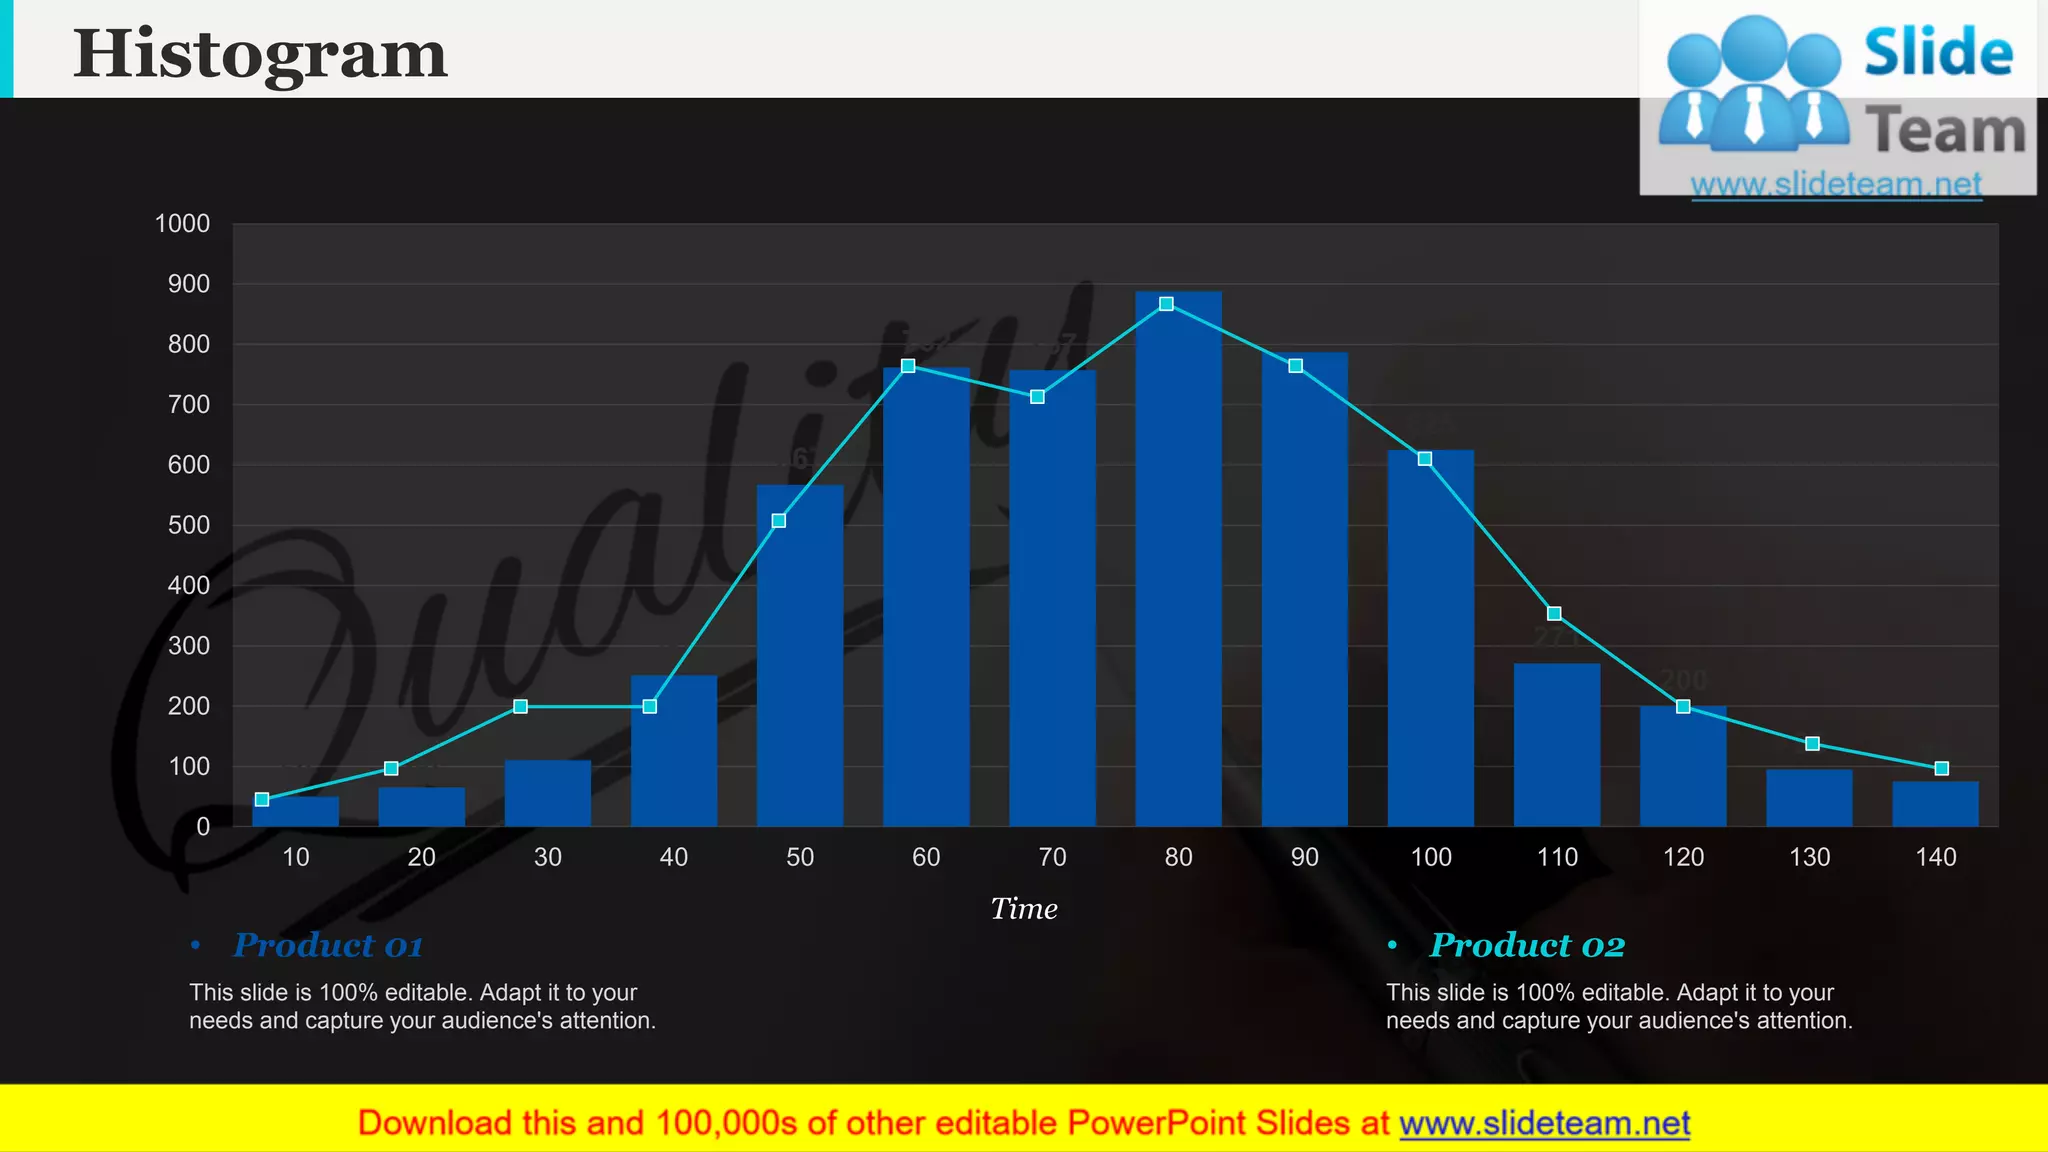
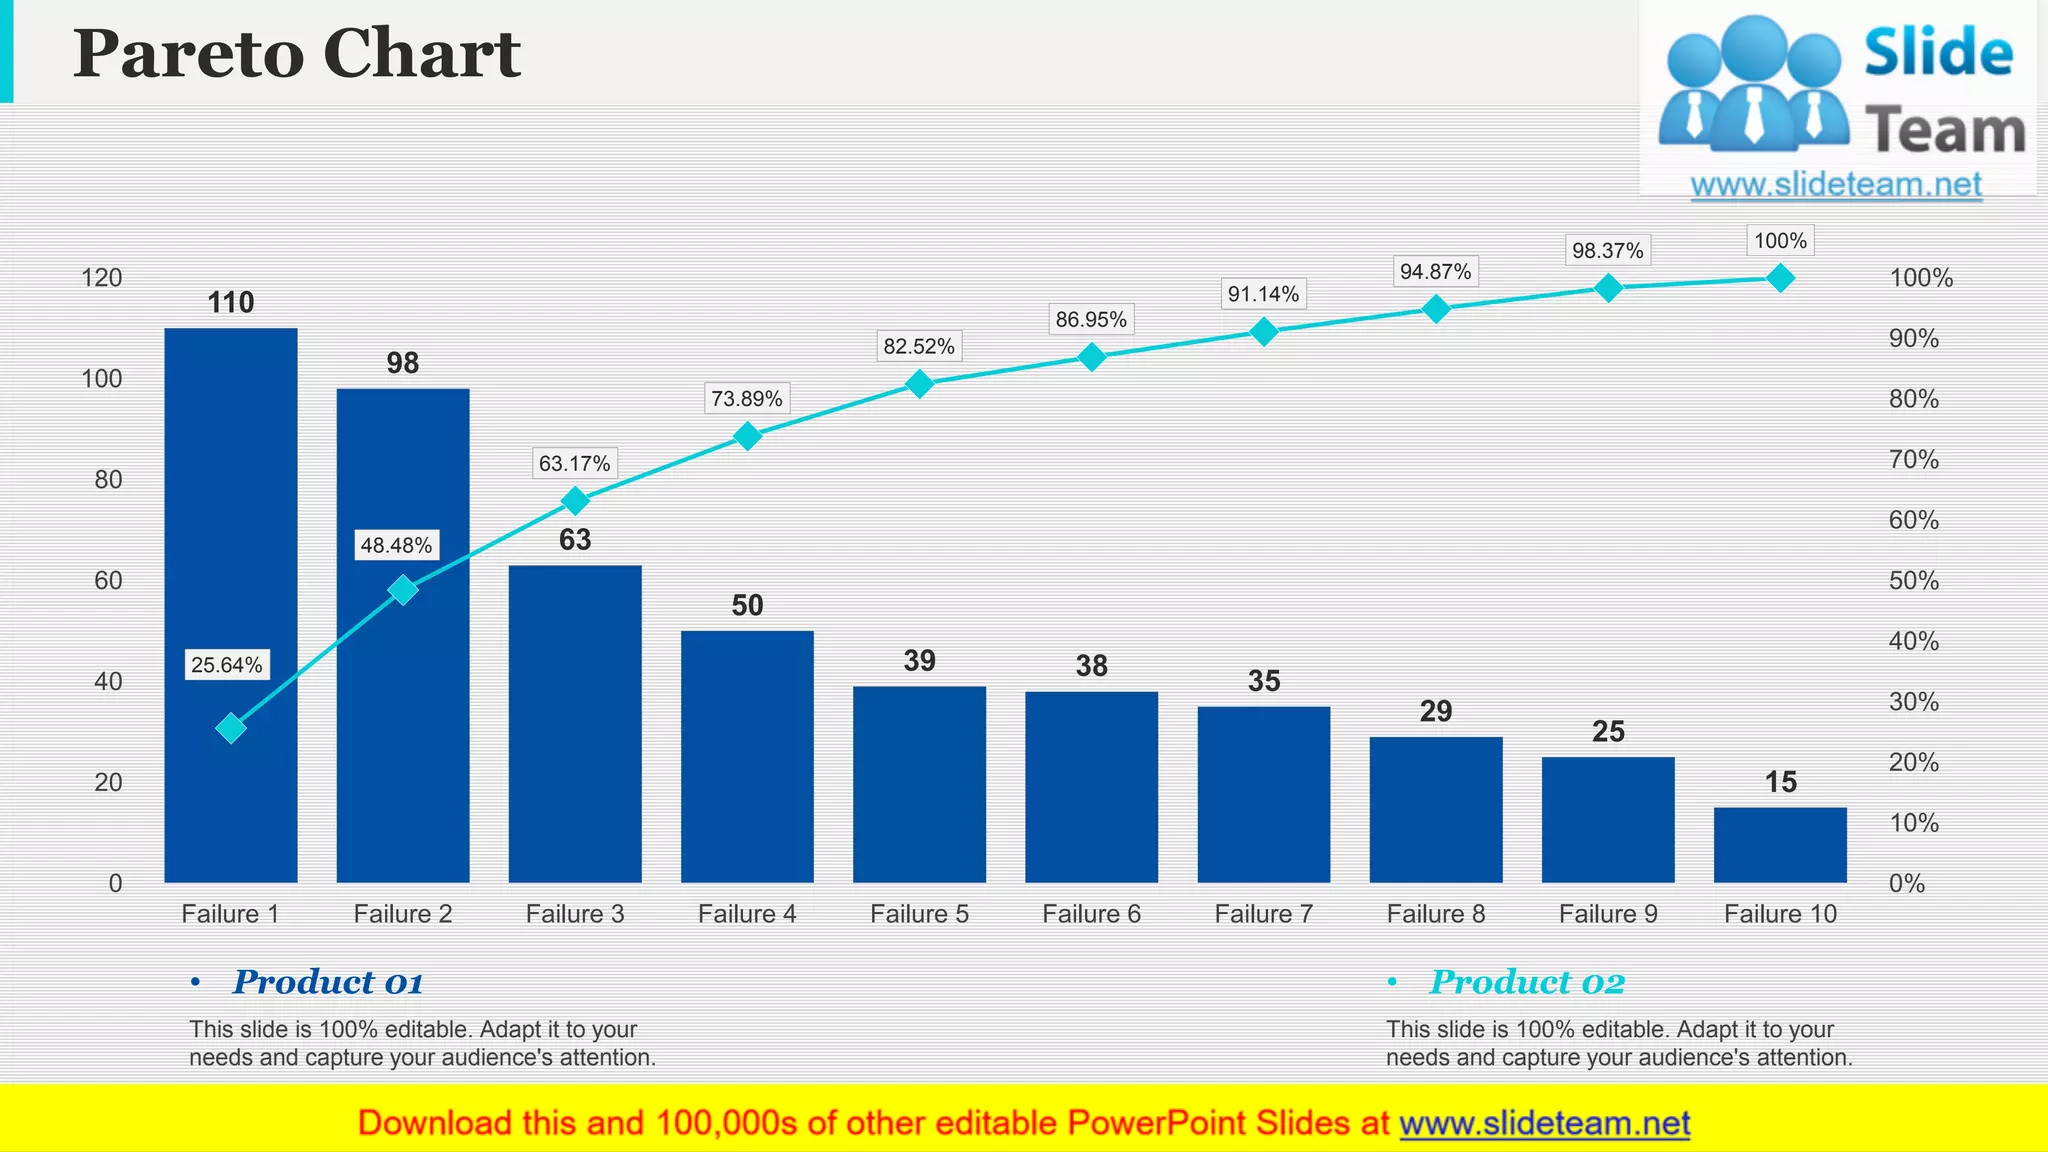
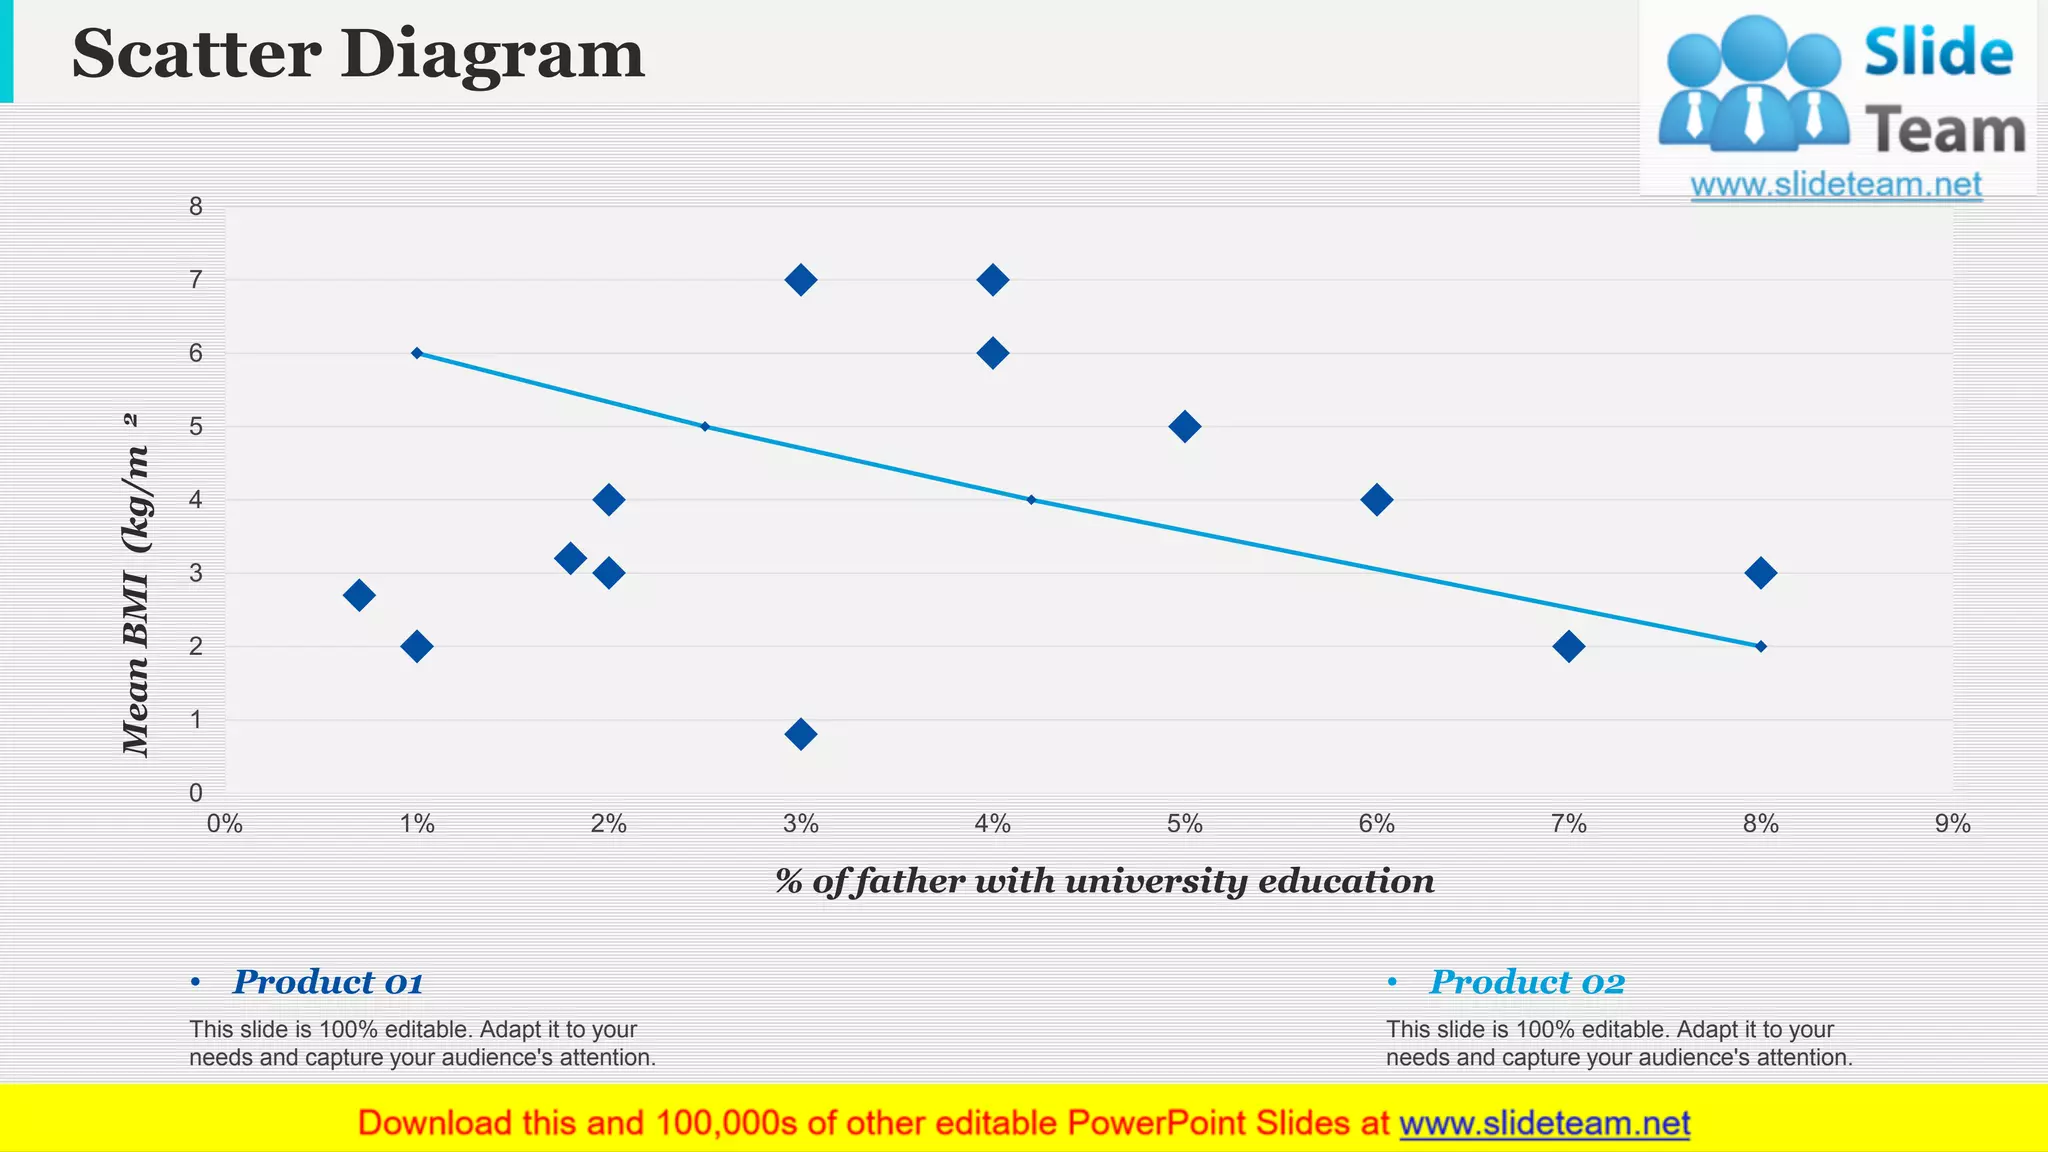
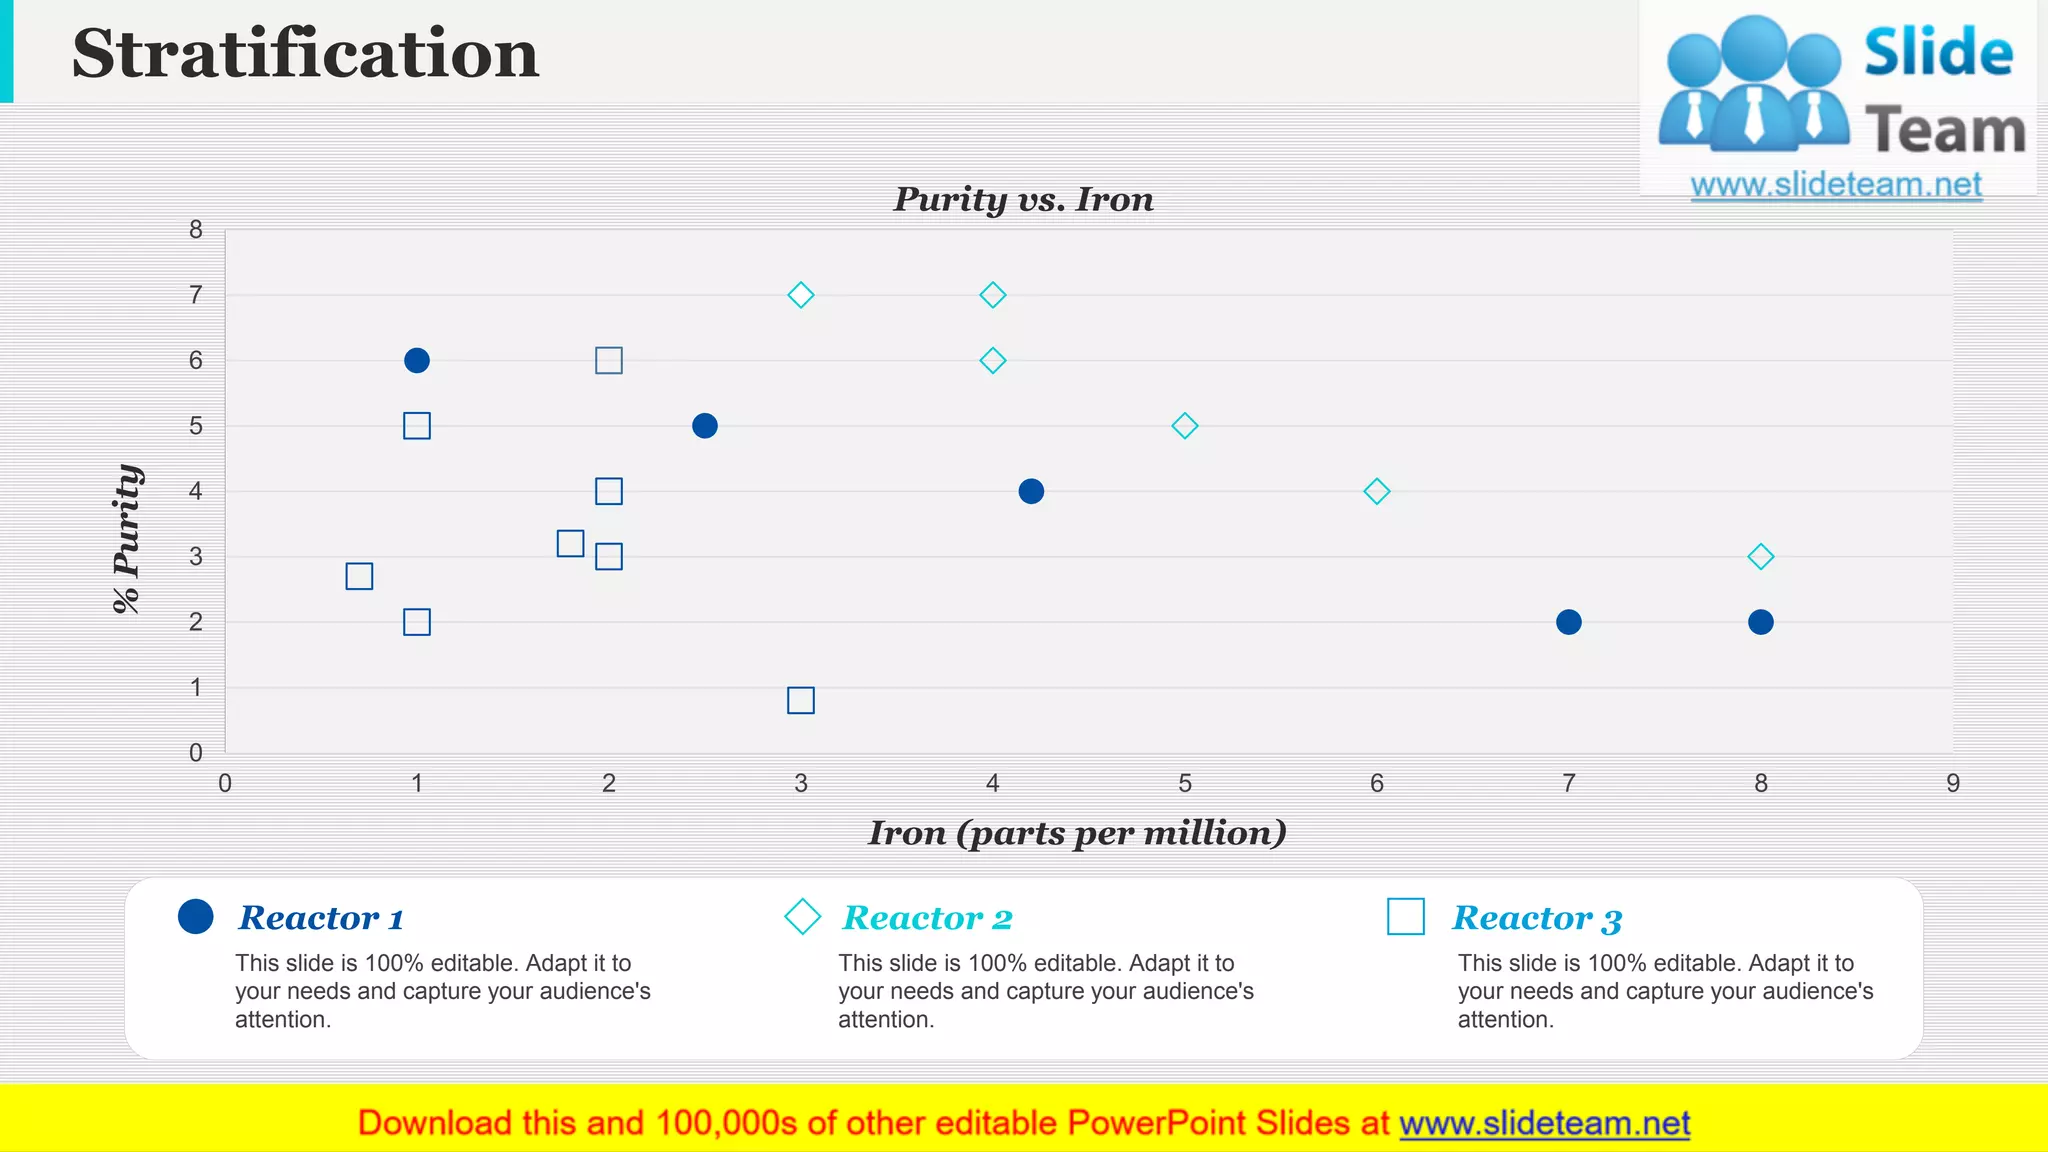

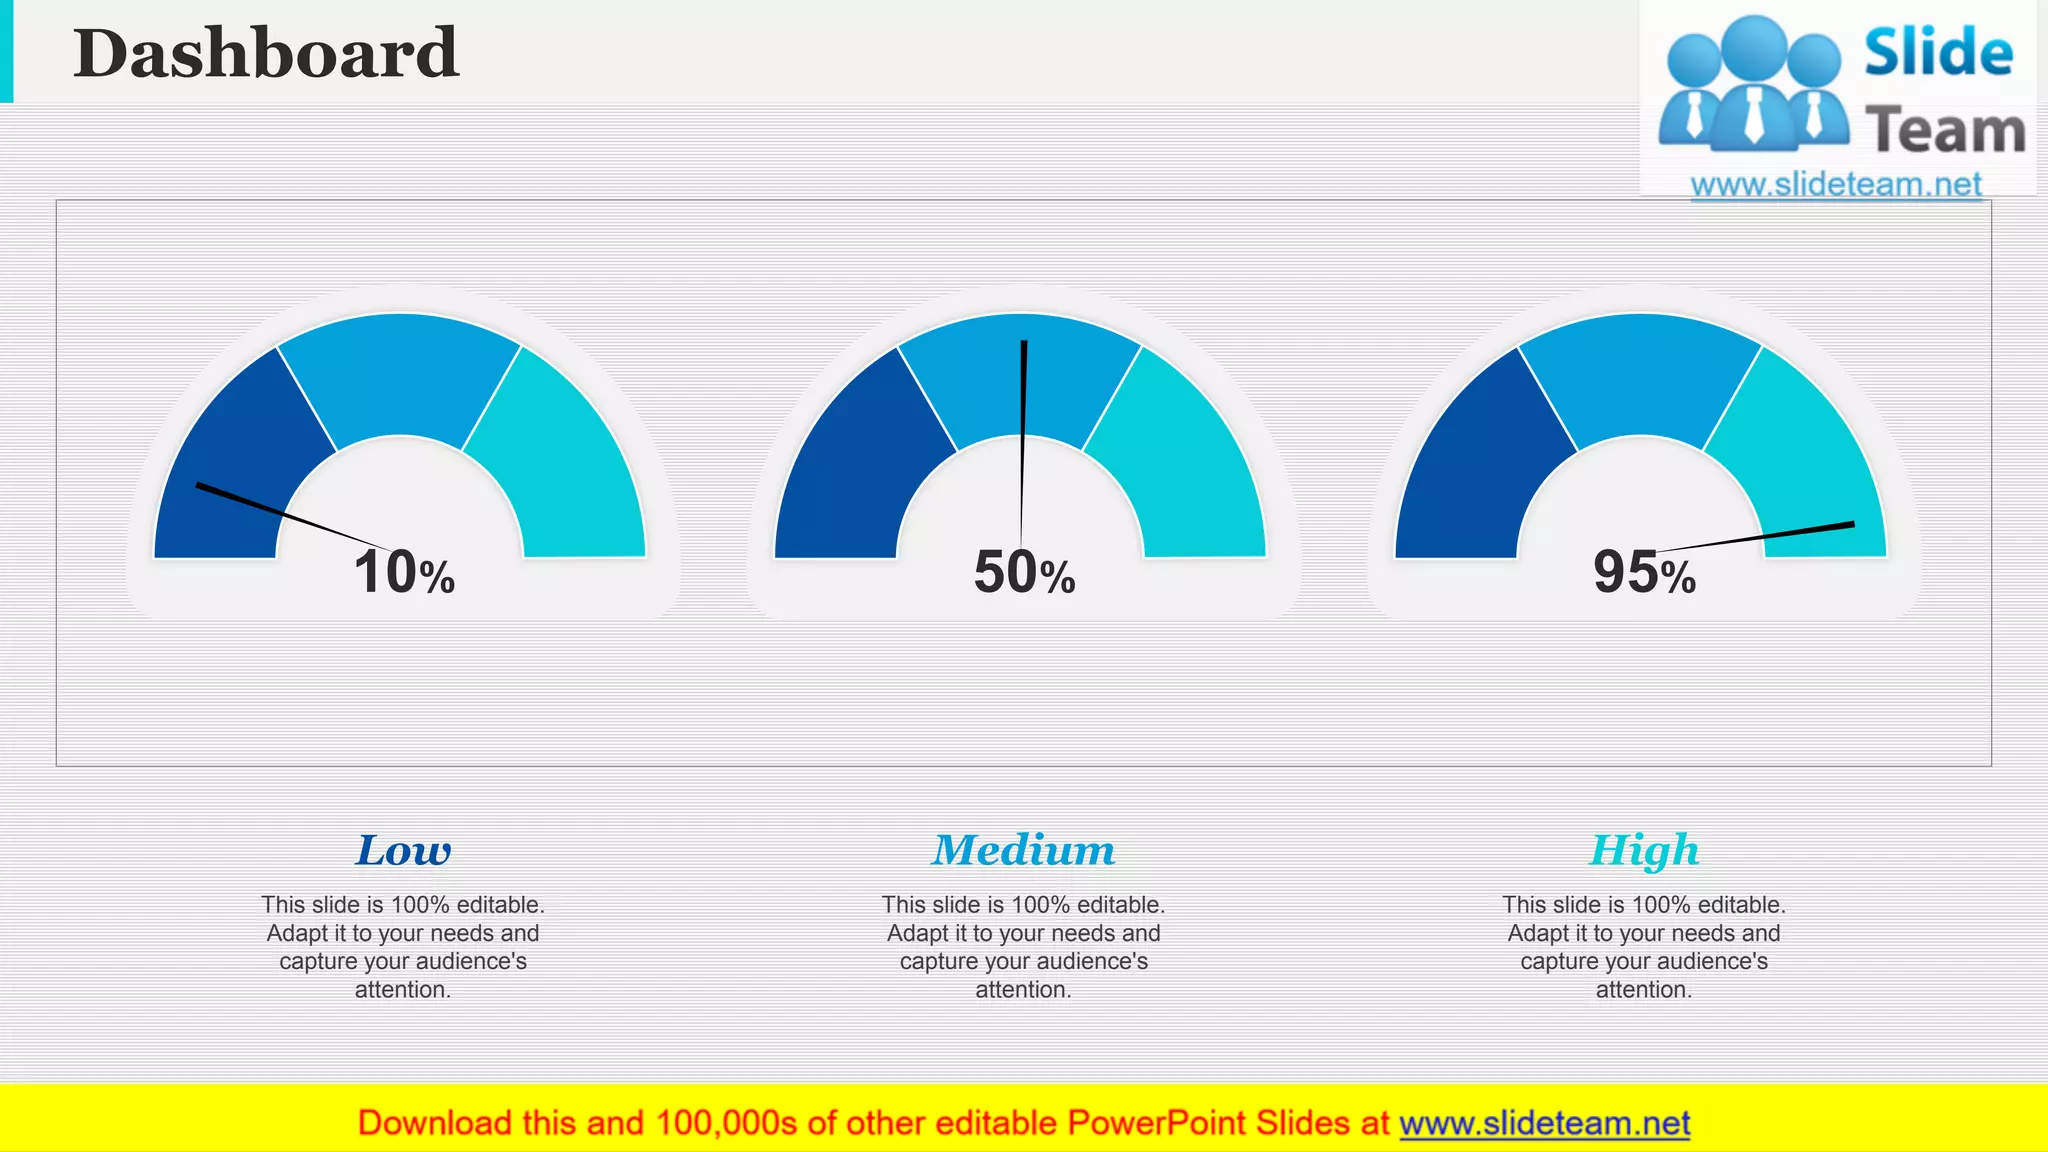
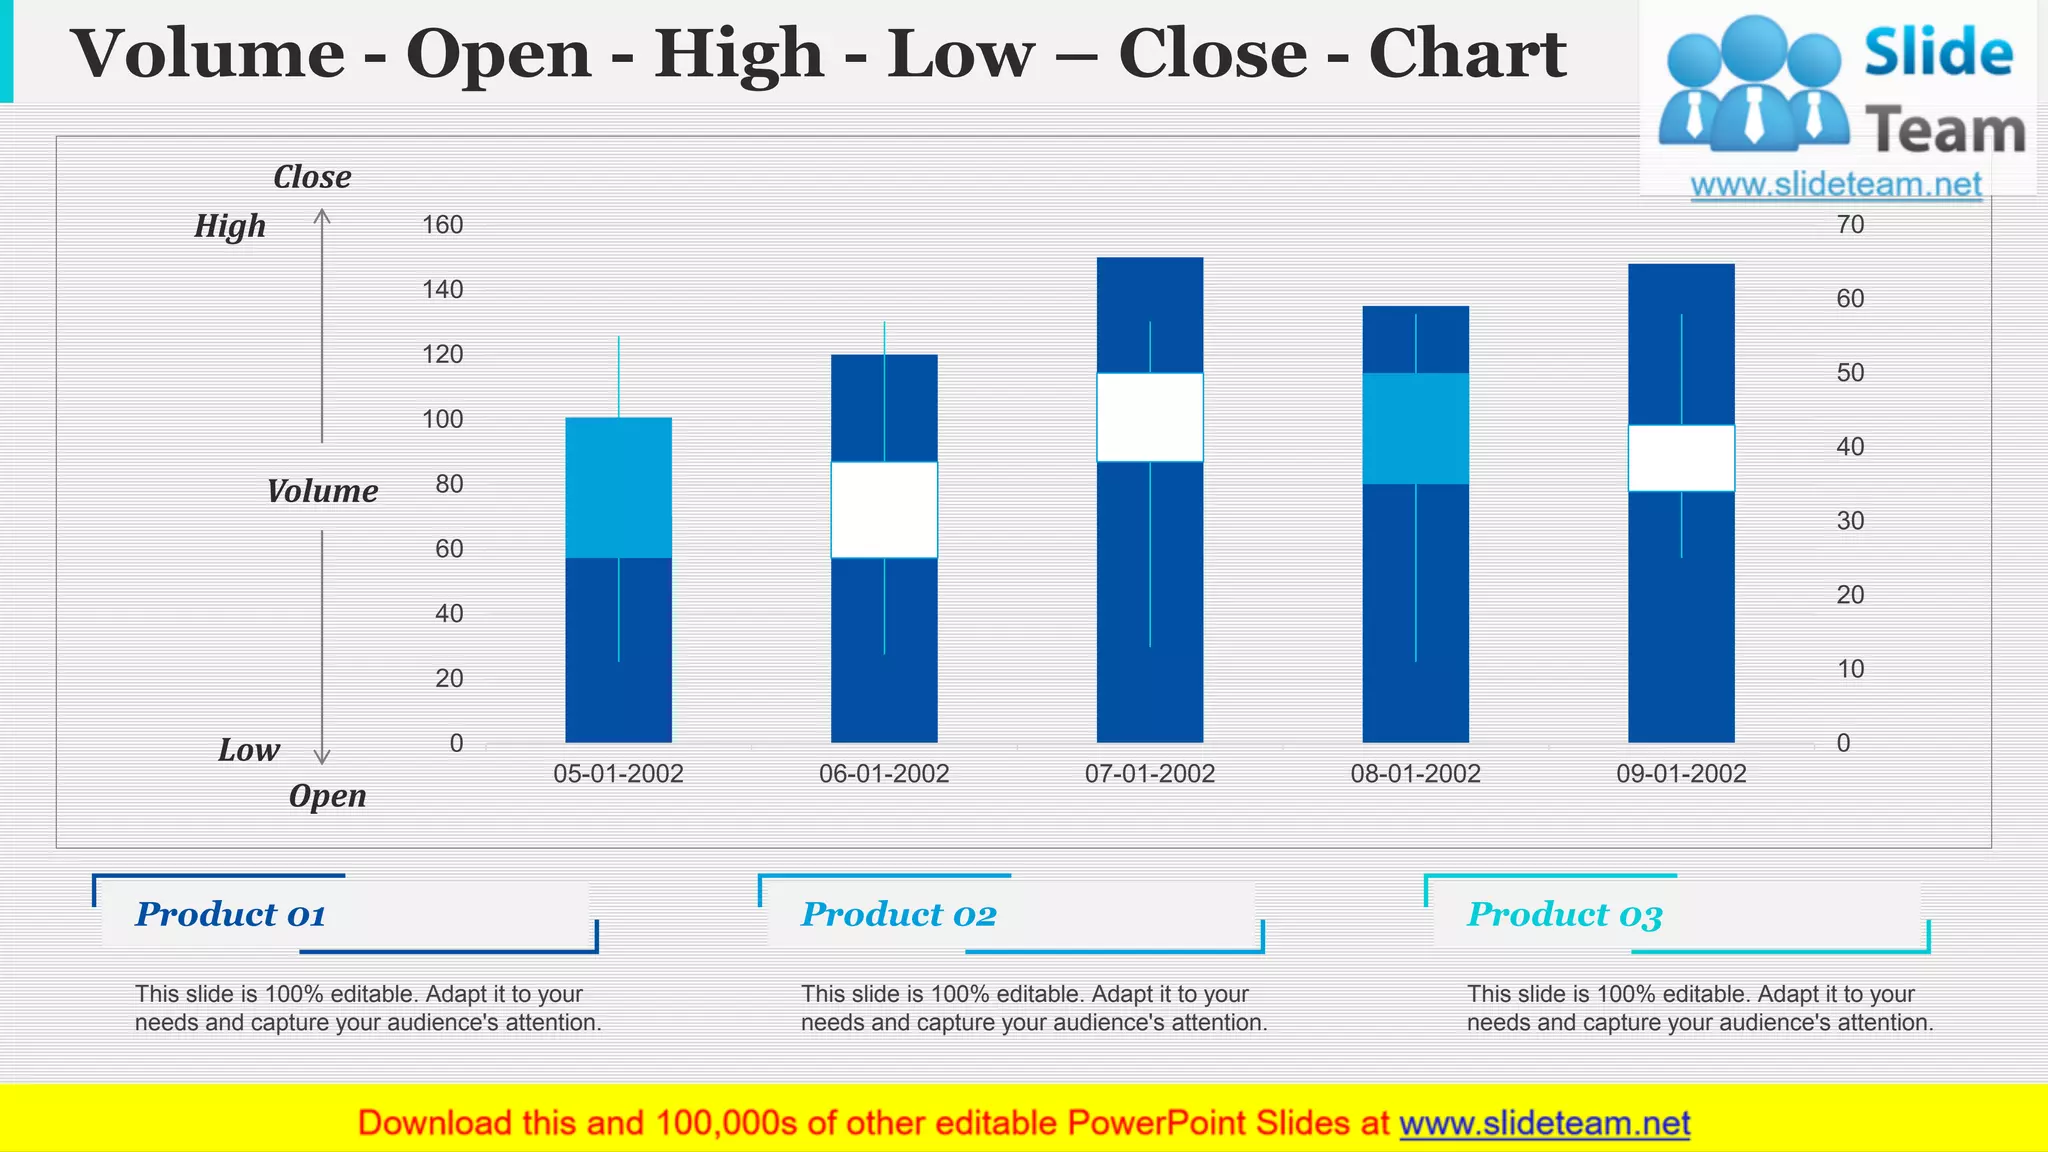
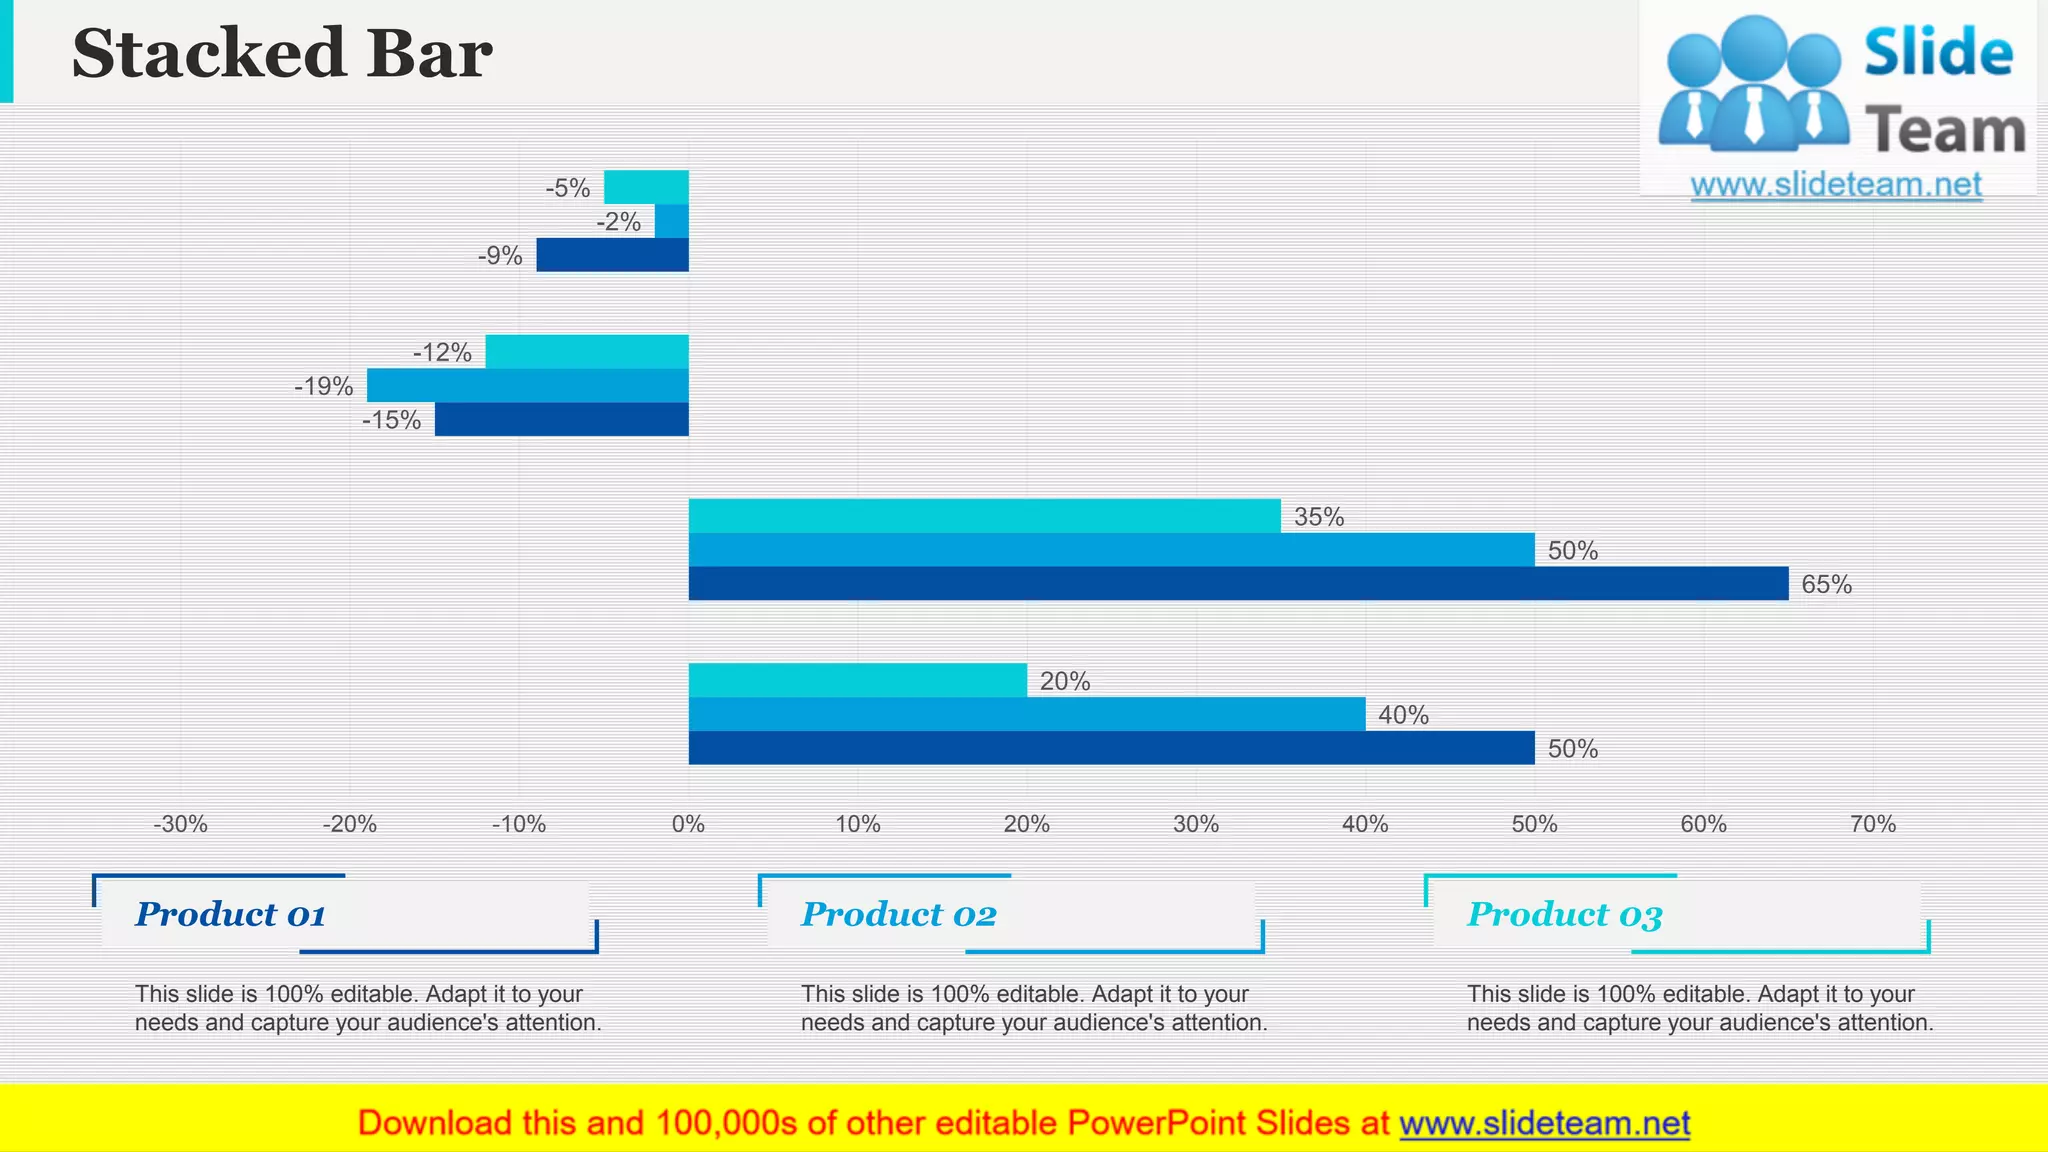
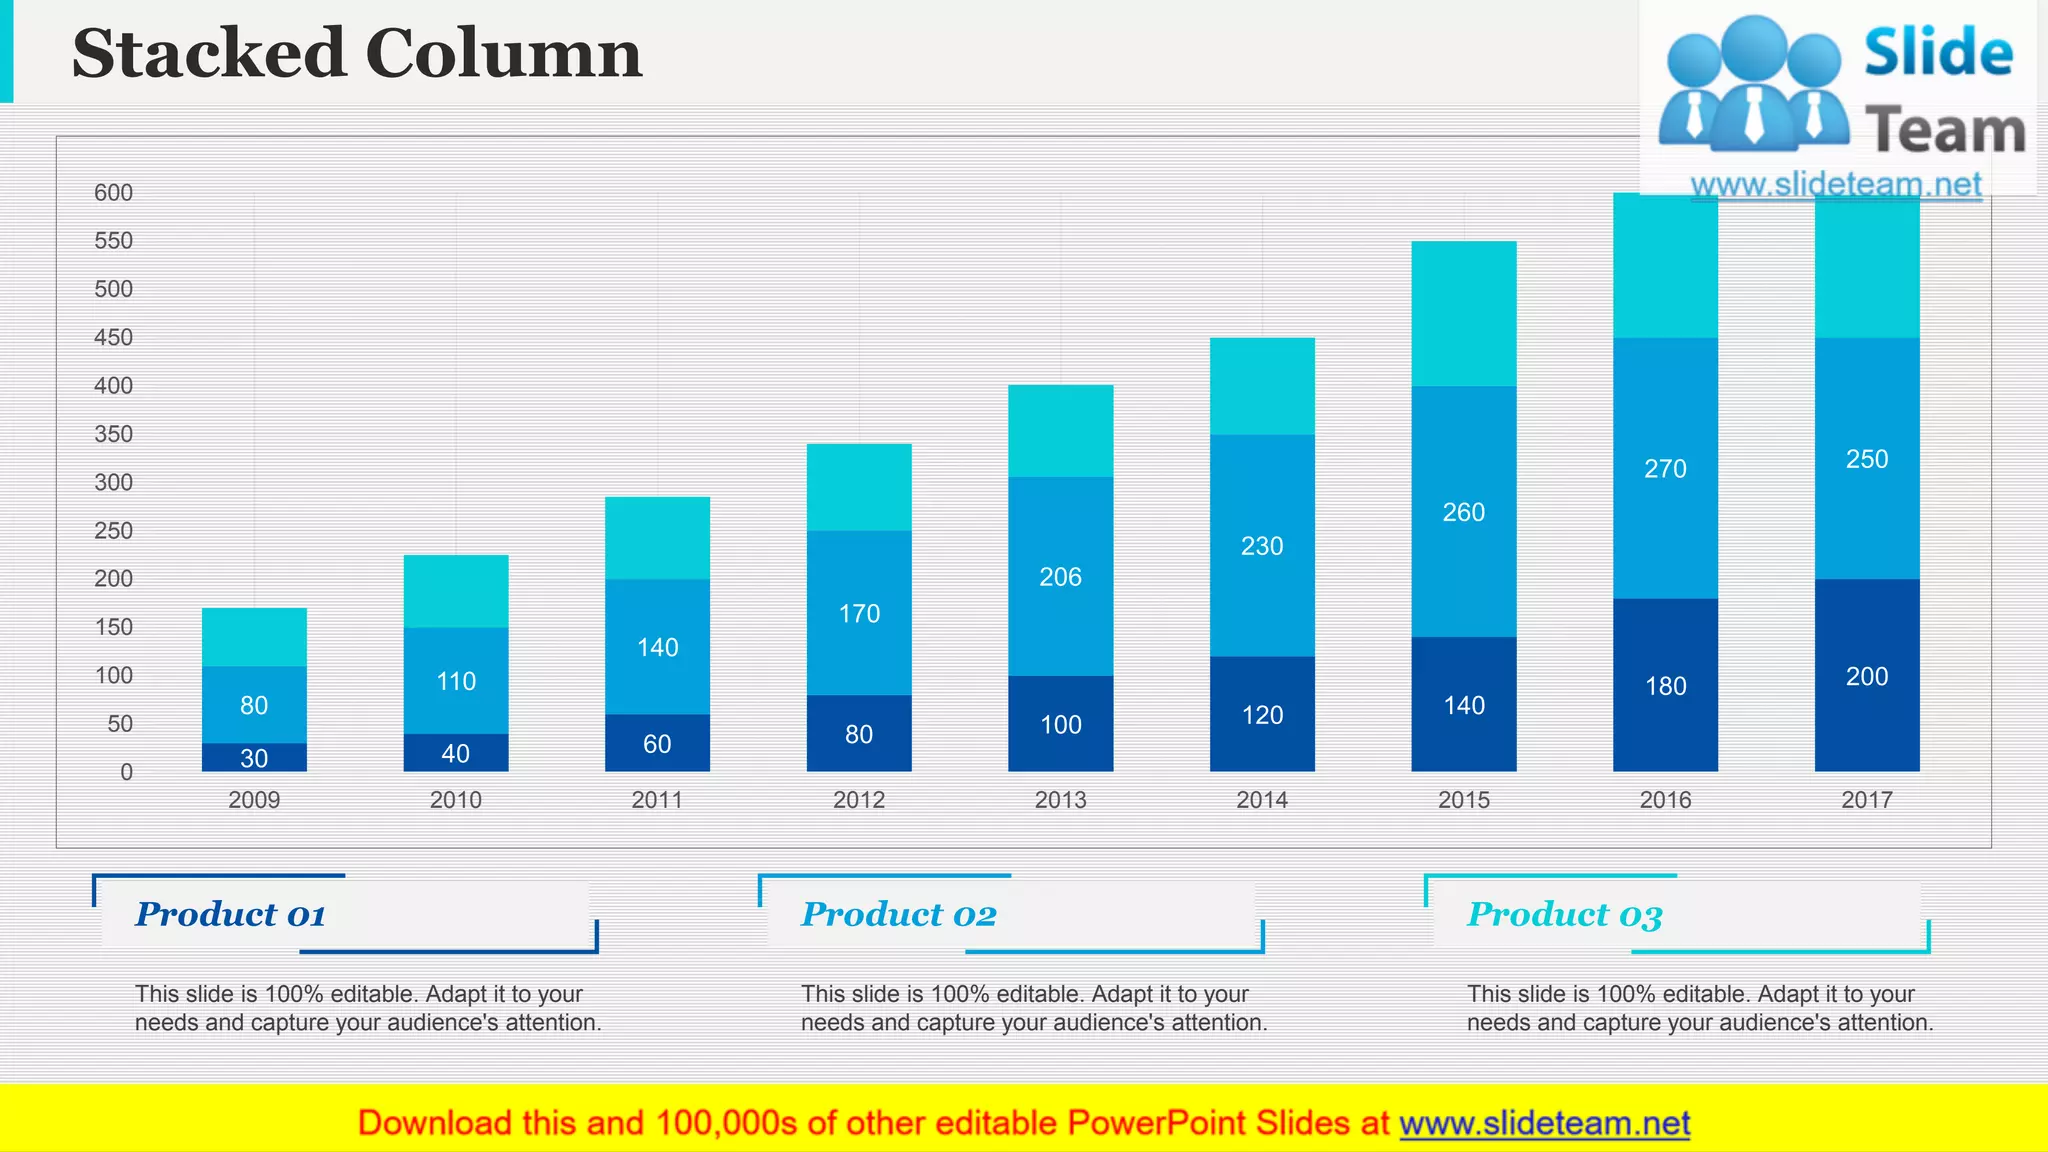
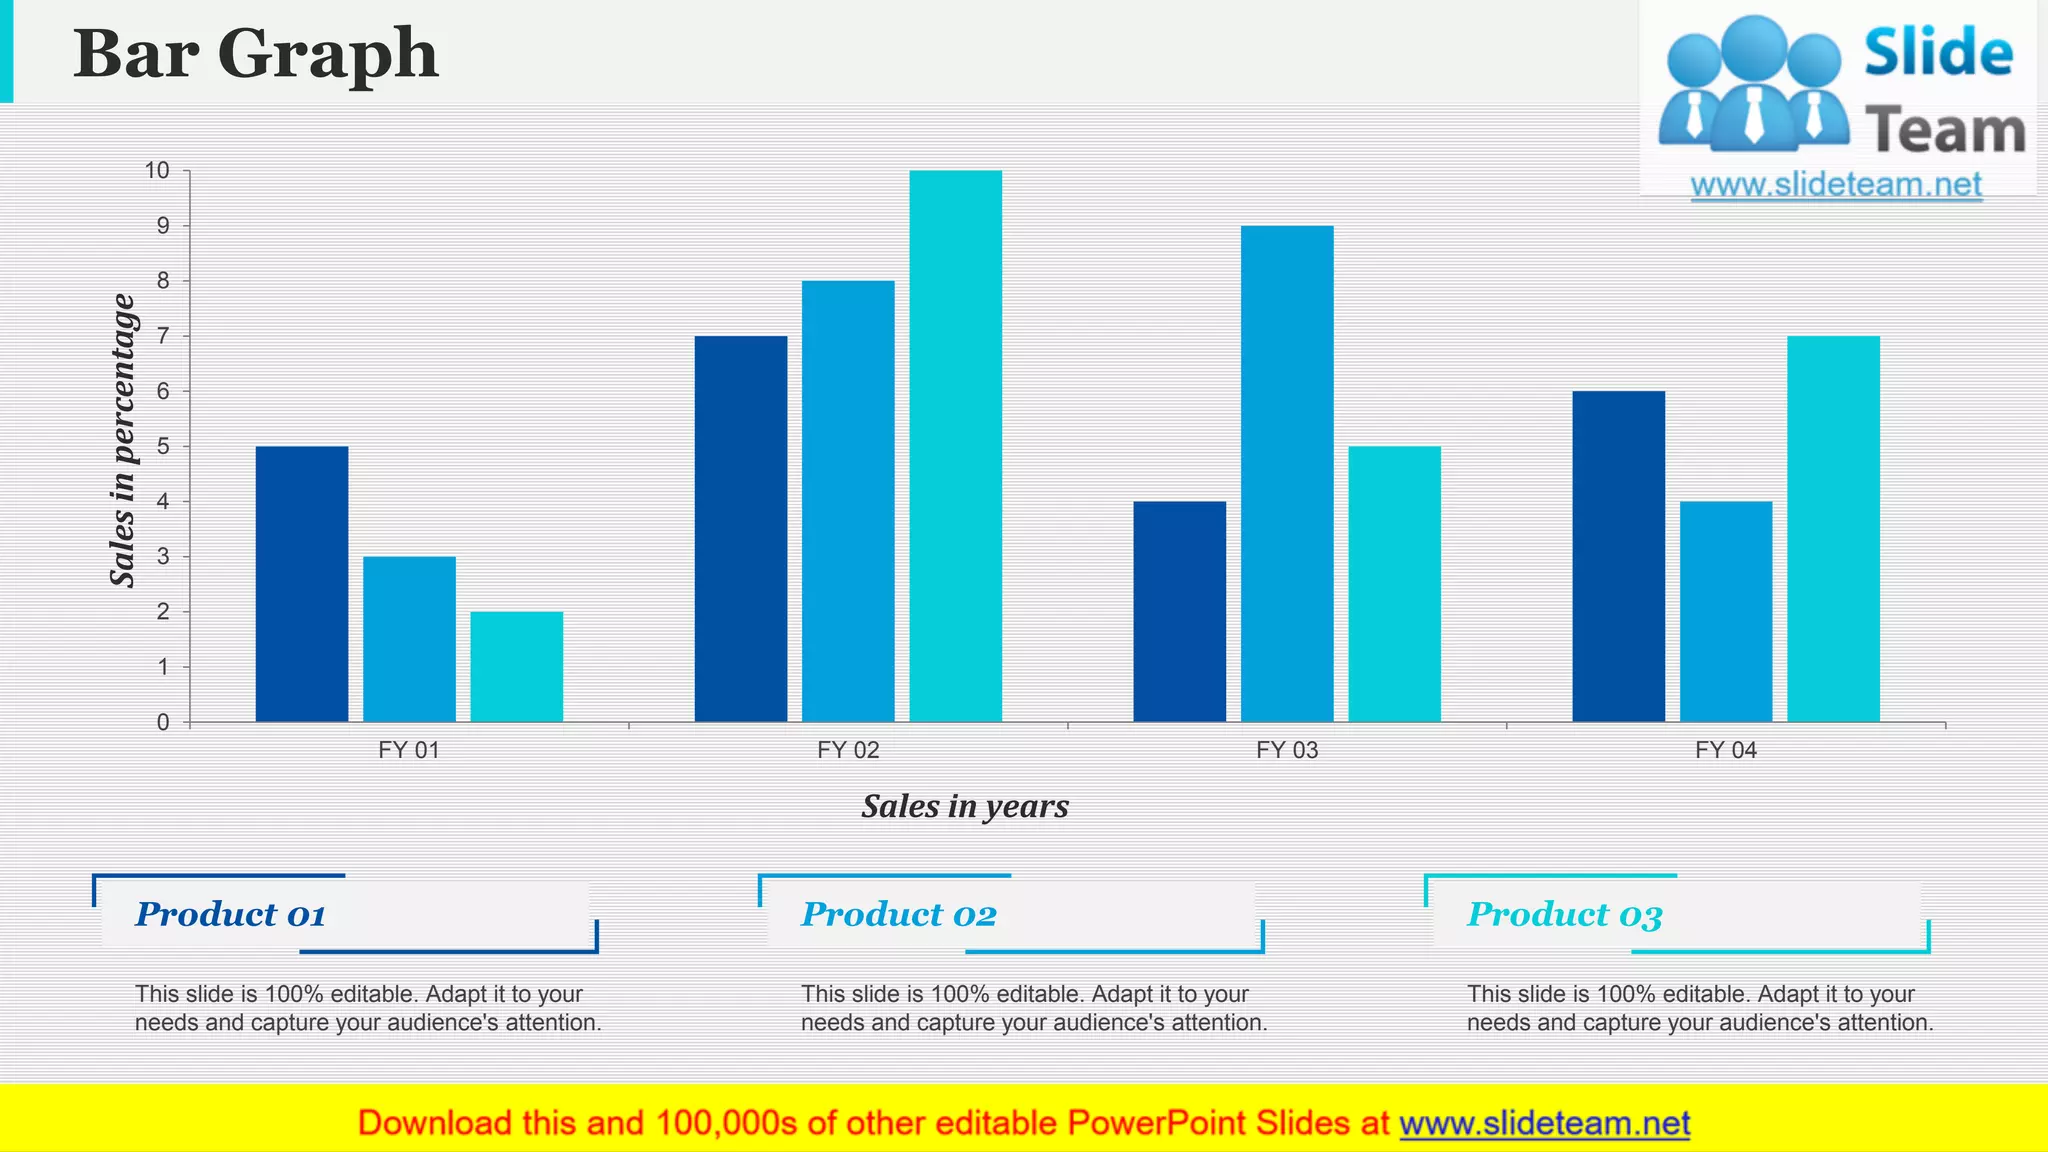


The document outlines the seven basic quality control tools, including control charts, scatter diagrams, cause and effect diagrams, histograms, stratification, check sheets, and Pareto charts, while emphasizing their adaptability for presentations. It features templates and editable elements for data collection, illustrating defect occurrences and project details. Additionally, various generated graphs and charts can be linked to Excel for dynamic data updates.


![7 qc tools training material[1]](https://cdn.slidesharecdn.com/ss_thumbnails/7qctoolstrainingmaterial1-120925054558-phpapp02-thumbnail.jpg?width=640&height=640&fit=bounds)
![7 Quality Control Tools (SQC Model) [MARCH 2009]](https://cdn.slidesharecdn.com/ss_thumbnails/cfakepath7qctools-100630225608-phpapp01-thumbnail.jpg?width=640&height=640&fit=bounds)


![Driver Easy Pro Key 7.1.0.2641 Full Mac Crack Free Activated Download [2026]....](https://cdn.slidesharecdn.com/ss_thumbnails/software-251207185324-b2fb71b4-thumbnail.jpg?width=640&height=640&fit=bounds)


![AnyTrans for iOS 8.9.14.20251127 With Crack for MacOS [Latest] pptx](https://cdn.slidesharecdn.com/ss_thumbnails/softwareoverview-251207190907-2316965f-thumbnail.jpg?width=640&height=640&fit=bounds)


![iStat Menus 7.20 Crack for MacOS 2026 Full Version [Latest] pptx](https://cdn.slidesharecdn.com/ss_thumbnails/softwareoverview-251207191544-22b737dc-thumbnail.jpg?width=640&height=640&fit=bounds)