Downloaded 12 times
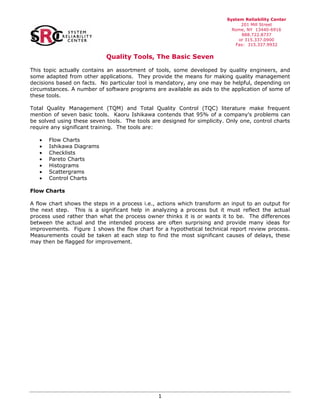


This document describes seven basic quality tools: flow charts, Ishikawa diagrams, checklists, Pareto charts, histograms, scattergrams, and control charts. It provides examples and explanations of how each tool can be used to identify problems, collect relevant data, determine causes and effects, and monitor processes to drive quality improvements. Specifically, flow charts map process steps, Ishikawa diagrams identify potential causes of defects, checklists gather data on defect categories, and Pareto charts, histograms, scattergrams, and control charts analyze data for insights. These seven tools can be applied to solve the vast majority of quality issues in an organization.


![7 qc tools[1] to print](https://cdn.slidesharecdn.com/ss_thumbnails/7qctools1toprint-191017092858-thumbnail.jpg?width=640&height=640&fit=bounds)


