Download to read offline
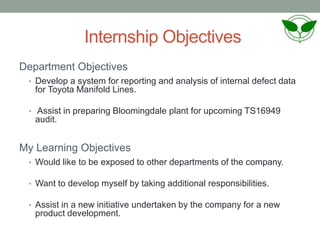
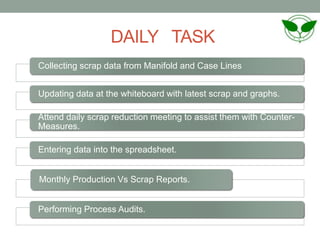
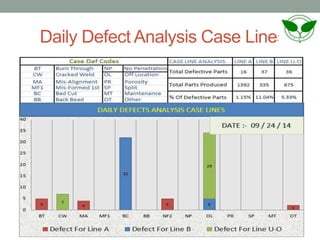
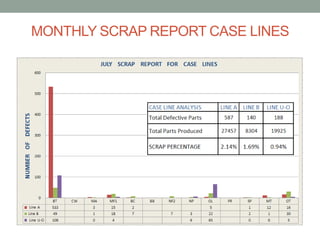
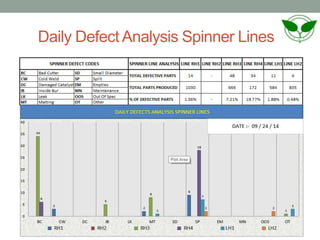
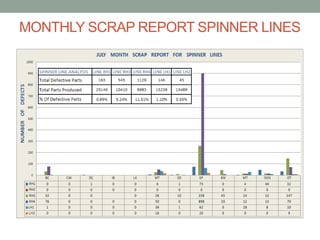
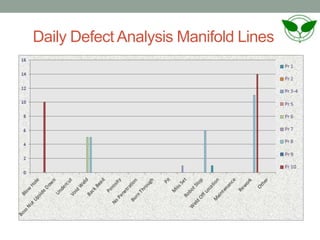
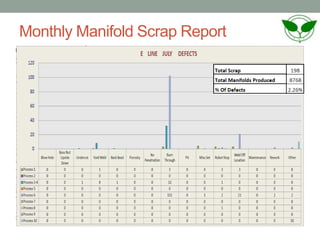
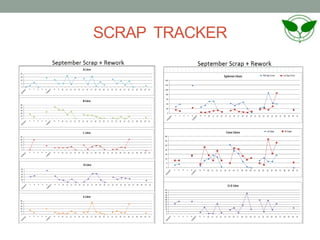
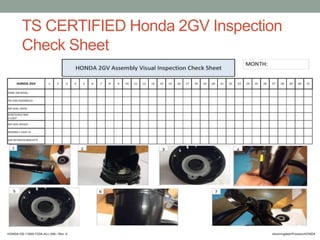
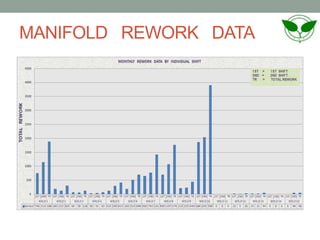
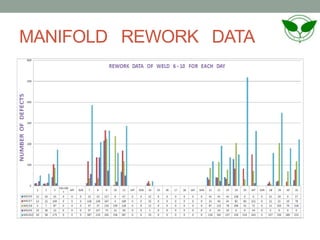
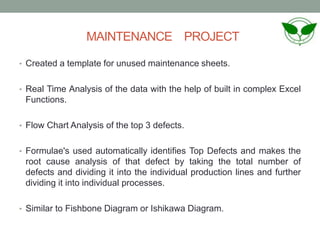
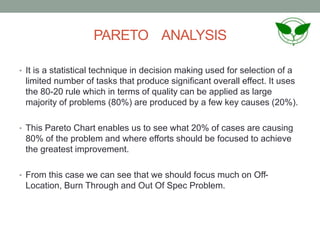
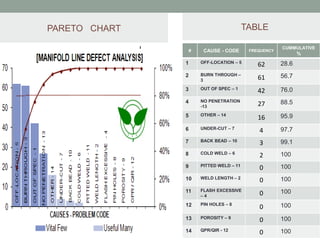
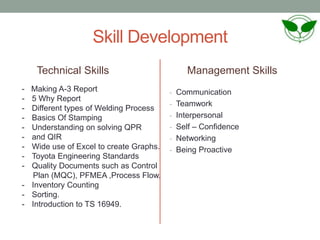


This document summarizes an internship at a Toyota manufacturing plant for quality control. The internship objectives are to develop a defect data reporting and analysis system for manifold lines, assist with preparing for an upcoming TS16949 audit, gain exposure to other departments, take on additional responsibilities, and assist with new product development. Daily tasks include collecting and analyzing scrap data from various production lines, updating metrics and reports, attending scrap reduction meetings, performing process audits, and updating quality documents for the audit. The intern also creates reports on defect analysis, scrap levels, production outputs, and conducts a maintenance project template and Pareto analysis on defects. The internship provided experience with quality tools, standards, and processes as well as


