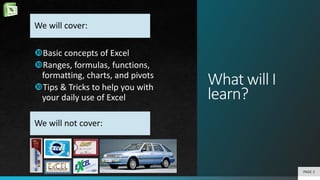
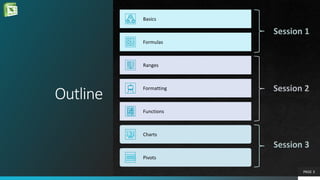
Data
Analysis
with
MSExcel
Kouros Goodarzi
PAGE 1
What will I
learn?
PAGE 2
Basic concepts of Excel
Ranges, formulas, functions,
formatting, charts, and pivots
Tips & Tricks to help you with
your daily use of Excel
We will cover:

We will not cover:
Outline
Basics
Formulas
Ranges
Formatting
Functions
Charts
Pivots
PAGE 3
Basics
What is MS Excel?
 Microsoft Excel is a spreadsheet developed by Microsoft
for Windows, macOS, Android and iOS. It features
calculation, graphing tools, pivot tables, and a macro
programming language called Visual Basic for
Applications (VBA). It has been a very widely applied
spreadsheet for these platforms, especially since version
5 in 1993, and it has replaced Lotus 1-2-3 as the industry
standard for spreadsheets. Excel forms part of the
Microsoft Office suite of software.*
 A spreadsheet is a computer application for
organization, analysis and storage of data in tabular
form. **
PAGE 4
Basics Formulas Ranges Formatting
*
https://en.wikipedia.org/wiki/Microsoft_Excel
**
https://en.wikipedia.org/wiki/Spreadsheet
Functions
There is no perfect presentation that
doesn’t quote Wikipedia at least once.
I did it twice just to be safe!
Charts Pivots
Basics
Data Analytics
 Data Science Lifecycle
 Excel can help with
 Pre-processing data
 Analyzing data
 Visualizing data
PAGE 5
Basics Formulas Ranges Formatting Functions Charts Pivots
Basics
Concepts
 Workbook, Worksheets (tabs), Rows/Columns, Cells
 Insert/delete, copy/paste, move around
 Data types (static/dynamic, text/number/date/…)
 Tables, Ranges, Names
 Objects, charts, Links, Drawings
 Addresses (absolute, relative)
PAGE 6
*
Basics Formulas Ranges Formatting Functions Charts Pivots
Basics
Tips & Tricks
 Finding a cell / hiding a cell
 Coloring Tabs and tab naming good practices
 Transposing a table
 Avoiding merges and empty rows/columns for datasets
 Absolute addressing (F4)
 Format as Table, autofill formulas
 Linking workbooks
PAGE 7
*
Basics Formulas Ranges Formatting Functions Charts Pivots
Formulas
Type in
You can start typing a formula in
a cell starting with an equal sign
‘=‘ followed by name of function
or variables or clicking through
cells (this is equivalent to clicking
on the small fx button next to the
formula bar)
Insert Function
From the Formulas ribbon, you
can select ‘Insert Function’
button to get a dialog with a
categorized list of all functions
Select from Library
From the Function Library on
Formulas ribbon, you can select
any of the predefined library
functions or select from the
‘More Functions’ drop down
PAGE 8
Basics Formulas Ranges Formatting Functions Charts Pivots
Formulas
PAGE 9
Concepts and Choices
 Formula bar resizing, using other editors (e.g.
Notepad++, VBA, or Eclipse)
 Categories: Financial, Date/Time, Math/Trig, Statistical,
Lookup/Reference, Database, Text, Logical, Information,
Engineering, Cube, Compatibility, Web
 Calculation Options/Calculate Now, Show Formulas,
Evaluate Formulas
 Error Checking, Circular References and arrows,
Inconsistent formulas
Formulas
Basics Ranges Formatting Functions Charts Pivots
Formulas
PAGE 10
Function List
 Financial: ACCRINT, RATE, YIELD
 Date/Time: EDATE, DATE, DATEVALUE, YEAR, MONTH, DAY, HOUR, MINUTE,
SECOND, NETWORKDAYS, TODAY, NOW, WEEKDAY
 Math/Trig: INT, ROUND, ROUNDDOWN, ROUNDUP, MDETERM, MINVERSE,
MMULT, MUNIT, RAND, RANDARRAY, RANDBETWEEN
 Statistical: SUM, SUMIF, SUMIFS, SUMPRODUCT, AVERAGE, AVERAGEA,
AVERAGEIF, AVERAGEIFS, BETA, BONOM, CHISQ, F, EXP, GAMMA, GAUSS, NORM,
POISSON, T, COUNT, COUNTA, COUNTIF, COUNTIFS, COUNTBLANK, FREQUENCY,
MIN, MAX
 Lookup/Reference: ADDRESS, ROW, COLUMN, INDEX, INDIRECT, HLOOKUP,
VLOOKUP, XLOOKUP, MATCH, XMATCH, UNIQUE, SORT, SORTBY, TRANSPOSE,
GETPIVOTDATA
 Text: CHAR, CONCAT, EXACT, LEFT, MID, RIGHT, LEN, FIND, LOWER, UPPER, VALUE,
NUMBERVALUE, REPLACE, SUBSTITUTE, TEXT, T, TRIM, TEXTJOIN
 Logical: AND, OR, XOR, NOT, FALSE, TRUE, IF, IFERROR, IFNA, IFS, SWITCH
 Information: ISBLANK, ISERR, ISERROR, ISNA, ISLOGICAL, ISEVEN, ISODD,
ISFORMULA, ISREF, ISTEXT, N, NA, SHEET, SHEETS, TYPE
 Web: ENCODEURL, FILTERXML, WEBSERVICE
Formulas
Basics Ranges Formatting Functions Charts Pivots
Ranges
PAGE 11
Concepts and Choices
 Definition of Range: rectangular set(s) of adjacent cells
 Selecting ranges
 Using Ctrl or Shift keys
 Using the mouse
 Ranges can be moved, copied, pasted, inserted, sorted
 Ranges can have a name referenceable in formula
 Tables are really a range
 Format as table to create a table from a range
 Table headers, Autofill, Row bands, Totals and Sub-totals,
Auto-grow
Formulas Ranges
Basics Formatting Functions Charts Pivots
Ranges
PAGE 12
Tips & Tricks
 Using Ctrl key to select non-adjacent ranges
 Using Ctrl+End and Ctrl+Shift+Home to select all cells
 Pasting vs. inserting
 Name a range and use it in a formula
 Sorting ranges vs sorting table columns
 Create a Table from a range of imported data
 Benefits of having your data in a table:
 Sorting & Filtering using your table headers
 Autofill formula
 Using table column named in formula
 Changing table format (bands)
 Adding (sub)totals
 Adding rows to the table (auto-grow)
Ranges
Formulas
Basics Formatting Functions Charts Pivots
Formatting
PAGE 13
Concepts and Choices
 Format box vs Home ribbon formatting
 Categories: General, Number, Currency, Date, Time,
Percentage, Fraction, Scientific, Text, Special, Custom
 Alignment, Orientation, wrapping/shrinking, direction
 Font, Border, Fill
 Merge and center
 Headers and footers and printing
 Formatting tables
 Conditional formatting
 Formatting objects
Ranges Formatting
Formulas
Basics Functions Charts Pivots
Formatting
PAGE 14
Tips & Tricks
 Format cells custom dates
 Convert to number
 Phone numbers, social security numbers
 Aligning to export to other office applications
 Coloring part of a cell and selective fonts and sizes
 Entering multiline text
 Merge and center and reconfiguring complex tables
 Create your printable report
 Formatting ranges as table
 Customize the table bands
 Override default cell colors and remedies
 Color scaling your table
 Create a rule to highlight differences in your table
 Format painter
 Finding duplicates using conditional formatting
 Formatting pictures, charts, tables, pivot objects
Formatting
Ranges
Formulas
Basics Functions Charts Pivots
Functions
PAGE 15
Concepts and Choices
 Visual Basic for Applications, Macros and Excel filetypes
 Recording and playback of macros
 Add-ins
 Excel Add-in: Analysis ToolPak
 COM Add-in: MS Power Pivot
 Buttons and controls
 Cells used on a sheet
Formatting Functions
Ranges
Formulas
Basics Charts Pivots
Functions
PAGE 16
Tips & Tricks
 Enabling the Developer ribbon
 Recording a macro to delete empty cells
 Creating a function to calculate statistical data
 Add-ins
 Analysis ToolPak – perform a single regression
 FormulaDesk – format and analyze your formulas
 Button to delete empty cells
 Resetting the last cell on a sheet
Functions
Formatting
Ranges
Formulas
Basics Charts Pivots
Charts
PAGE 17
Concepts and Choices
 Chart types: column, line, pie, bar, area, XY (scatter),
map, stock, surface, radar, treemap, sunburst,
histogram, box & whisker, waterfall, funnel, combo
 Chart Elements: Axes, Axis titles, chart title, data labels,
data table, error bars, gridlines, legend, lines, trendline,
up/down bars
 Series names and values, category, Chart styles and text
formats, templates, in-sheet charts (conditional
formatting), quick layouts
Functions Charts
Formatting
Ranges
Formulas
Basics Pivots
Charts
PAGE 18
Tips & Tricks
 Create a simple bar chart
 Create a simple pie chart
 Format chart elements
 Create a Combo chart
 Create not a chart, but a heat map
 Create a map
 Create a Gantt chart
Charts
Functions
Formatting
Ranges
Formulas
Basics Pivots
Pivots
PAGE 19
Concepts and Choices
 Fields, filters, columns, rows, values, field list, refreshing
data
 Sort, filter, field format, summary calculations, group by
date, total percentage, distinct count, expansion and
collapsing grouped data
 Pivot charts, GetPivotData, Self-contained pivot tables,
manual group and sort, renaming fields, drill down,
tabular pivot tables, format empty cells
Charts Pivots
Functions
Formatting
Ranges
Formulas
Basics
Pivots
PAGE 20
Tips & Tricks
 Create a simple Pivot Table from source data
 Create a 2-D Pivot Table
 Add date grouping to a Pivot Table
 Sort by a field, filter by a field
 Add percentage field for an existing column
 Create Pivot Table to show distinct counts
 Create a simple Pivot Chart
 Use GetPivotData to refer to Pivot Table data
 Create a Self-contained Pivot Table
 Manually create bands of values in a Pivot Table
 Drill down summary values
 Create a Tabular Pivot Tables with repeating cells and formatted
empty cells
Pivots
Charts
Functions
Formatting
Ranges
Formulas
Basics
Links
 Microsoft’s Excel Help & Learning
 Udemy Excel Training
 Stack Overflow Excel tag
 Exceltip
 StackExchange’s superuser Excel tag
 Top Excel Add-ins
 FormulaDesk Add-in
 ExcelJet
PAGE 21
Q&A
 Contact me with your questions:
krs@ieee.org
+1.604.726.1387
www.linkedin..com/kgoodarzi
PAGE 22

Data Analysis with MS Excel.pptx

  • 1.
  • 2.
    What will I learn? PAGE2 Basic concepts of Excel Ranges, formulas, functions, formatting, charts, and pivots Tips & Tricks to help you with your daily use of Excel We will cover:  We will not cover:
  • 3.
  • 4.
    Basics What is MSExcel?  Microsoft Excel is a spreadsheet developed by Microsoft for Windows, macOS, Android and iOS. It features calculation, graphing tools, pivot tables, and a macro programming language called Visual Basic for Applications (VBA). It has been a very widely applied spreadsheet for these platforms, especially since version 5 in 1993, and it has replaced Lotus 1-2-3 as the industry standard for spreadsheets. Excel forms part of the Microsoft Office suite of software.*  A spreadsheet is a computer application for organization, analysis and storage of data in tabular form. ** PAGE 4 Basics Formulas Ranges Formatting * https://en.wikipedia.org/wiki/Microsoft_Excel ** https://en.wikipedia.org/wiki/Spreadsheet Functions There is no perfect presentation that doesn’t quote Wikipedia at least once. I did it twice just to be safe! Charts Pivots
  • 5.
    Basics Data Analytics  DataScience Lifecycle  Excel can help with  Pre-processing data  Analyzing data  Visualizing data PAGE 5 Basics Formulas Ranges Formatting Functions Charts Pivots
  • 6.
    Basics Concepts  Workbook, Worksheets(tabs), Rows/Columns, Cells  Insert/delete, copy/paste, move around  Data types (static/dynamic, text/number/date/…)  Tables, Ranges, Names  Objects, charts, Links, Drawings  Addresses (absolute, relative) PAGE 6 * Basics Formulas Ranges Formatting Functions Charts Pivots
  • 7.
    Basics Tips & Tricks Finding a cell / hiding a cell  Coloring Tabs and tab naming good practices  Transposing a table  Avoiding merges and empty rows/columns for datasets  Absolute addressing (F4)  Format as Table, autofill formulas  Linking workbooks PAGE 7 * Basics Formulas Ranges Formatting Functions Charts Pivots
  • 8.
    Formulas Type in You canstart typing a formula in a cell starting with an equal sign ‘=‘ followed by name of function or variables or clicking through cells (this is equivalent to clicking on the small fx button next to the formula bar) Insert Function From the Formulas ribbon, you can select ‘Insert Function’ button to get a dialog with a categorized list of all functions Select from Library From the Function Library on Formulas ribbon, you can select any of the predefined library functions or select from the ‘More Functions’ drop down PAGE 8 Basics Formulas Ranges Formatting Functions Charts Pivots
  • 9.
    Formulas PAGE 9 Concepts andChoices  Formula bar resizing, using other editors (e.g. Notepad++, VBA, or Eclipse)  Categories: Financial, Date/Time, Math/Trig, Statistical, Lookup/Reference, Database, Text, Logical, Information, Engineering, Cube, Compatibility, Web  Calculation Options/Calculate Now, Show Formulas, Evaluate Formulas  Error Checking, Circular References and arrows, Inconsistent formulas Formulas Basics Ranges Formatting Functions Charts Pivots
  • 10.
    Formulas PAGE 10 Function List Financial: ACCRINT, RATE, YIELD  Date/Time: EDATE, DATE, DATEVALUE, YEAR, MONTH, DAY, HOUR, MINUTE, SECOND, NETWORKDAYS, TODAY, NOW, WEEKDAY  Math/Trig: INT, ROUND, ROUNDDOWN, ROUNDUP, MDETERM, MINVERSE, MMULT, MUNIT, RAND, RANDARRAY, RANDBETWEEN  Statistical: SUM, SUMIF, SUMIFS, SUMPRODUCT, AVERAGE, AVERAGEA, AVERAGEIF, AVERAGEIFS, BETA, BONOM, CHISQ, F, EXP, GAMMA, GAUSS, NORM, POISSON, T, COUNT, COUNTA, COUNTIF, COUNTIFS, COUNTBLANK, FREQUENCY, MIN, MAX  Lookup/Reference: ADDRESS, ROW, COLUMN, INDEX, INDIRECT, HLOOKUP, VLOOKUP, XLOOKUP, MATCH, XMATCH, UNIQUE, SORT, SORTBY, TRANSPOSE, GETPIVOTDATA  Text: CHAR, CONCAT, EXACT, LEFT, MID, RIGHT, LEN, FIND, LOWER, UPPER, VALUE, NUMBERVALUE, REPLACE, SUBSTITUTE, TEXT, T, TRIM, TEXTJOIN  Logical: AND, OR, XOR, NOT, FALSE, TRUE, IF, IFERROR, IFNA, IFS, SWITCH  Information: ISBLANK, ISERR, ISERROR, ISNA, ISLOGICAL, ISEVEN, ISODD, ISFORMULA, ISREF, ISTEXT, N, NA, SHEET, SHEETS, TYPE  Web: ENCODEURL, FILTERXML, WEBSERVICE Formulas Basics Ranges Formatting Functions Charts Pivots
  • 11.
    Ranges PAGE 11 Concepts andChoices  Definition of Range: rectangular set(s) of adjacent cells  Selecting ranges  Using Ctrl or Shift keys  Using the mouse  Ranges can be moved, copied, pasted, inserted, sorted  Ranges can have a name referenceable in formula  Tables are really a range  Format as table to create a table from a range  Table headers, Autofill, Row bands, Totals and Sub-totals, Auto-grow Formulas Ranges Basics Formatting Functions Charts Pivots
  • 12.
    Ranges PAGE 12 Tips &Tricks  Using Ctrl key to select non-adjacent ranges  Using Ctrl+End and Ctrl+Shift+Home to select all cells  Pasting vs. inserting  Name a range and use it in a formula  Sorting ranges vs sorting table columns  Create a Table from a range of imported data  Benefits of having your data in a table:  Sorting & Filtering using your table headers  Autofill formula  Using table column named in formula  Changing table format (bands)  Adding (sub)totals  Adding rows to the table (auto-grow) Ranges Formulas Basics Formatting Functions Charts Pivots
  • 13.
    Formatting PAGE 13 Concepts andChoices  Format box vs Home ribbon formatting  Categories: General, Number, Currency, Date, Time, Percentage, Fraction, Scientific, Text, Special, Custom  Alignment, Orientation, wrapping/shrinking, direction  Font, Border, Fill  Merge and center  Headers and footers and printing  Formatting tables  Conditional formatting  Formatting objects Ranges Formatting Formulas Basics Functions Charts Pivots
  • 14.
    Formatting PAGE 14 Tips &Tricks  Format cells custom dates  Convert to number  Phone numbers, social security numbers  Aligning to export to other office applications  Coloring part of a cell and selective fonts and sizes  Entering multiline text  Merge and center and reconfiguring complex tables  Create your printable report  Formatting ranges as table  Customize the table bands  Override default cell colors and remedies  Color scaling your table  Create a rule to highlight differences in your table  Format painter  Finding duplicates using conditional formatting  Formatting pictures, charts, tables, pivot objects Formatting Ranges Formulas Basics Functions Charts Pivots
  • 15.
    Functions PAGE 15 Concepts andChoices  Visual Basic for Applications, Macros and Excel filetypes  Recording and playback of macros  Add-ins  Excel Add-in: Analysis ToolPak  COM Add-in: MS Power Pivot  Buttons and controls  Cells used on a sheet Formatting Functions Ranges Formulas Basics Charts Pivots
  • 16.
    Functions PAGE 16 Tips &Tricks  Enabling the Developer ribbon  Recording a macro to delete empty cells  Creating a function to calculate statistical data  Add-ins  Analysis ToolPak – perform a single regression  FormulaDesk – format and analyze your formulas  Button to delete empty cells  Resetting the last cell on a sheet Functions Formatting Ranges Formulas Basics Charts Pivots
  • 17.
    Charts PAGE 17 Concepts andChoices  Chart types: column, line, pie, bar, area, XY (scatter), map, stock, surface, radar, treemap, sunburst, histogram, box & whisker, waterfall, funnel, combo  Chart Elements: Axes, Axis titles, chart title, data labels, data table, error bars, gridlines, legend, lines, trendline, up/down bars  Series names and values, category, Chart styles and text formats, templates, in-sheet charts (conditional formatting), quick layouts Functions Charts Formatting Ranges Formulas Basics Pivots
  • 18.
    Charts PAGE 18 Tips &Tricks  Create a simple bar chart  Create a simple pie chart  Format chart elements  Create a Combo chart  Create not a chart, but a heat map  Create a map  Create a Gantt chart Charts Functions Formatting Ranges Formulas Basics Pivots
  • 19.
    Pivots PAGE 19 Concepts andChoices  Fields, filters, columns, rows, values, field list, refreshing data  Sort, filter, field format, summary calculations, group by date, total percentage, distinct count, expansion and collapsing grouped data  Pivot charts, GetPivotData, Self-contained pivot tables, manual group and sort, renaming fields, drill down, tabular pivot tables, format empty cells Charts Pivots Functions Formatting Ranges Formulas Basics
  • 20.
    Pivots PAGE 20 Tips &Tricks  Create a simple Pivot Table from source data  Create a 2-D Pivot Table  Add date grouping to a Pivot Table  Sort by a field, filter by a field  Add percentage field for an existing column  Create Pivot Table to show distinct counts  Create a simple Pivot Chart  Use GetPivotData to refer to Pivot Table data  Create a Self-contained Pivot Table  Manually create bands of values in a Pivot Table  Drill down summary values  Create a Tabular Pivot Tables with repeating cells and formatted empty cells Pivots Charts Functions Formatting Ranges Formulas Basics
  • 21.
    Links  Microsoft’s ExcelHelp & Learning  Udemy Excel Training  Stack Overflow Excel tag  Exceltip  StackExchange’s superuser Excel tag  Top Excel Add-ins  FormulaDesk Add-in  ExcelJet PAGE 21
  • 22.
    Q&A  Contact mewith your questions: krs@ieee.org +1.604.726.1387 www.linkedin..com/kgoodarzi PAGE 22

Editor's Notes

  • #16 type ActiveSheet.UsedRange in Immediate window
  • #18 type ActiveSheet.UsedRange in Immediate window
  • #20 type ActiveSheet.UsedRange in Immediate window