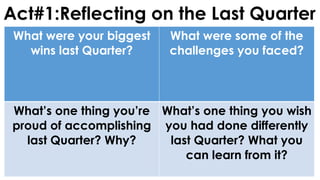
What were yourbiggest
wins last Quarter?
What were some of the
challenges you faced?
What’s one thing you’re
proud of accomplishing
last Quarter? Why?
What’s one thing you wish
you had done differently
last Quarter? What you
can learn from it?
Act#1:Reflecting on the Last Quarter
MS Excel
Microsoft Excelprovides an automated way of
displaying any statistical data. It can be used to
automatically compute for several factors that
are not easy to notice especially when faced by
a large data. Microsoft Excel includes several
arithmetic and basic functions that help you
compute faster.
4.
MS Excel
It featurescalculation, graphing tools, pivot
tables, and a macro programming language.
It can compute costs incurred in the
creation of projects, or create tables for findings
in the researchers, and then create reports for
business or research that you are doing.
It is also a collaboration tool for financial
analysis or modelling.
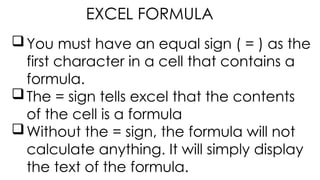
You must havean equal sign ( = ) as the
first character in a cell that contains a
formula.
The = sign tells excel that the contents
of the cell is a formula
Without the = sign, the formula will not
calculate anything. It will simply display
the text of the formula.
EXCEL FORMULA
11.
11
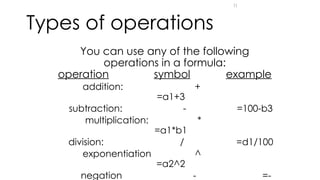
Types of operations
Youcan use any of the following
operations in a formula:
operation symbol example
addition: +
=a1+3
subtraction: - =100-b3
multiplication: *
=a1*b1
division: / =d1/100
exponentiation ^
=a2^2
negation - =-
What is afunction?
A function is a "named operation"
Functions have
a name
parentheses
parameters/arguments inside the parentheses
• Many parameters for one function separated with
commas (,)
To find a list of all excel functions can be found
on the Formula Tab >> Insert Function
14.
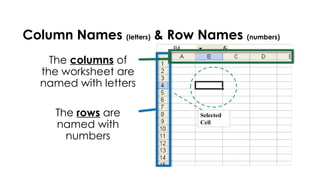
Range – thecells where the counting will
take place or the cells involved.
Criteria – the label or value that
determines if it is to be counted.
- a (“”) quotation mark
15.
Max – thehighest value
Max | Min | Average | Averageif |
Min – the lowest/ minimum value
FUNCTIONS
16.
Average – afunction
used to compute for the
average of the number
of a range.
Averageif – a function
used to compute for the
average of a range if a
certain condition is met.
=AVERAGEIF(range, criteria, [average_range]
17.
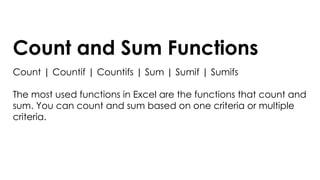
Count and SumFunctions
Count | Countif | Countifs | Sum | Sumif | Sumifs
The most used functions in Excel are the functions that count and
sum. You can count and sum based on one criteria or multiple
criteria.
18.
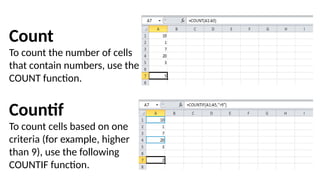
Count
To count thenumber of cells
that contain numbers, use the
COUNT function.
Countif
To count cells based on one
criteria (for example, higher
than 9), use the following
COUNTIF function.
19.
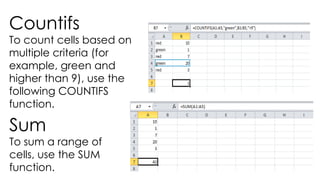
Countifs
To count cellsbased on
multiple criteria (for
example, green and
higher than 9), use the
following COUNTIFS
function.
Sum
To sum a range of
cells, use the SUM
function.
20.
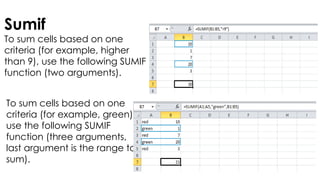
Sumif
To sum cellsbased on one
criteria (for example, higher
than 9), use the following SUMIF
function (two arguments).
To sum cells based on one
criteria (for example, green),
use the following SUMIF
function (three arguments,
last argument is the range to
sum).
21.
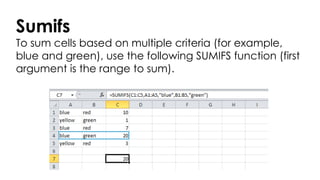
Sumifs
To sum cellsbased on multiple criteria (for example,
blue and green), use the following SUMIFS function (first
argument is the range to sum).
22.
22
Other function
Mean –the result obtained by adding
several quantities together and then
dividing this total by the number (N) of
quantities; the average
Mean = SUM(range)/N
or
Mean =Average(range)
24
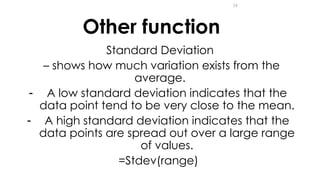
Other function
Standard Deviation
–shows how much variation exists from the
average.
- A low standard deviation indicates that the
data point tend to be very close to the mean.
- A high standard deviation indicates that the
data points are spread out over a large range
of values.
=Stdev(range)
25.
Get you laptopand let’s create a
computation based on the
problem and let’s solve it.


![Average – a function
used to compute for the
average of the number
of a range.
Averageif – a function
used to compute for the
average of a range if a
certain condition is met.
=AVERAGEIF(range, criteria, [average_range]](https://image.slidesharecdn.com/empowerment-technology-ms-excel-250312003733-27bd06c0/85/Empowerment-Technology-Microsoft-Excel-pptx-16-320.jpg)