Downloaded 90 times

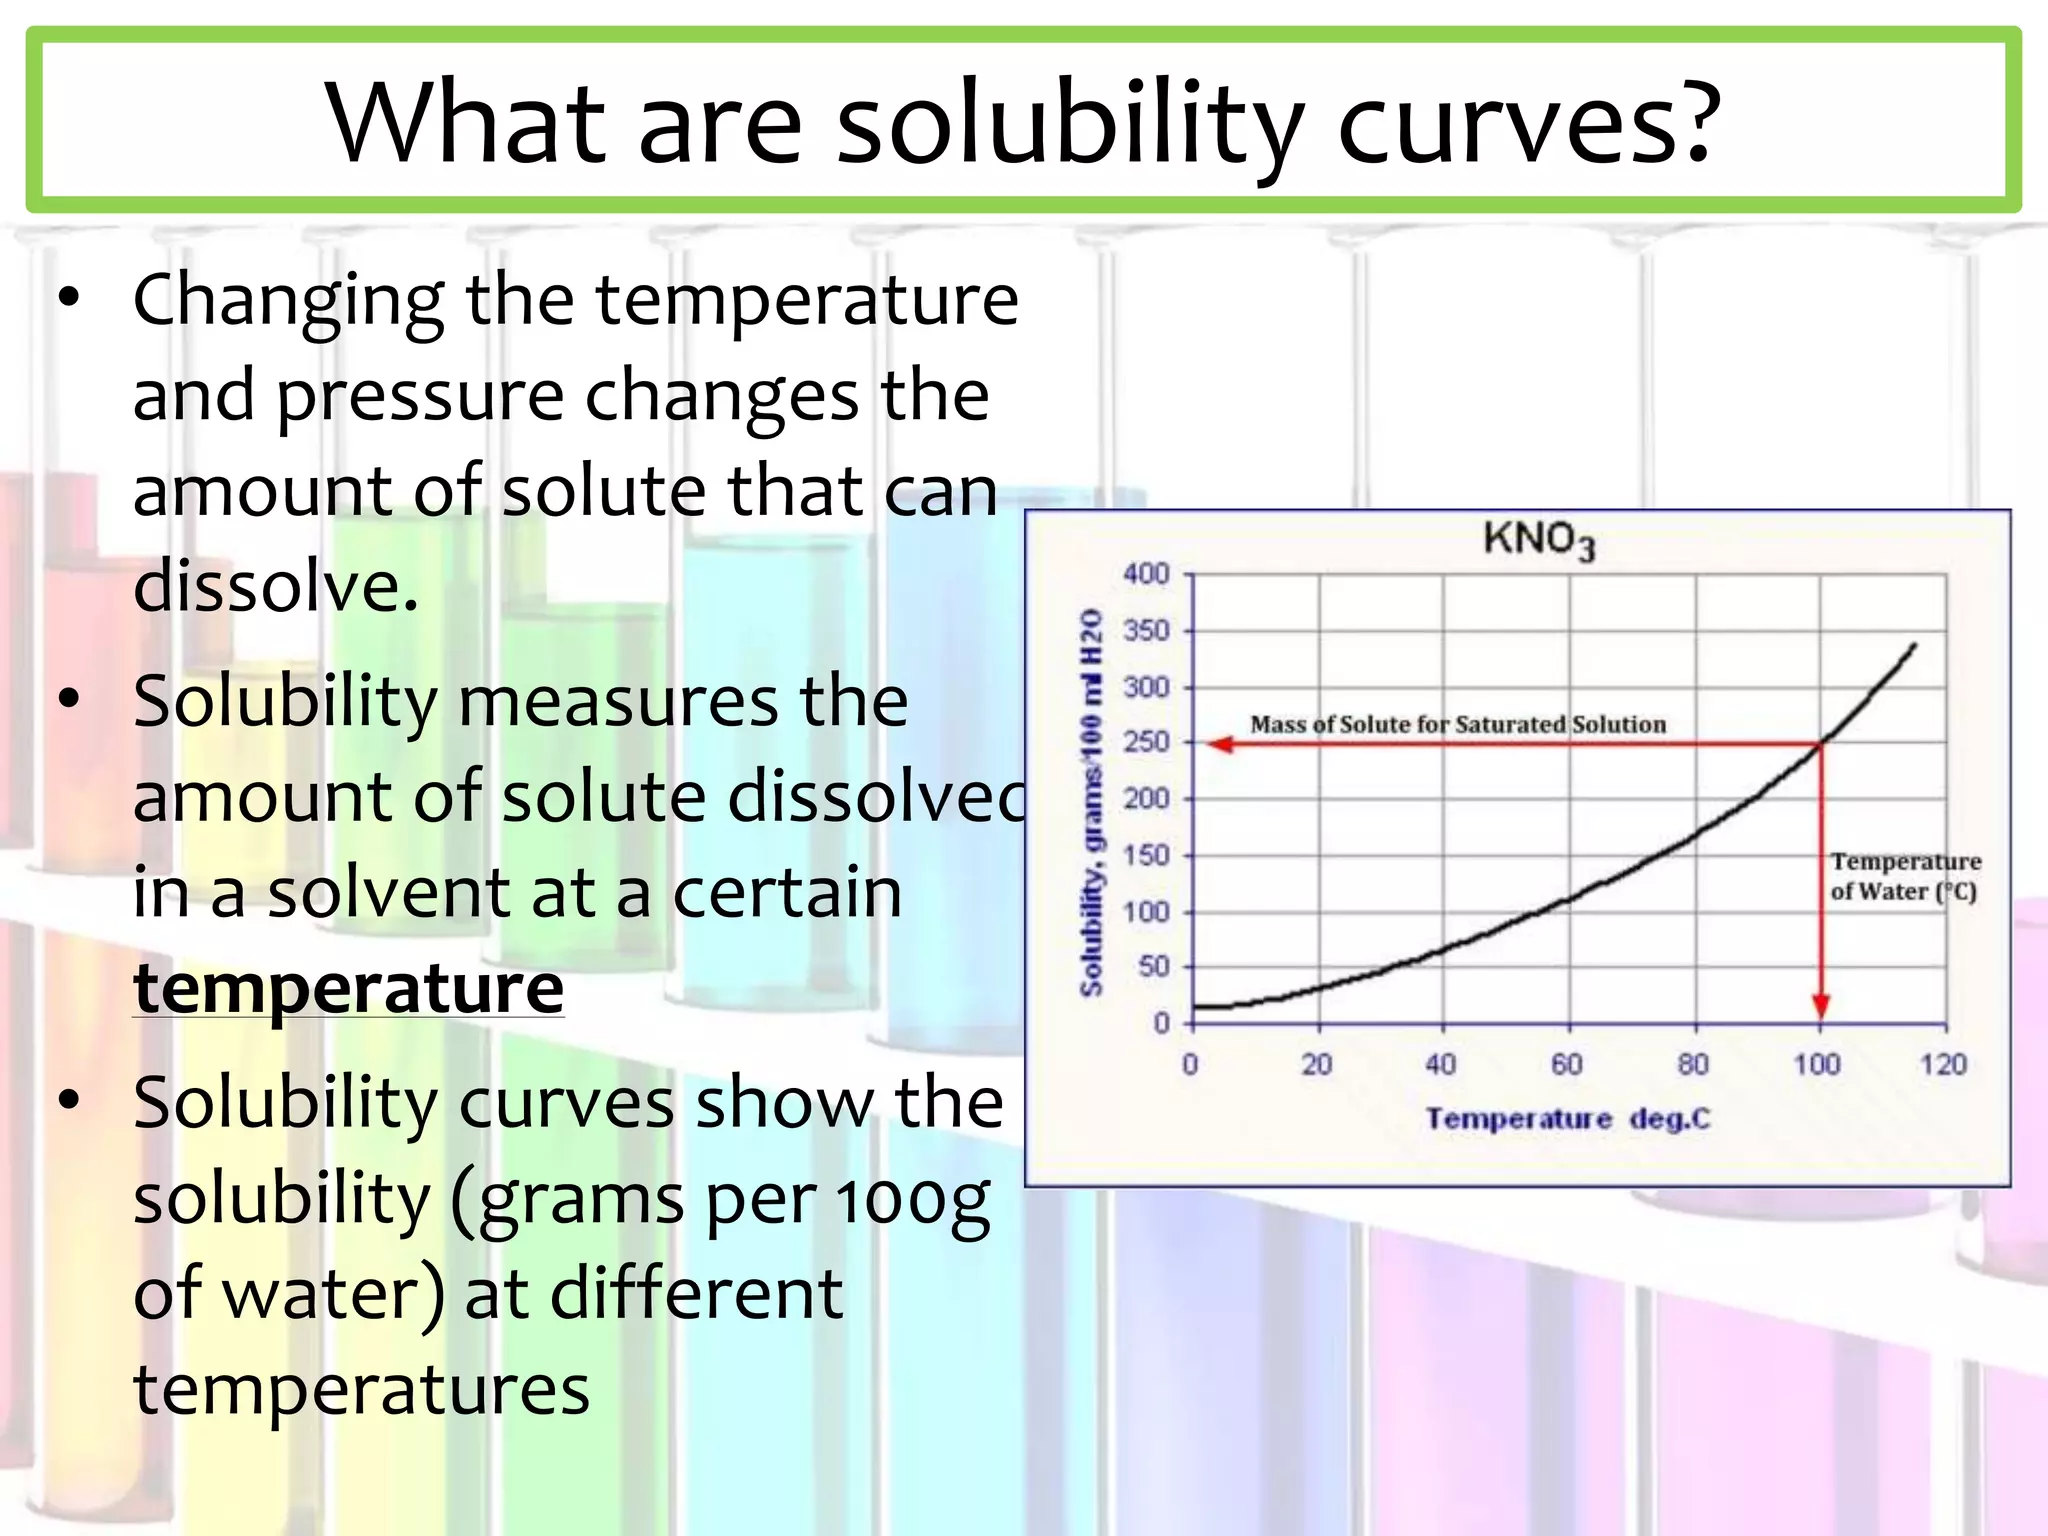
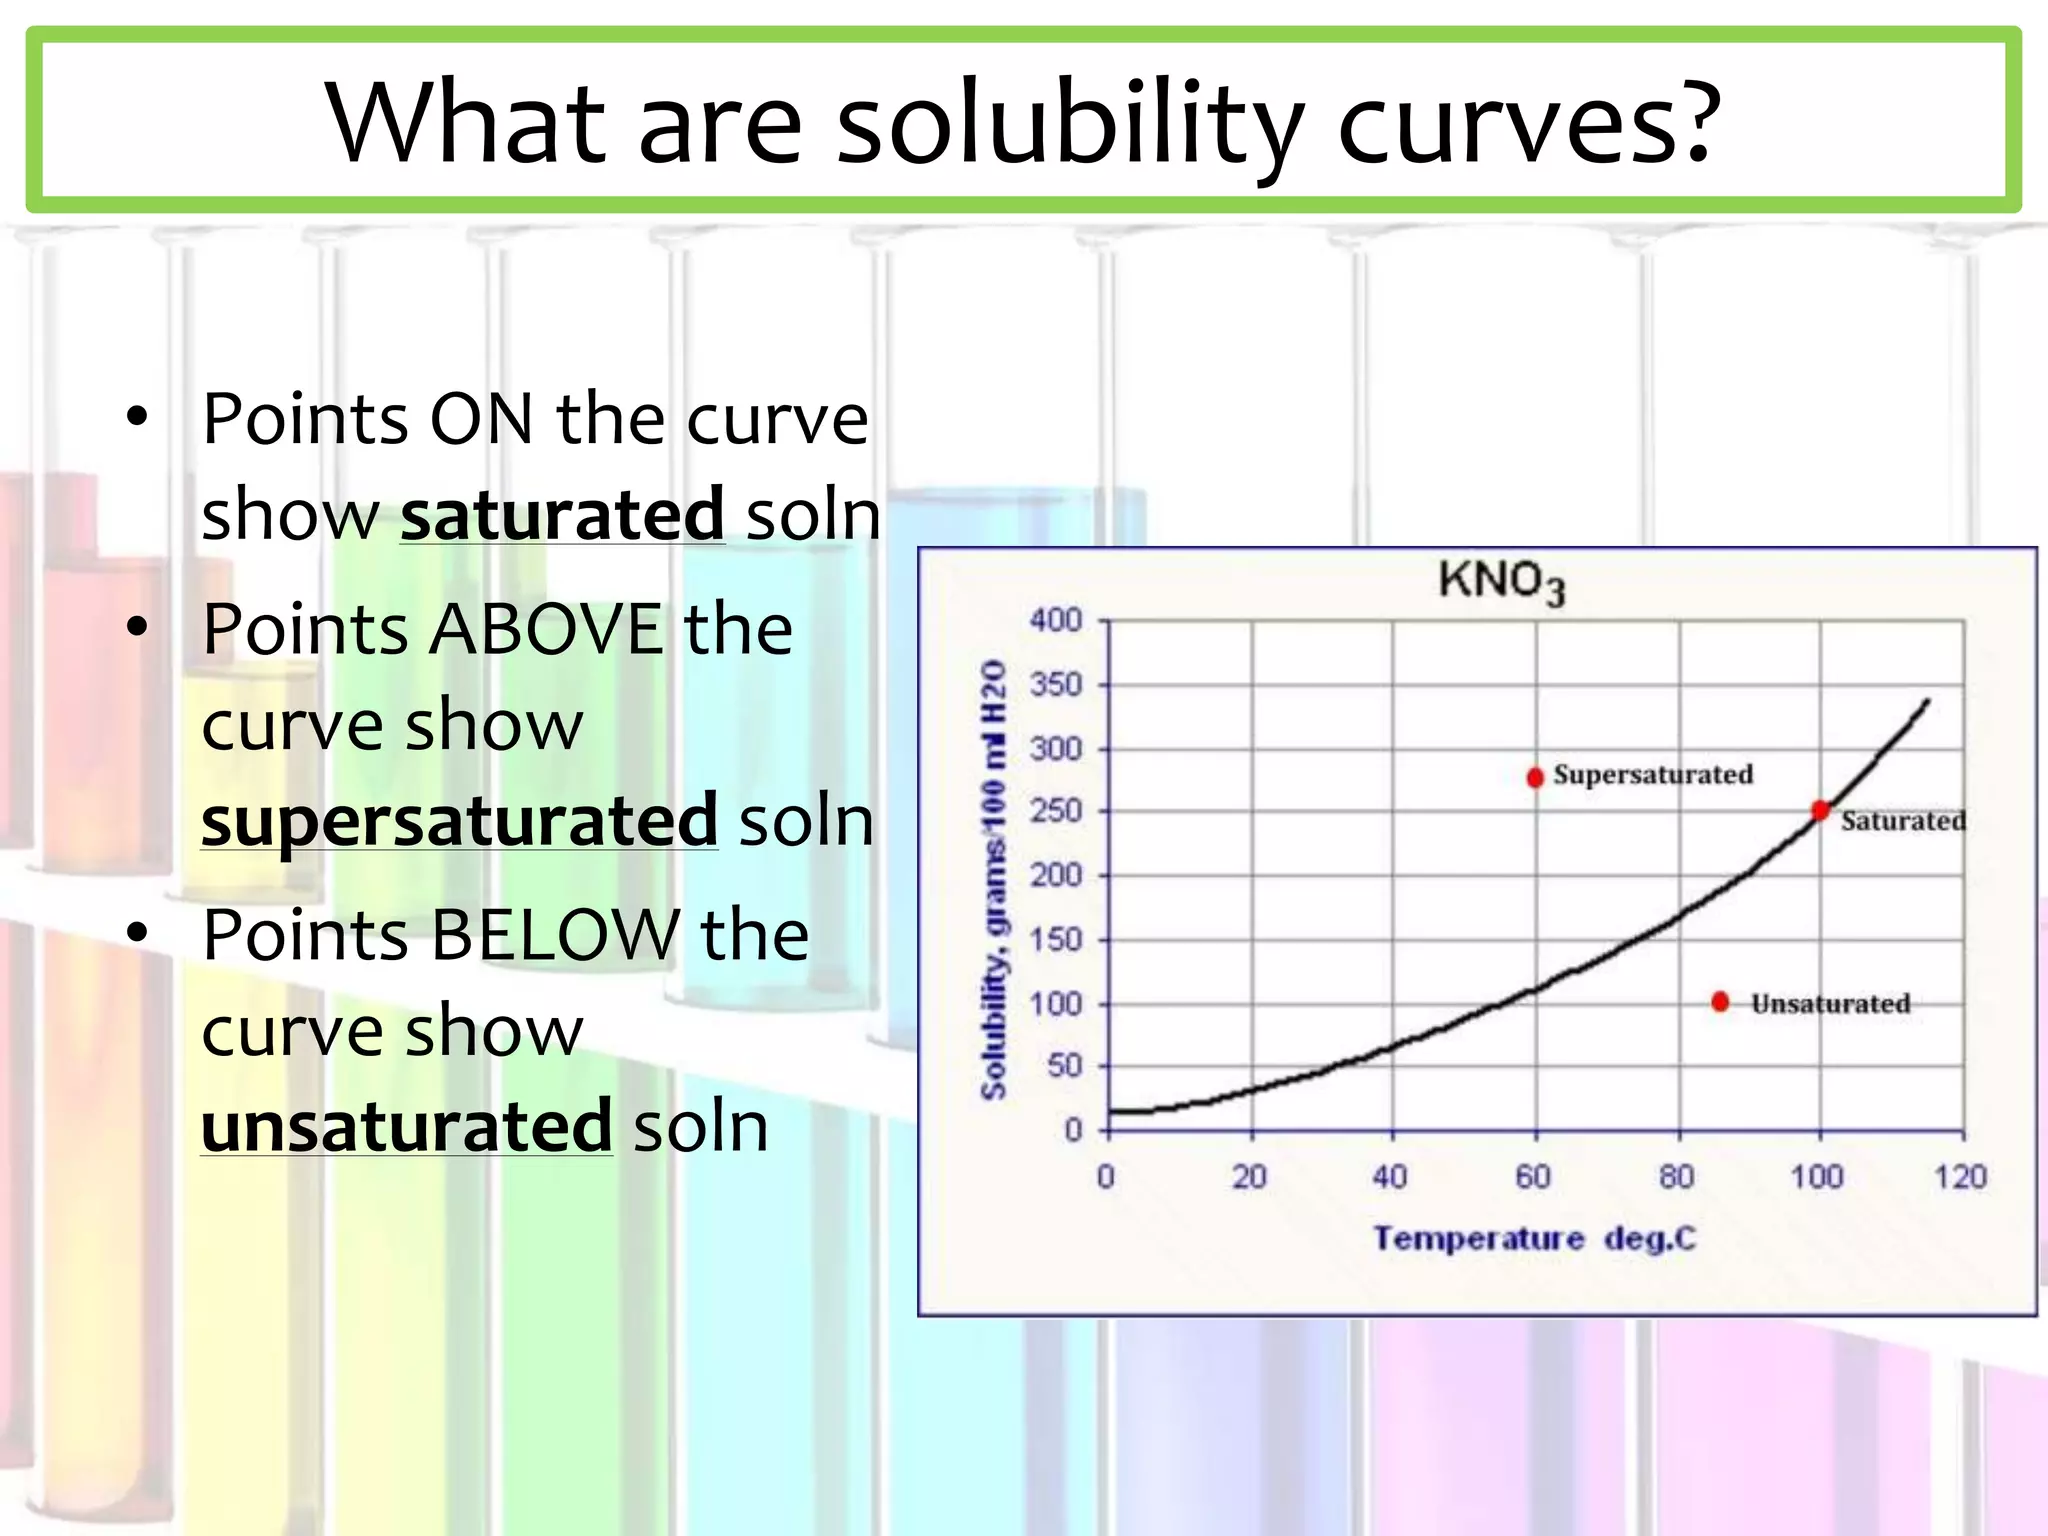
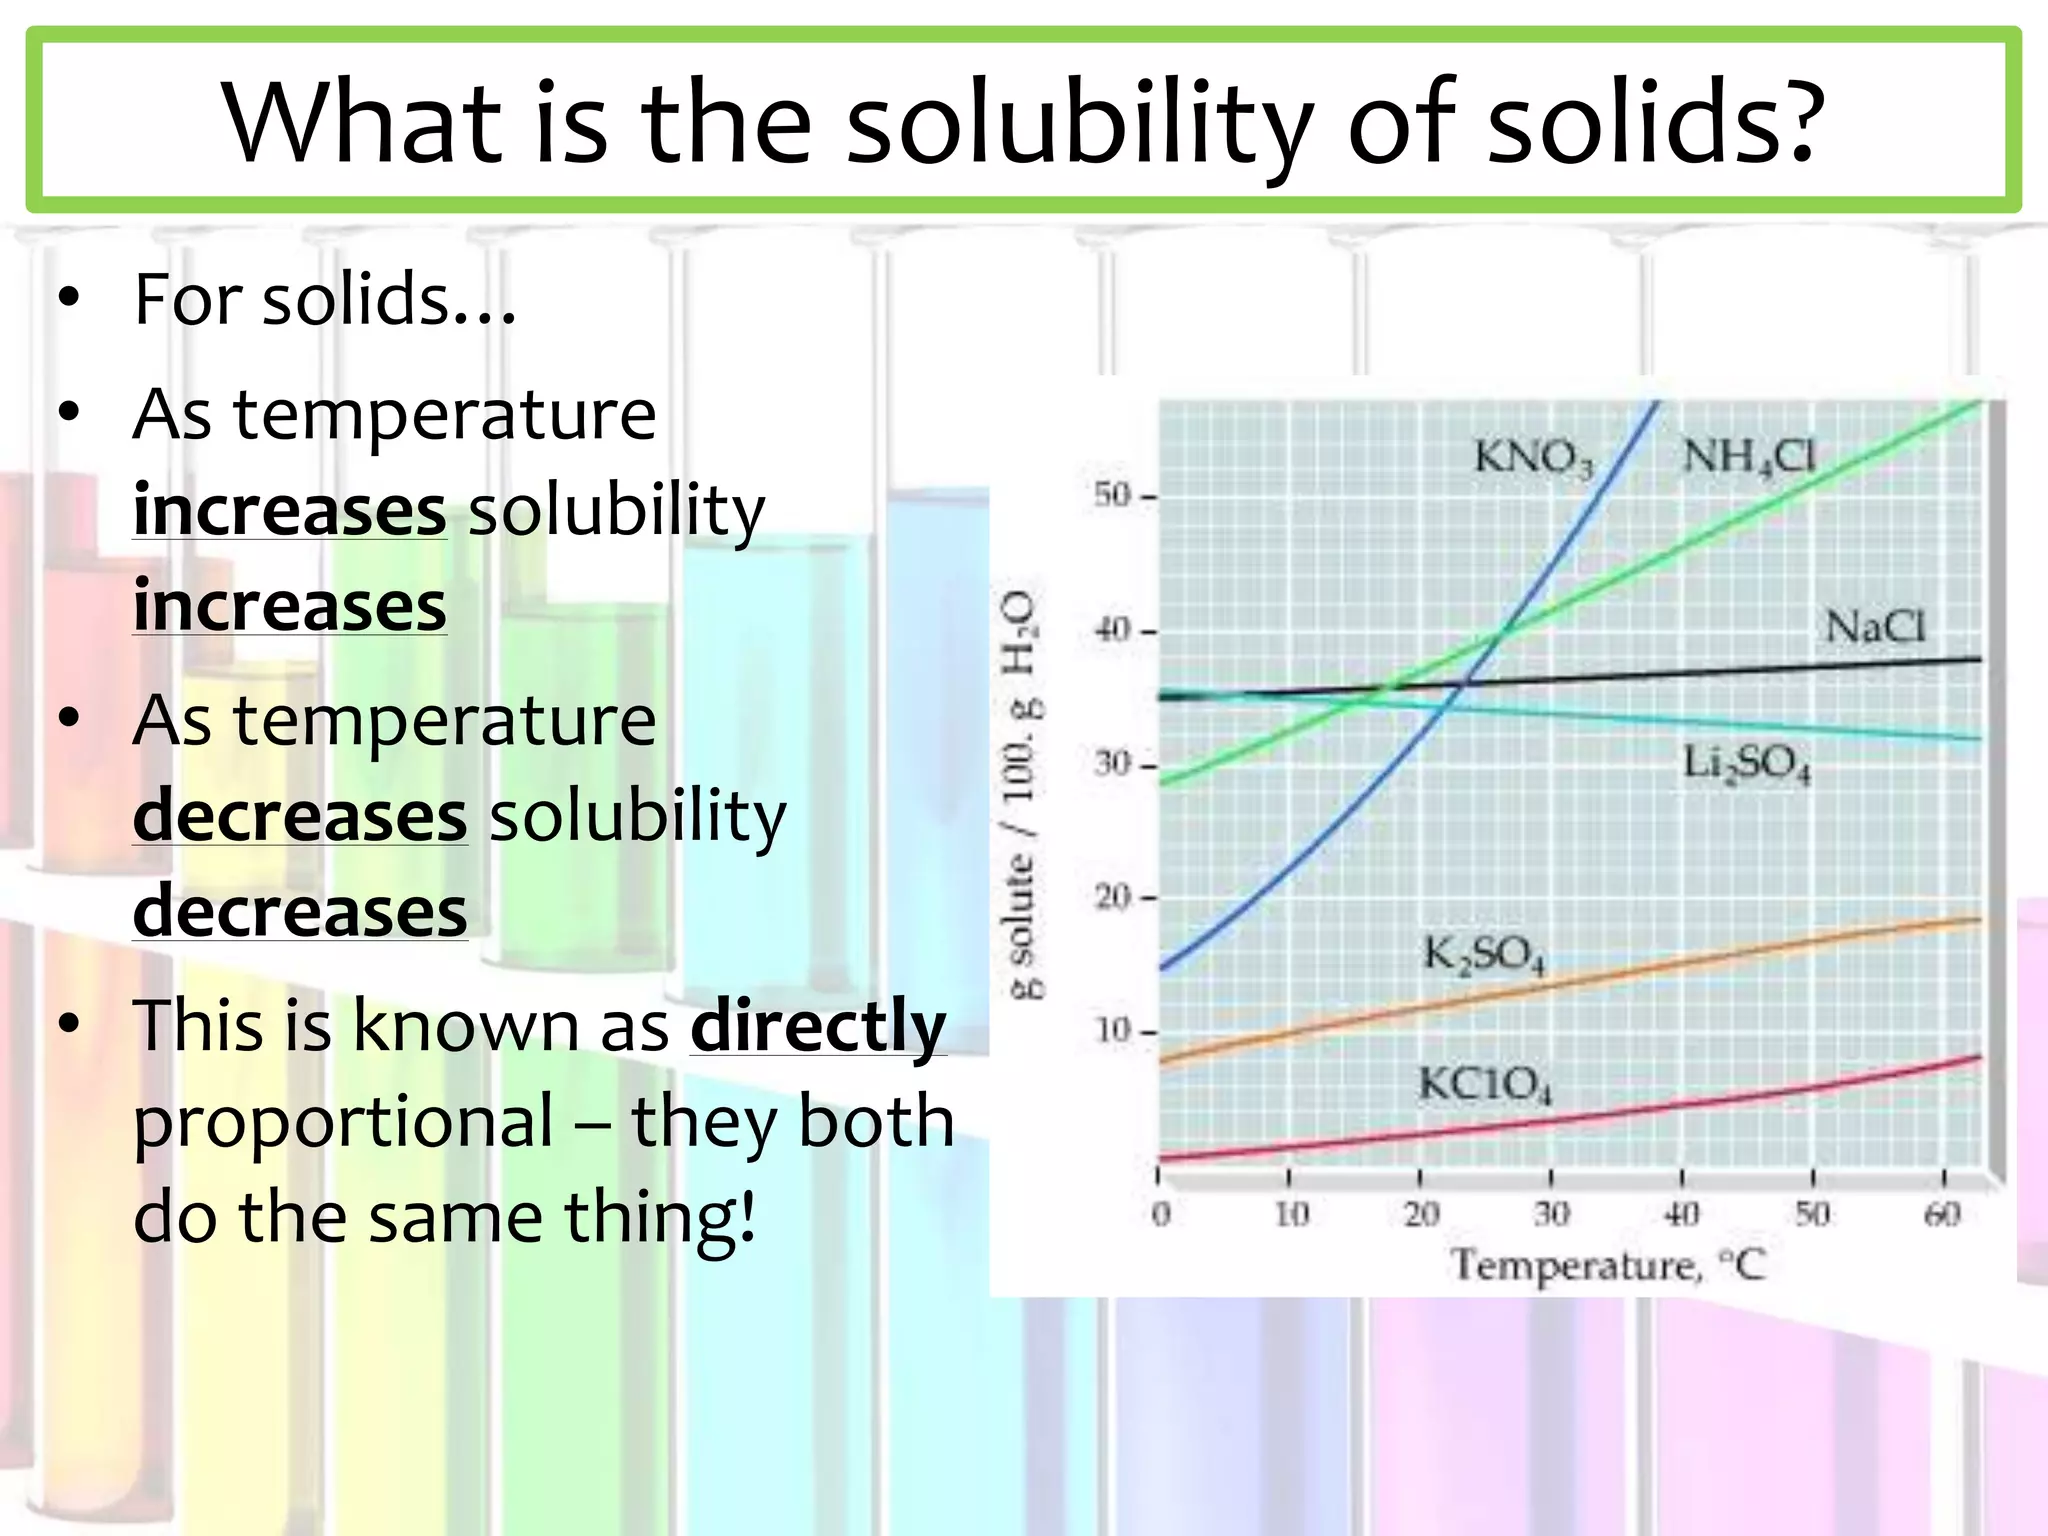


This document discusses solubility curves and how they are used to show the solubility of solids and gases in water at different temperatures. Solubility curves indicate the maximum amount of solute that can dissolve in a solvent, with points on the curve showing saturated solutions, above showing supersaturated, and below showing unsaturated. The document explains that for solids, solubility increases with temperature, while for gases solubility decreases with increasing temperature. Examples of solid and gas substances are provided.


![Solubility 2[1]](https://cdn.slidesharecdn.com/ss_thumbnails/solubility-21-110330080351-phpapp01-thumbnail.jpg?width=640&height=640&fit=bounds)


