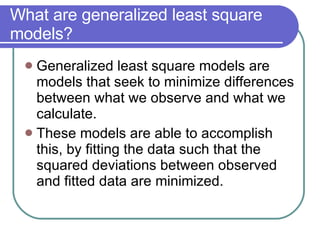
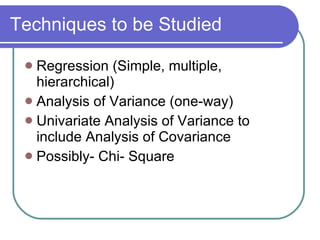
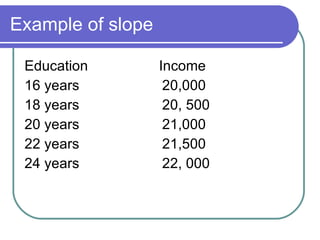
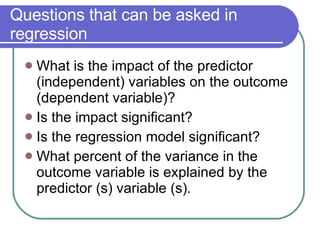
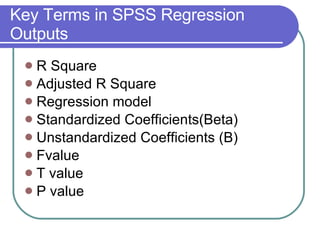
Intermediate Statistics Professors:Ramaswami & Walker
This Morning’s Session Review of Course Outline Review of Course Expectations Review of First Stat’s course Break Introduction to Generalized Linear Techniques Introduction to Regression Break Simple Regression
Purpose of the course To assist you to develop the tools and knowledge on how to: (a) be intelligent consumers of data; (b) be able to run your own analysis; © understand how to interpret data and (d) be able to derive logical inferences based on data
Focus of the Course Generalized Least Square techniques Interpretation using SPSS Outputs Knowing SPSS (Statistical Package for the Social Sciences)
Course Requirements Mid-term examination Final examination Always have handouts in class Have a calculator Politeness Cooperative ethos Working independently on exams
Review of First Stats Course What are the different types of measurement? What is correlational analysis Interpret the following findings:
Example 1: In a study that examined the relationship between number of days present in school and students’ sense of belonging among 135 high school students  the following Pearson Correlation statistics was obtained: r=.64; p<=.000
Example 2 The relationship between time on task and obtaining a grade of C+ or lower was found to be r= -.32; p <= .048 for 50 students in an alternative education program for disruptive students.
What are generalized least square models? Generalized least square models are models that seek to minimize differences between what we observe and what we calculate. These models are able to accomplish this, by fitting the data such that the squared deviations between observed and fitted data are minimized.
Example Refer to example on the board-
Techniques to be Studied Regression (Simple, multiple, hierarchical) Analysis of Variance (one-way) Univariate Analysis of Variance to include Analysis of Covariance Possibly- Chi- Square
Regression History- in France, applied to the study of astronomy- orbits of bodies around the sun (least squares method) Term regression coined in the 19 th  C to describe a biological phenomenon- children of exceptional individuals tended to be less intelligent than their parents- Darwin’s cousin Francis Galton- “regression towards mediocrity”.  Work later extended by Pearson and Yukle
Assumptions of Regression Sample must be representative of the population. The dependent variable must be continuous. The independent variables must be linearly related but not strongly The independent variable should be continuous although categorical variables can be used. Values of the independent variables are normally distributed
The Basic Regression Model Predicted Y= a+ B1(X1)+ B2(X2)……..error Where B1 represent the impact of X1 on Y a represents the constant or the intercept. Y is our outcome variable X is our independent variable
What do the terms mean? B is called the slope or the regression coefficient.  It is the change in the dependent variable for a unit change in x or the predictor variable
Example of slope Education  Income 16 years  20,000 18 years  20, 500 20 years  21,000 22 years  21,500  24 years  22, 000
Questions that can be asked in regression What is the impact of the predictor (independent) variables on the outcome (dependent variable)? Is the impact significant? Is the regression model significant? What percent of the variance in the outcome variable is explained by the predictor (s) variable (s).
Key Terms in SPSS Regression Outputs R Square Adjusted R Square Regression model Standardized Coefficients(Beta) Unstandardized Coefficients (B) Fvalue T value P value

Intermediate Statistics 1

  • 1.
  • 2.
    This Morning’s SessionReview of Course Outline Review of Course Expectations Review of First Stat’s course Break Introduction to Generalized Linear Techniques Introduction to Regression Break Simple Regression
  • 3.
    Purpose of thecourse To assist you to develop the tools and knowledge on how to: (a) be intelligent consumers of data; (b) be able to run your own analysis; © understand how to interpret data and (d) be able to derive logical inferences based on data
  • 4.
    Focus of theCourse Generalized Least Square techniques Interpretation using SPSS Outputs Knowing SPSS (Statistical Package for the Social Sciences)
  • 5.
    Course Requirements Mid-termexamination Final examination Always have handouts in class Have a calculator Politeness Cooperative ethos Working independently on exams
  • 6.
    Review of FirstStats Course What are the different types of measurement? What is correlational analysis Interpret the following findings:
  • 7.
    Example 1: Ina study that examined the relationship between number of days present in school and students’ sense of belonging among 135 high school students the following Pearson Correlation statistics was obtained: r=.64; p<=.000
  • 8.
    Example 2 Therelationship between time on task and obtaining a grade of C+ or lower was found to be r= -.32; p <= .048 for 50 students in an alternative education program for disruptive students.
  • 9.
    What are generalizedleast square models? Generalized least square models are models that seek to minimize differences between what we observe and what we calculate. These models are able to accomplish this, by fitting the data such that the squared deviations between observed and fitted data are minimized.
  • 10.
    Example Refer toexample on the board-
  • 11.
    Techniques to beStudied Regression (Simple, multiple, hierarchical) Analysis of Variance (one-way) Univariate Analysis of Variance to include Analysis of Covariance Possibly- Chi- Square
  • 12.
    Regression History- inFrance, applied to the study of astronomy- orbits of bodies around the sun (least squares method) Term regression coined in the 19 th C to describe a biological phenomenon- children of exceptional individuals tended to be less intelligent than their parents- Darwin’s cousin Francis Galton- “regression towards mediocrity”. Work later extended by Pearson and Yukle
  • 13.
    Assumptions of RegressionSample must be representative of the population. The dependent variable must be continuous. The independent variables must be linearly related but not strongly The independent variable should be continuous although categorical variables can be used. Values of the independent variables are normally distributed
  • 14.
    The Basic RegressionModel Predicted Y= a+ B1(X1)+ B2(X2)……..error Where B1 represent the impact of X1 on Y a represents the constant or the intercept. Y is our outcome variable X is our independent variable
  • 15.
    What do theterms mean? B is called the slope or the regression coefficient. It is the change in the dependent variable for a unit change in x or the predictor variable
  • 16.
    Example of slopeEducation Income 16 years 20,000 18 years 20, 500 20 years 21,000 22 years 21,500 24 years 22, 000
  • 17.
    Questions that canbe asked in regression What is the impact of the predictor (independent) variables on the outcome (dependent variable)? Is the impact significant? Is the regression model significant? What percent of the variance in the outcome variable is explained by the predictor (s) variable (s).
  • 18.
    Key Terms inSPSS Regression Outputs R Square Adjusted R Square Regression model Standardized Coefficients(Beta) Unstandardized Coefficients (B) Fvalue T value P value