Download to read offline
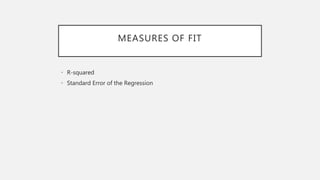


The document discusses model specification for multiple regression analysis, focusing on measures of fit including R-squared and standard error of regression, and how to properly interpret these statistics. It emphasizes the importance of random sampling to establish causal relationships and warns of potential biases from non-random samples, such as when evaluating mutual fund performance or estimating political support based on telephone and automobile owners.