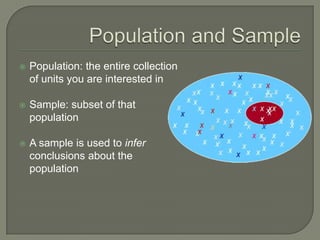
Gillian Byrne
Memorial University of Newfoundland
Research process & definitions
Hypothesis construction
Sampling
Statistical significance
Variables
Descriptive statistics
Popular inferential statistical analyses
 Develop hypotheses
 Identify target population
 Select random sample
 Test hypotheses using statistical analyses
 Determine the likelihood that:
• The performance of the sample group reflects the
population and is not due to sampling error
• The performance of the sample is not due to
chance (statistical significance)
 Population: the entire collection
of units you are interested in
 Sample: subset of that
population
 A sample is used to infer
conclusions about the
population
 A parameter is a characteristic of an
entire population
 A statistic is a characteristic derived
from a sample
 Statistics are used to estimate unknown
parameters
“The average
Canadian uses the
Internet 5 times a
week”
 Descriptive statistics describe the
data
• Example: the average age of librarians in
the study was 44
 Inferential statistics attempts to infer
conclusions to a wider population
• The results of the survey show that
Canadian Librarians are aware of
Evidence-based Practice
“If I sample 4 grapes
and they all taste
good, can I conclude
the bunch of grapes is
good?”
Hypothesis are statements of what you
want to prove (or disprove)
Good Hypotheses are:
• Measurable
• Simple
• Answerable with the research method/data
• Compatible with the “natural order” of the
world
 Measurable?
• 1-5 are measureable if proper definitions are
provided
• 6 is not measureable – “better” librarians?
 Simple?
• Terms like “feel”, “understanding” are ambiguous
• Original #4: Does institution type affect the knowledge
of EBP?
• Rephrase of #4: Does institution type affect librarian’s
score on the EBP Understanding Test?
 Answerable?
• Measuring two distinct things – perception and
performance - with two distinct research methods
(survey and test)
 Scientific method attempts to disprove the null
hypothesis rather than prove the hypothesis.
Why?
Research Question Does institution type affect librarians’ score on the
EBP Understanding Test?
Hypothesis Institution type affects librarians’ score on the EBP
Understanding Test
Null hypothesis Institution type does not affect librarians’ score on the
EBP Understanding Test
 Type I error
• “False positive”; observing a difference when there is not one
 Type II error
• “False negative”; observing no relationship when there is one
 False positives are considered a more serious result, so
the null hypothesis is tested
Random SamplingProbability
Sampling
Stratified Random Sampling
Cluster Sampling
Non-probability
Sampling
Convenience Sampling
Purposive Sampling
 Sampling technique in which every member of
a population has an equal chance to get picked
for the sample
 To obtain a probability sample, the population
must be identifiable
 A probability sampling technique must be used
for inferential statistics
 Random Sampling
• selecting subjects from a population using
unpredictable methods
 Stratified Random Sampling
• Dividing a sample into sub-populations, then randomly
selecting subjects from each sub-population
 Cluster Sampling
• Dividing a population into clusters, then randomly
selecting a sample of these. All observations in the
selected clusters are included in the sample
Sampling Technique?
• Stratified random sampling was used to ensure
that all types of librarians would be represented
Probability Sample?
• It is a random sample of all librarians who belong
to CLA – can’t be generalized to all Canadian
librarians
 Central Limit Theorem:
• states that the larger the sample, the more likely the
distribution of the means will be normal, and therefore
population characteristics can more accurately be
predicted
 No magic number!
 Sample size dictates Confidence Intervals
 Random samples eliminate bias, but they can
still be wrong
 Sampling Variability:
• If you select many different samples from the same
population, a statistic could be different for every
different sample
 Confidence Intervals reflect how confident a
researcher is that the findings are correct and
repeatable
 CI are traditionally set at 95% or 99% (i.e., I’m
95% sure the results are will fall into range X)
 Large CI usually indicate sampling problems
 Lancet Study on Iraqi deaths:
• Used cluster sampling to ascertain the Iraqi death toll
up until 2004 was 654,965 – plus or minus 291,186!
Librarians who have heard of EBP by Institution Type
 If the sample size is 210 people and the margin of error
(CI) is plus or minus 3.1 percentage points, 19 times out
of 20, do more academic librarians know about EBP than
special librarians?
 Statistical significance tells you how unlikely a result
is due to chance – “probably true”
 Significance tests denote how large the possibility is
that you are committing a type I error
More academic librarians
are aware of EBP than
public librarians, but is the
difference in the numbers
real or simply due to
chance?
 Statistical significance is calculated as a p-value
that ranges between 0-1
 .05 is the conventional cut-off point for
significance (p>.05 = significance; p<.05 = not
significant)
 Confidence Intervals vs. Statistical Significance?
 Nominal
• Discrete levels of measurement where a number is arbitrarily
chosen to represent a category
• 1=female; 2=male
• Does this mean that males are twice as big as females?
 Ordinal
• Discrete categories that increase and decrease at regular
intervals.
• Likert Scale (1=disagree; 2=somewhat disagree…)
• Cannot measure in between values
 Ratio (AKA scale/continuous/interval)
• Ratio variables have natural order, and the distance between the
points is the same
• Pounds on a scale (1.0; 1.1; 1.2…)
• The most robust of variable types
 Nominal: TYPE, EBP_AWARE
 Ordinal: INCOME
 Ratio: LENGTH, AGE, EBP_SCORE
 Many statistical analyses are based on the normal distribution
of data
µ = mean
σ = standard
deviation
 To see if data is normally distributed you need to look at
Measures of Central Tendency and Measures of Spread
 Fancy term for Mean, Median & Mode
 Displays how your results are grouped together
Measure Definition Most often used
with...
Mean Average value Ratio variables
Median Halfway point of the data Ordinal variables
Mode Most commonly occurring
value
Nominal variables
 Tell you whether the values are clustered around the
mean or more spread out
Measure Calculated by... Notes
Range Subtracting the lowest score
from the highest score
Easily skewed by
outlier values
Interquartile
Range
Dividing the sample into four
equal quarters. The median is
then calculated for each quartile.
Subtracting the median of the
first quartile from the third
quartile obtains the interquartile
range.
Less likely to become
skewed by outliers
Standard
Deviation
A computer! Can only be used with
Ratio variables
 Measures of Central Tendency?
• In normally distributed data, the Mean, Median & Mode are
the same
• In this case the Mean is higher than the Median and much
higher than the Mode - there are some older respondents
skewing the data
•
 Measures of Spread?
• The range indicates that there are 38 years between oldest
and youngest respondent
• Could be due to the outliers at the upper end of the scale
• The large standard deviation also indicates a wide spread
of values
 Inferential statistical methods analyze the
relationship between two variables
 Methods of analysis depend on the type of
variable (nominal, ordinal, ratio)
“Are you my
mummy?”
 What is a cross tabulation?
• A table in which each cell represents a unique combination
of values. This allows you to visually analyze the data
 When would you use a cross tabulation?
• Normally used to show relationships between two nominal
variables, nominal and ordinal variables, or two ordinal
variables.
 Limitations of the cross tabulation
• Cross tabulations display simple values and percentages;
there is no way to gauge whether any differences in the
distribution are statistically significant.
 What does this table tell us?
• Shows the numbers of librarians who have heard of
the term Evidence-based Practice broken down by
institution type
• There are some differences between the groups; a
smaller percentage of school librarians have heard of
EBP (42.86%, N = 9) than other types of librarians
• There is no indication if that difference is statistically
significant
 What is a chi-square?
• Looks at each cell in a cross tabulation and measures the difference between
what was observed and what would be expected in the general population.
 When would you use a chi-square?
• Chi-square is one of the most important statistics when you are assessing the
relationship between ordinal and/or nominal measures.
 Limitations of the chi-square
• Chi-square cannot be used if any cell has an expected frequency of zero, or a
negative integer. It can be affected by low frequencies in cells; if cells have a
frequency of less than 5, the test might be compromised.
 How do I know if the relationship is statistically significant?
• The chi-square test provides a significance value called a p-value. If α = .05, then
a p score less than .05 indicates statistical significant differences, a p score
greater than .05 means that there is no statistical difference.
Why use a chi-square?
A chi-square is the statistic being used here because the relationship
between two ordinal variables (type of library worked at and awareness of
the term EBP) is being explored.
What does value mean?
It is simply the mathematical calculation of the chi-square. It is used to
then derive the p-value, or significance.
 What does df mean?
• Df =degrees of freedom.
• Df is the number of independent pieces of data being used
to make a calculation.
• Calculated by looking at the cross tabulation and
multiplying the number of rows minus one by the number of
columns minus one (r-1) x (c-1).
 (2-1) x (5-1) = 4
 What does sig. mean?
• Sig. stands for significance level, or p-level. In this case p =
.990. As this number is larger than .05, there is no
statistically significant relationship between type of library
and awareness of EBP
 What is a t-test?
• Compares the means between two values. It tests if any differences in the means
are statistically significant or can be explained by chance.
 When do you use a t-test?
• T-tests are normally used when comparing two groups or in a before and after
situation .
• A t-test involves means, therefore the variable you are attempting to measure must
be a ratio variable. The other variable is nominal or ordinal.
 Limitations of the t-test
• A t-test can only be used to analyze the means of two groups. For more than two
groups, use ANOVA.
 How do I know if the relationship is statistically significant?
• Like the chi-square test, the t-test provides a significance value called a p-value, and is
presented the same way.
Why use a t-test?
•A t-test is used for these variables because we are comparing the
mean of one variable (EPB Test Score, a ratio variable) between 2
groups (sex, a nominal variable).
•An independent samples t-test is used here because the groups
being compared are mutually exclusive - male and female.
 How is the t-test interpreted?
• The t-test value, degrees of freedom, and significance values can
be interpreted in precisely the same way as the chi-square
• The significance value of .049 is less than .05 - it can be stated
that the null hypothesis is disproved; there is a statistical
significant difference between the performance of male librarians
and female librarians on the EBP Perceptions Test.
 What is ANOVA?
• ANOVA compares means between more than two groups
• ANOVA looks at the differences between categories to see if they are
larger or smaller than those within categories.
 When should you use ANOVA?
• One variable in ANOVA must be ratio. The other can be nominal or
ordinal, but must be composed of mutually exclusive groups
 Limitations of ANOVA
• ANOVA measures whether there are significant differences between three
or more groups, but it does not illustrate where the significance lies – there
could be differences between all groups or only two
• post hoc comparison tests can be performed to determine where
significance lies
 How do I know if the relationship is statistically significant?
• An ANOVA uses an f-test to determine if there is a difference between the
means of groups. The f-test can be used to calculate a p-score
 Why was an ANOVA performed?
• One variable (EBP Test score) is ratio, while other (type of library
worked at) is nominal and composed of several mutually
exclusive groups.
 What does this tell us?
• The F test score was calculated at 3.43. The F score is used in
conjunction with the two sets of degrees of freedom to calculate
the p-score.
• P = .245, which is greater than .05. There is no difference in
performance on the test based on the type of library worked at.
 What are correlation coefficients?
• Correlation coefficients measure the strength of association
between two variables, and reveal whether the correlation is
negative or positive
• A negative relationship means that when one variable increases
the other decreases
• A positive relationship means that when one variable increases
so does the other
 When should you use correlation coefficients?
• Correlation coefficients should be used whenever you want to test
the strength of a relationship. There are many tests to measure
correlation:
 Nominal variables: Phi, Cramer’s V, Lambda, Goodman and Kruskal’s
Tau
 Ordinal variables: Gamma, Sommers D, Spearman’s Rho
 Ratio variables: Pearson r
 Limitations of correlation coefficients
• Correlation does not indicate causality
• Only looks at the relationship between two variables; there
many be others affecting the relationship
• Can be skewed by outlier values
 How do I know if the relationship is statistically
significant?
• Correlation scores range from -1 (strong negative
correlation) to 1 (strong positive correlation)
• The closer the figure is to zero, the weaker the
association, regardless whether it is a negative or positive
integer
 Why was a Pearson r correlation performed?
• A Pearson r was done because both variables involved, Age and
EBP Perceptions Test score, are ratio variables.
 What does the r value tell us?
• The r is correlation score.
• A score of +.638 reveals that there is a strong positive correlation
between age and EBP score.
• When one variable increases so does the other – the older the
librarian, the higher they scored on the EBP test instrument.
 Significance tests do not give an
indication of the strength of a
relationship, merely that it exists
 Effect sizes are tests which gauge
the strength of a relationship.
 Some researchers argue effect size
measures are a better indication of
significance “Third cousins twice
removed? Brother
and sister?”
Statistical Test Effect Size Measure Comments
Chi-square phi Phi tests return a value between
zero (no relationship) and one
(perfect relationship).
T-test Cohen’s d Cohen’s d results are interpreted
as 0.2 being a small effect, 0.5 a
medium and 0.8 a large effect
size. (Cohen 157)
ANOVA Eta squared Eta square values range between
zero and one, and can be
interpreted like phi and Cohen’s
d.
 Computers compute statistics - researchers need to
understand:
• The elements of good research design
• How to interpret and critically analyze results
 Suggestions for future investigation
• Practice
 Design hypothetical experiments for everyday
questions, including hypothesis, research method and analyses
• Read
 Critically evaluate the next research article you read
 The Numbers Guy: http://blogs.wsj.com/numbersguy/
 Be sceptical, inquisitive and experimental!
 HyperStat Online Statistics Textbook
http://davidmlane.com/hyperstat/index.html
 Electronic Statistical Textbook
http://www.statsoft.com/textbook/stathome.html
 Selecting Statistics
http://www.socialresearchmethods.net/selstat/ssstart.htm
 Statistics Tutorials (Brown University)
http://dl.lib.brown.edu/gateway/ssds/StatsTut.htm
 Sample Size Calculator
http://www.raosoft.com/samplesize.html

De-Mystifying Stats: A primer on basic statistics

  • 1.
  • 2.
    Research process &definitions Hypothesis construction Sampling Statistical significance Variables Descriptive statistics Popular inferential statistical analyses
  • 3.
     Develop hypotheses Identify target population  Select random sample  Test hypotheses using statistical analyses  Determine the likelihood that: • The performance of the sample group reflects the population and is not due to sampling error • The performance of the sample is not due to chance (statistical significance)
  • 4.
     Population: theentire collection of units you are interested in  Sample: subset of that population  A sample is used to infer conclusions about the population
  • 5.
     A parameteris a characteristic of an entire population  A statistic is a characteristic derived from a sample  Statistics are used to estimate unknown parameters “The average Canadian uses the Internet 5 times a week”
  • 6.
     Descriptive statisticsdescribe the data • Example: the average age of librarians in the study was 44  Inferential statistics attempts to infer conclusions to a wider population • The results of the survey show that Canadian Librarians are aware of Evidence-based Practice “If I sample 4 grapes and they all taste good, can I conclude the bunch of grapes is good?”
  • 7.
    Hypothesis are statementsof what you want to prove (or disprove) Good Hypotheses are: • Measurable • Simple • Answerable with the research method/data • Compatible with the “natural order” of the world
  • 8.
     Measurable? • 1-5are measureable if proper definitions are provided • 6 is not measureable – “better” librarians?
  • 9.
     Simple? • Termslike “feel”, “understanding” are ambiguous • Original #4: Does institution type affect the knowledge of EBP? • Rephrase of #4: Does institution type affect librarian’s score on the EBP Understanding Test?  Answerable? • Measuring two distinct things – perception and performance - with two distinct research methods (survey and test)
  • 10.
     Scientific methodattempts to disprove the null hypothesis rather than prove the hypothesis. Why? Research Question Does institution type affect librarians’ score on the EBP Understanding Test? Hypothesis Institution type affects librarians’ score on the EBP Understanding Test Null hypothesis Institution type does not affect librarians’ score on the EBP Understanding Test
  • 11.
     Type Ierror • “False positive”; observing a difference when there is not one  Type II error • “False negative”; observing no relationship when there is one  False positives are considered a more serious result, so the null hypothesis is tested
  • 12.
    Random SamplingProbability Sampling Stratified RandomSampling Cluster Sampling Non-probability Sampling Convenience Sampling Purposive Sampling
  • 13.
     Sampling techniquein which every member of a population has an equal chance to get picked for the sample  To obtain a probability sample, the population must be identifiable  A probability sampling technique must be used for inferential statistics
  • 14.
     Random Sampling •selecting subjects from a population using unpredictable methods  Stratified Random Sampling • Dividing a sample into sub-populations, then randomly selecting subjects from each sub-population  Cluster Sampling • Dividing a population into clusters, then randomly selecting a sample of these. All observations in the selected clusters are included in the sample
  • 16.
    Sampling Technique? • Stratifiedrandom sampling was used to ensure that all types of librarians would be represented Probability Sample? • It is a random sample of all librarians who belong to CLA – can’t be generalized to all Canadian librarians
  • 17.
     Central LimitTheorem: • states that the larger the sample, the more likely the distribution of the means will be normal, and therefore population characteristics can more accurately be predicted  No magic number!  Sample size dictates Confidence Intervals
  • 18.
     Random sampleseliminate bias, but they can still be wrong  Sampling Variability: • If you select many different samples from the same population, a statistic could be different for every different sample  Confidence Intervals reflect how confident a researcher is that the findings are correct and repeatable
  • 19.
     CI aretraditionally set at 95% or 99% (i.e., I’m 95% sure the results are will fall into range X)  Large CI usually indicate sampling problems  Lancet Study on Iraqi deaths: • Used cluster sampling to ascertain the Iraqi death toll up until 2004 was 654,965 – plus or minus 291,186!
  • 20.
    Librarians who haveheard of EBP by Institution Type  If the sample size is 210 people and the margin of error (CI) is plus or minus 3.1 percentage points, 19 times out of 20, do more academic librarians know about EBP than special librarians?
  • 21.
     Statistical significancetells you how unlikely a result is due to chance – “probably true”  Significance tests denote how large the possibility is that you are committing a type I error More academic librarians are aware of EBP than public librarians, but is the difference in the numbers real or simply due to chance?
  • 22.
     Statistical significanceis calculated as a p-value that ranges between 0-1  .05 is the conventional cut-off point for significance (p>.05 = significance; p<.05 = not significant)  Confidence Intervals vs. Statistical Significance?
  • 23.
     Nominal • Discretelevels of measurement where a number is arbitrarily chosen to represent a category • 1=female; 2=male • Does this mean that males are twice as big as females?  Ordinal • Discrete categories that increase and decrease at regular intervals. • Likert Scale (1=disagree; 2=somewhat disagree…) • Cannot measure in between values  Ratio (AKA scale/continuous/interval) • Ratio variables have natural order, and the distance between the points is the same • Pounds on a scale (1.0; 1.1; 1.2…) • The most robust of variable types
  • 24.
     Nominal: TYPE,EBP_AWARE  Ordinal: INCOME  Ratio: LENGTH, AGE, EBP_SCORE
  • 25.
     Many statisticalanalyses are based on the normal distribution of data µ = mean σ = standard deviation  To see if data is normally distributed you need to look at Measures of Central Tendency and Measures of Spread
  • 26.
     Fancy termfor Mean, Median & Mode  Displays how your results are grouped together Measure Definition Most often used with... Mean Average value Ratio variables Median Halfway point of the data Ordinal variables Mode Most commonly occurring value Nominal variables
  • 27.
     Tell youwhether the values are clustered around the mean or more spread out Measure Calculated by... Notes Range Subtracting the lowest score from the highest score Easily skewed by outlier values Interquartile Range Dividing the sample into four equal quarters. The median is then calculated for each quartile. Subtracting the median of the first quartile from the third quartile obtains the interquartile range. Less likely to become skewed by outliers Standard Deviation A computer! Can only be used with Ratio variables
  • 29.
     Measures ofCentral Tendency? • In normally distributed data, the Mean, Median & Mode are the same • In this case the Mean is higher than the Median and much higher than the Mode - there are some older respondents skewing the data •  Measures of Spread? • The range indicates that there are 38 years between oldest and youngest respondent • Could be due to the outliers at the upper end of the scale • The large standard deviation also indicates a wide spread of values
  • 30.
     Inferential statisticalmethods analyze the relationship between two variables  Methods of analysis depend on the type of variable (nominal, ordinal, ratio) “Are you my mummy?”
  • 31.
     What isa cross tabulation? • A table in which each cell represents a unique combination of values. This allows you to visually analyze the data  When would you use a cross tabulation? • Normally used to show relationships between two nominal variables, nominal and ordinal variables, or two ordinal variables.  Limitations of the cross tabulation • Cross tabulations display simple values and percentages; there is no way to gauge whether any differences in the distribution are statistically significant.
  • 33.
     What doesthis table tell us? • Shows the numbers of librarians who have heard of the term Evidence-based Practice broken down by institution type • There are some differences between the groups; a smaller percentage of school librarians have heard of EBP (42.86%, N = 9) than other types of librarians • There is no indication if that difference is statistically significant
  • 34.
     What isa chi-square? • Looks at each cell in a cross tabulation and measures the difference between what was observed and what would be expected in the general population.  When would you use a chi-square? • Chi-square is one of the most important statistics when you are assessing the relationship between ordinal and/or nominal measures.  Limitations of the chi-square • Chi-square cannot be used if any cell has an expected frequency of zero, or a negative integer. It can be affected by low frequencies in cells; if cells have a frequency of less than 5, the test might be compromised.  How do I know if the relationship is statistically significant? • The chi-square test provides a significance value called a p-value. If α = .05, then a p score less than .05 indicates statistical significant differences, a p score greater than .05 means that there is no statistical difference.
  • 35.
    Why use achi-square? A chi-square is the statistic being used here because the relationship between two ordinal variables (type of library worked at and awareness of the term EBP) is being explored. What does value mean? It is simply the mathematical calculation of the chi-square. It is used to then derive the p-value, or significance.
  • 36.
     What doesdf mean? • Df =degrees of freedom. • Df is the number of independent pieces of data being used to make a calculation. • Calculated by looking at the cross tabulation and multiplying the number of rows minus one by the number of columns minus one (r-1) x (c-1).  (2-1) x (5-1) = 4  What does sig. mean? • Sig. stands for significance level, or p-level. In this case p = .990. As this number is larger than .05, there is no statistically significant relationship between type of library and awareness of EBP
  • 37.
     What isa t-test? • Compares the means between two values. It tests if any differences in the means are statistically significant or can be explained by chance.  When do you use a t-test? • T-tests are normally used when comparing two groups or in a before and after situation . • A t-test involves means, therefore the variable you are attempting to measure must be a ratio variable. The other variable is nominal or ordinal.  Limitations of the t-test • A t-test can only be used to analyze the means of two groups. For more than two groups, use ANOVA.  How do I know if the relationship is statistically significant? • Like the chi-square test, the t-test provides a significance value called a p-value, and is presented the same way.
  • 38.
    Why use at-test? •A t-test is used for these variables because we are comparing the mean of one variable (EPB Test Score, a ratio variable) between 2 groups (sex, a nominal variable). •An independent samples t-test is used here because the groups being compared are mutually exclusive - male and female.
  • 39.
     How isthe t-test interpreted? • The t-test value, degrees of freedom, and significance values can be interpreted in precisely the same way as the chi-square • The significance value of .049 is less than .05 - it can be stated that the null hypothesis is disproved; there is a statistical significant difference between the performance of male librarians and female librarians on the EBP Perceptions Test.
  • 40.
     What isANOVA? • ANOVA compares means between more than two groups • ANOVA looks at the differences between categories to see if they are larger or smaller than those within categories.  When should you use ANOVA? • One variable in ANOVA must be ratio. The other can be nominal or ordinal, but must be composed of mutually exclusive groups  Limitations of ANOVA • ANOVA measures whether there are significant differences between three or more groups, but it does not illustrate where the significance lies – there could be differences between all groups or only two • post hoc comparison tests can be performed to determine where significance lies  How do I know if the relationship is statistically significant? • An ANOVA uses an f-test to determine if there is a difference between the means of groups. The f-test can be used to calculate a p-score
  • 41.
     Why wasan ANOVA performed? • One variable (EBP Test score) is ratio, while other (type of library worked at) is nominal and composed of several mutually exclusive groups.  What does this tell us? • The F test score was calculated at 3.43. The F score is used in conjunction with the two sets of degrees of freedom to calculate the p-score. • P = .245, which is greater than .05. There is no difference in performance on the test based on the type of library worked at.
  • 42.
     What arecorrelation coefficients? • Correlation coefficients measure the strength of association between two variables, and reveal whether the correlation is negative or positive • A negative relationship means that when one variable increases the other decreases • A positive relationship means that when one variable increases so does the other  When should you use correlation coefficients? • Correlation coefficients should be used whenever you want to test the strength of a relationship. There are many tests to measure correlation:  Nominal variables: Phi, Cramer’s V, Lambda, Goodman and Kruskal’s Tau  Ordinal variables: Gamma, Sommers D, Spearman’s Rho  Ratio variables: Pearson r
  • 43.
     Limitations ofcorrelation coefficients • Correlation does not indicate causality • Only looks at the relationship between two variables; there many be others affecting the relationship • Can be skewed by outlier values  How do I know if the relationship is statistically significant? • Correlation scores range from -1 (strong negative correlation) to 1 (strong positive correlation) • The closer the figure is to zero, the weaker the association, regardless whether it is a negative or positive integer
  • 44.
     Why wasa Pearson r correlation performed? • A Pearson r was done because both variables involved, Age and EBP Perceptions Test score, are ratio variables.  What does the r value tell us? • The r is correlation score. • A score of +.638 reveals that there is a strong positive correlation between age and EBP score. • When one variable increases so does the other – the older the librarian, the higher they scored on the EBP test instrument.
  • 45.
     Significance testsdo not give an indication of the strength of a relationship, merely that it exists  Effect sizes are tests which gauge the strength of a relationship.  Some researchers argue effect size measures are a better indication of significance “Third cousins twice removed? Brother and sister?”
  • 46.
    Statistical Test EffectSize Measure Comments Chi-square phi Phi tests return a value between zero (no relationship) and one (perfect relationship). T-test Cohen’s d Cohen’s d results are interpreted as 0.2 being a small effect, 0.5 a medium and 0.8 a large effect size. (Cohen 157) ANOVA Eta squared Eta square values range between zero and one, and can be interpreted like phi and Cohen’s d.
  • 47.
     Computers computestatistics - researchers need to understand: • The elements of good research design • How to interpret and critically analyze results  Suggestions for future investigation • Practice  Design hypothetical experiments for everyday questions, including hypothesis, research method and analyses • Read  Critically evaluate the next research article you read  The Numbers Guy: http://blogs.wsj.com/numbersguy/  Be sceptical, inquisitive and experimental!
  • 48.
     HyperStat OnlineStatistics Textbook http://davidmlane.com/hyperstat/index.html  Electronic Statistical Textbook http://www.statsoft.com/textbook/stathome.html  Selecting Statistics http://www.socialresearchmethods.net/selstat/ssstart.htm  Statistics Tutorials (Brown University) http://dl.lib.brown.edu/gateway/ssds/StatsTut.htm  Sample Size Calculator http://www.raosoft.com/samplesize.html