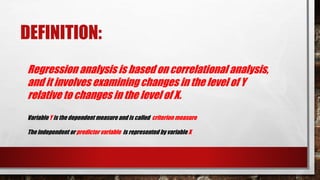
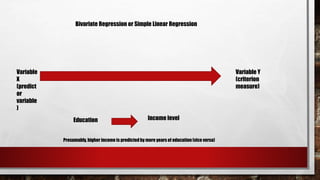
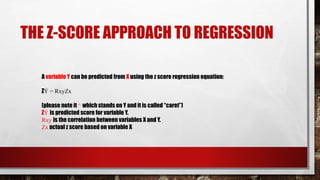
SlideShare a Scribd company logo
WHAT IS IT?
• LINEAR REGRESSION IS INTIMATELY RELATED TO CORRELATION
• IT IS A TECHNIQUE FOR PREDICTING A SCORE ON VARIABLE Y BASED ON WHAT WE KNOW TO BE TRUE
ABOUT THE VALUE OF SOME VARIABLE X.
• UNLESS ONE VARIABLE IS SUBSTANTIALLY CORRELATED WITH THE OTHER, THERE IS NO REASON TO USE
REGRESSION TO PREDICT A SCORE ON Y FROM A SCORE ON X.
EXAMPLES:
If I know that you studied 10 hours (X) for the exam, then, can I predict your
actual score on the exam (Y)?
Regression analysis helps in this regard by essentially searching for a
pattern in the data, usually a scatter plot of points representing hours studied
(x) by exam scores (Y).
It is a statistical technique that seeks to find the best fit for a straight line
projected among a points on the scatter plot.
IMPORTANT!
• CORRELATION = ASSOCIATION • REGRESSION = PREDICTION
SIMPLE LINEAR REGRESSION
• THE MOST BASIC FORM OF REGRESSION ANALYSIS IS CALLED SIMPLE LINEAR OR BIVARIATE (“TWO
VARIABLE”) REGRESSION.
DEFINITION:
Regression analysis is based on correlational analysis,
and it involves examining changes in the level of Y
relative to changes in the level of X.
Variable Y is the dependent measure and is called criterion measure
The independent or predictor variable is represented by variable X
Variable Y
(criterion
measure)
Variable
X
(predict
or
variable
)
Bivariate Regression or Simple Linear Regression
Education Income level
Presumably, higher income is predictedby more years of education (vice versa)
THE Z-SCORE APPROACH TO REGRESSION
A variable Y can be predicted from X using the z score regression equation:
ZÝ = RxyZx
(please note it ^ which stands on Y and it is called “caret”)
ZÝ is predicted score for variable Y.
Rxy is the correlation between variables X and Y.
Zx actual z score based on variable X
IMPORTANCE
Two reasons:
1. When Rxy is positive in value, Zx will be multiplied by a positive number– thus, ZÝ will be positive when Zx is positive and
it will be negative when Zx is negative. [The importance of this characteristic is that when Rxy is positive, then ZÝ will
have the same sign as Zx, so that a high score will covary with high scores and low scores will do so with low scores (see
book 7.1.1). When Rxy is negative, however, the sign of ZÝ will be opposite of Zx; low scores will be associatedwith high
scores and high scores with low scores (see book7.1.1)
2. The second point is when z score equation for regression is that Rxy = ± 1.00, ZÝ will have the same score as Zx. As we
know, of course, such perfectcorrelation is rare in behavioral data. Thus, when Rxy <± 1.00, ZÝ will be closer to 0.0 than
Zx. Any Z score that approaches 0.0 is based on a raw score that is close to a distribution’s mean. When Zx is multiplied by
0.0 and ZÝ becomes equal to 0.0, the mean of the Z distribution.
THE MEAN, Z SCORE AND REGRESSION
When two variables are uncorrelated with one another,
the best predictor of any individual score on one of the
variables is the mean. The mean is the predicted value
of X or Y when the correlation between these variables is
0.
COMPUTATIONAL APPROACHES TO
REGRESSION
Computational equation: Y = a + b (X)
Y is criterion variable
a and b are constants with fixed values
X variable is the predictor variable
This is the formula for a straight line
SLOPE OF LINE
B =
𝐶ℎ𝑎𝑛𝑔𝑒 𝑖𝑛 𝑌
𝐶ℎ𝑎𝑛𝑔𝑒 𝑖𝑛 𝑋
B is called the slope of the line, the purpose of which is to link Y values to X values.
In regression equation, a is called the intercept of the line or y- intercept.
The intercept is the point in a regression of Y or X where the line crosses the Y axis.
60
50
40
30
20
10
0
1 2 3 4 5 6 X
Y
Procra
stinati
on.
score
s
Minutes Spent on Behavioral Task
Fig. 7.1 Procrastination Scores as a Function of time Spent Performing Behavioral Task
(minutes)
Y = 20 + 5
(X)
A REGRESSION LINE
A regression line is a straight line projecting through a given set of
data, one designed to represent the best fitting linear relationship
between variables X and Y.
THE METHOD OF LEAST SQUARES FOR
REGRESSION
When the least squares method is used in the context of regression, the best fitting line
is the one drawn (out of an infinite number of possible lines) so that the sum of the
squared distances between the actual Y values and the predicted Y values is
minimized.
Y actual or observed value of Y
Ý (^) predicted or estimated value for Y
A regression line will minimize the distance between Y and Ý (^)
Sum of squares terms = ∑ (Y-Ý)²
Formula for a straight line =
Ý= a + b (X)
RAW SCORE METHOD FOR REGRESSION
Ý (^) = Ῡ + r (
𝑺𝒚
𝑺𝒙
) (X -X‾)
A rule of thumb for selecting r(Sx/Sy) or r(Sy/Sx) for the raw score regression
formula: The standard deviation for the variable you wish to predict is the
numerator and the standard deviation for the predictor variable is in the
denominator.
RESIDUAL VARIATION AND THE STANDARD
ERROR OF ESTIMATE
• OUR BEST FIT, OR COURSE, DEPENDENT ON HOW WELL PREDICTED VALUES MATCH UP TO ACTUAL VALUES,
OR THE RELATIVE AMOUNT OF ERROR IN OUR REGRESSION ANALYSIS.
• WE CAN CHARACTERIZE THE ACCURACY OF PREDICTION BY CONSIDERING ERROR IN REGRESSION AKIN
TO THE WAY SCORES DEVIATE FROM SOME AVERAGE (MEAN)
RESIDUAL VARIATION
Think about how the observations fall on or near the regression line in the same way that observations
cluster closer or farther away from the mean of a distribution– minor deviation entails low error and a better
fit of the line to the data, greater deviation indicates more error and a poorer fit.
The information leftover from any such deviation– the distance between a predicted and actual Y value– is
called a residual.
Residual variance refers to the variance of the observations around a regression line.
RESIDUAL VARIANCE
Symbol for residual variance:
S² estY =
(𝑌 − Ý)²
𝑁 − 2
It is known as error variance.
And is based on the sum of the squared deviations between the actual Y scores
and the predicted or Ý (^) scores divided by the number of pairs of X and Y
scores minus two (i.e., N – 2).
STANDARD ERROR OF ESTIMATE
The standard error of estimate is a numerical index describing the standard distance
between actual data points and the predicted points on a regression line. The
standard error of estimate characterizes the standard deviation around a regression
line.
It is similar to the standard deviation, as both measures provide a standardized
indication of how close or far away observations lie from a certain point.
Mean- Standard deviation
Regression line – Standard error of estimate
TERMINOLOGIES
• HOMOSCEDASTICITY
• THE VARIABILITY ASSOCIATED WITH ONE
VARIABLE (Y) REMAINS CONSTANT AT ALL OF THE
LEVELS OF THE OTHER VARIABLE (X).
• HETEROSCEDASTICITY
• IT IS THE OPPOSITE OF HOMOSCEDASTICITY. IT
REFERS TO THE CONDITION WHERE (Y)
OBSERVATIONS VARY IN DIFFERING AMOUNTS AT
DIFFERENT LEVELS OF (X)
Y
X
- S est Y
+ S
est Y
Fig. 7.8 Standard Error of Estimate with Assumptions of Homoscedasticityand Normal Distribution
of Y at Every level of X being met.
Approx 68.3%
of Y scores fall
within + S est Y
EXPLAINED AND UNEXPLAINED VARIANCE
SUM OF SQUARES FOR
EXPLAINED VARIANCE IN
(Y)
∑ (Ý - Ῡ) 2
REGRESSION SUM OF
SQUARES
SUM OF SQUARES FOR THE
UNEXPLAINED VARIANCE IN
(Y)
∑ (Y - Ý) 2
ERROR SUM OF SQUARES
∑ (Y - Ῡ) 2
TOTAL SUM OF SQUARES
Total sum of squares = Unexplained variation in Y (i.e., error
sum of squares + Explained variation in Y (i.e., explained sum of
squares)
∑ (Y - Ῡ) 2
= ∑ (Ý - Ῡ) 2
+ ∑ (Y - Ý) 2
OR
SStot = SSunexplained + SSexplained
REGRESSION TOWARD THE MEAN
• REGRESSION TOWARD THE MEAN REFERS TO SITUATIONS WHERE INITIALLY HIGH OR LOW
OBSERVATIONS ARE FOUND TO MOVE CLOSER TO OR “REGRESS TOWARD” THEIR MEAN AFTER
SUBSEQUENT MEASUREMENT.
To begin, we know observations in any distribution tend to cluster around a
mean. If variables X and Y are more or less independent of one another (i.e.,
Rxy ≅ 0.0), then some outlying score on one variable is likely to be
associated with either a high or low score on the other variable (recall the
earlier review of the z score formula for regression). More to the point, though,
if we obtain an extreme score on X, the corresponding Y score is likely to
regress toward the mean of Y. If, however, X and Y are highly correlated with
one another (i.e., Rxy ≅ ±1.00), then an extreme score on X is likely to be
associated with an extreme score on Y, and regression to the mean will
probably not occur. Regression to the mean, then, can explain why an
unexpected or aberrant performance on one exam does mean subsequent
performance will be equally outstanding or disastrous.
Regression toward the mean
Multiple Regression Analysis
Multiple regression is a statistical technique for
exploring the relationship between one dependent
variable (Y) and more than one independent variable
(X1, X2, …, XN).
Multiple Regression equation for two independent variables:
Y = a + b1 (X1) + b2 (X2).
a is the intercept, b1 and b2 are the two slopes
X1 and X2 are the predictor variables
MULTIPLE REGRESSION: IMPORTANCE
Multiple regression is used to learn how well some predictor variables (X)
actually do predict the criterion variable (Y).
Any multiple regression analysis yields what is called a multiple correlation
coefficient, which is symbolized by the letter R (capital) and range in value from
.00 to +1.00. The multiple R, or simply R, indicates the degree of relationship
between a given criterion variable (Y) and a set of predictor variables (X).
As R increases in magnitude, the multiple regression equation is said to perform
a better job of predicting the dependent measure from the independent variables
(read further Dana S Dunn, 2001).
RequiredReadings:
1. Dunn, D. S. 2001.
Statistics and Data
Analysis for the
Behavioural
Sciences.Toronto:
McGraw Hill.
1. Babbie, E. 2007. The
Practiceof Social
Research. Eleventh
Edition. Thomsom:
Wadsworth.
1. Creswell, J. W. 2003.
Research Design:
Qualitative,
Quantitative, and
MixedMethods.
Second Edition.
Thousand Oaks: Sage
Publications.
1. Healey J. F. 2009.
Statistics: A Tool for
Social Research.

More Related Content

What's hot

Simple linear regression and correlation
Simple linear regression and correlationSimple linear regression and correlation
Simple linear regression and correlation
Shakeel Nouman
 
Multiple Regression Analysis (MRA)
Multiple Regression Analysis (MRA)Multiple Regression Analysis (MRA)
Multiple Regression Analysis (MRA)
Naveen Kumar Medapalli
 
Regression analysis.
Regression analysis.Regression analysis.
Regression analysis.
sonia gupta
 
Simple linear regression
Simple linear regressionSimple linear regression
Simple linear regression
Avjinder (Avi) Kaler
 
Simple linear regression (final)
Simple linear regression (final)Simple linear regression (final)
Simple linear regression (final)
Harsh Upadhyay
 
Simple linear regression
Simple linear regressionSimple linear regression
Simple linear regression
RekhaChoudhary24
 
Regression analysis
Regression analysisRegression analysis
Regression analysis
Ravi shankar
 
Regression analysis
Regression analysisRegression analysis
Regression analysis
sayantansarkar50
 
Regression analysis
Regression analysisRegression analysis
Regression analysis
Shameer P Hamsa
 
regression and correlation
regression and correlationregression and correlation
regression and correlation
Priya Sharma
 
Simple Linier Regression
Simple Linier RegressionSimple Linier Regression
Simple Linier Regression
dessybudiyanti
 
Regression analysis
Regression analysisRegression analysis
Regression analysis
University of Jaffna
 
Regression
Regression Regression
Regression
sayantansarkar50
 
Regression analysis by akanksha Bali
Regression analysis by akanksha BaliRegression analysis by akanksha Bali
Regression analysis by akanksha Bali
Akanksha Bali
 
Regression
RegressionRegression
Regression
mandrewmartin
 
Chap11 simple regression
Chap11 simple regressionChap11 simple regression
Chap11 simple regression
Judianto Nugroho
 
Applications of regression analysis - Measurement of validity of relationship
Applications of regression analysis - Measurement of validity of relationshipApplications of regression analysis - Measurement of validity of relationship
Applications of regression analysis - Measurement of validity of relationship
Rithish Kumar
 
Simple lin regress_inference
Simple lin regress_inferenceSimple lin regress_inference
Simple lin regress_inference
Kemal İnciroğlu
 
Regression (Linear Regression and Logistic Regression) by Akanksha Bali
Regression (Linear Regression and Logistic Regression) by Akanksha BaliRegression (Linear Regression and Logistic Regression) by Akanksha Bali
Regression (Linear Regression and Logistic Regression) by Akanksha Bali
Akanksha Bali
 
Introduction to Regression Analysis and R
Introduction to Regression Analysis and R   Introduction to Regression Analysis and R
Introduction to Regression Analysis and R
Rachana Taneja Bhatia
 

What's hot (20)

Simple linear regression and correlation
Simple linear regression and correlationSimple linear regression and correlation
Simple linear regression and correlation
 
Multiple Regression Analysis (MRA)
Multiple Regression Analysis (MRA)Multiple Regression Analysis (MRA)
Multiple Regression Analysis (MRA)
 
Regression analysis.
Regression analysis.Regression analysis.
Regression analysis.
 
Simple linear regression
Simple linear regressionSimple linear regression
Simple linear regression
 
Simple linear regression (final)
Simple linear regression (final)Simple linear regression (final)
Simple linear regression (final)
 
Simple linear regression
Simple linear regressionSimple linear regression
Simple linear regression
 
Regression analysis
Regression analysisRegression analysis
Regression analysis
 
Regression analysis
Regression analysisRegression analysis
Regression analysis
 
Regression analysis
Regression analysisRegression analysis
Regression analysis
 
regression and correlation
regression and correlationregression and correlation
regression and correlation
 
Simple Linier Regression
Simple Linier RegressionSimple Linier Regression
Simple Linier Regression
 
Regression analysis
Regression analysisRegression analysis
Regression analysis
 
Regression
Regression Regression
Regression
 
Regression analysis by akanksha Bali
Regression analysis by akanksha BaliRegression analysis by akanksha Bali
Regression analysis by akanksha Bali
 
Regression
RegressionRegression
Regression
 
Chap11 simple regression
Chap11 simple regressionChap11 simple regression
Chap11 simple regression
 
Applications of regression analysis - Measurement of validity of relationship
Applications of regression analysis - Measurement of validity of relationshipApplications of regression analysis - Measurement of validity of relationship
Applications of regression analysis - Measurement of validity of relationship
 
Simple lin regress_inference
Simple lin regress_inferenceSimple lin regress_inference
Simple lin regress_inference
 
Regression (Linear Regression and Logistic Regression) by Akanksha Bali
Regression (Linear Regression and Logistic Regression) by Akanksha BaliRegression (Linear Regression and Logistic Regression) by Akanksha Bali
Regression (Linear Regression and Logistic Regression) by Akanksha Bali
 
Introduction to Regression Analysis and R
Introduction to Regression Analysis and R   Introduction to Regression Analysis and R
Introduction to Regression Analysis and R
 

Similar to Linear regression

9. parametric regression
9. parametric regression9. parametric regression
9. parametric regression
Lahore Garrison University
 
Regression and Co-Relation
Regression and Co-RelationRegression and Co-Relation
Regression and Co-Relation
nuwan udugampala
 
LINEAR REGRESSION ANALYSIS.pptx
LINEAR REGRESSION ANALYSIS.pptxLINEAR REGRESSION ANALYSIS.pptx
LINEAR REGRESSION ANALYSIS.pptx
sadiakhan783184
 
Correlation and regression
Correlation and regressionCorrelation and regression
Correlation and regression
Antony Raj
 
Regression
RegressionRegression
Regression
Regent University
 
Regression
RegressionRegression
Regression
mandrewmartin
 
Simple linear regression
Simple linear regressionSimple linear regression
Simple linear regression
pankaj8108
 
Correlation and regression
Correlation and regressionCorrelation and regression
Correlation and regression
Antony Raj
 
ML-UNIT-IV complete notes download here
ML-UNIT-IV  complete notes download hereML-UNIT-IV  complete notes download here
ML-UNIT-IV complete notes download here
keerthanakshatriya20
 
2-20-04.ppt
2-20-04.ppt2-20-04.ppt
2-20-04.ppt
ayaan522797
 
Applied statistics part 4
Applied statistics part  4Applied statistics part  4
Statistics
StatisticsStatistics
Statistics
SwathiSundari
 
Statistics
Statistics Statistics
Statistics
Kalaiselviprakash
 
Exploring bivariate data
Exploring bivariate dataExploring bivariate data
Exploring bivariate data
Ulster BOCES
 
FSE 200AdkinsPage 1 of 10Simple Linear Regression Corr.docx
FSE 200AdkinsPage 1 of 10Simple Linear Regression Corr.docxFSE 200AdkinsPage 1 of 10Simple Linear Regression Corr.docx
FSE 200AdkinsPage 1 of 10Simple Linear Regression Corr.docx
budbarber38650
 
Sumit presentation
Sumit presentationSumit presentation
Sumit presentation
Sumit Bharti
 
Corr-and-Regress (1).ppt
Corr-and-Regress (1).pptCorr-and-Regress (1).ppt
Corr-and-Regress (1).ppt
MuhammadAftab89
 
Corr-and-Regress.ppt
Corr-and-Regress.pptCorr-and-Regress.ppt
Corr-and-Regress.ppt
BAGARAGAZAROMUALD2
 
Cr-and-Regress.ppt
Cr-and-Regress.pptCr-and-Regress.ppt
Cr-and-Regress.ppt
RidaIrfan10
 
Correlation & Regression for Statistics Social Science
Correlation & Regression for Statistics Social ScienceCorrelation & Regression for Statistics Social Science
Correlation & Regression for Statistics Social Science
ssuser71ac73
 

Similar to Linear regression (20)

9. parametric regression
9. parametric regression9. parametric regression
9. parametric regression
 
Regression and Co-Relation
Regression and Co-RelationRegression and Co-Relation
Regression and Co-Relation
 
LINEAR REGRESSION ANALYSIS.pptx
LINEAR REGRESSION ANALYSIS.pptxLINEAR REGRESSION ANALYSIS.pptx
LINEAR REGRESSION ANALYSIS.pptx
 
Correlation and regression
Correlation and regressionCorrelation and regression
Correlation and regression
 
Regression
RegressionRegression
Regression
 
Regression
RegressionRegression
Regression
 
Simple linear regression
Simple linear regressionSimple linear regression
Simple linear regression
 
Correlation and regression
Correlation and regressionCorrelation and regression
Correlation and regression
 
ML-UNIT-IV complete notes download here
ML-UNIT-IV  complete notes download hereML-UNIT-IV  complete notes download here
ML-UNIT-IV complete notes download here
 
2-20-04.ppt
2-20-04.ppt2-20-04.ppt
2-20-04.ppt
 
Applied statistics part 4
Applied statistics part  4Applied statistics part  4
Applied statistics part 4
 
Statistics
StatisticsStatistics
Statistics
 
Statistics
Statistics Statistics
Statistics
 
Exploring bivariate data
Exploring bivariate dataExploring bivariate data
Exploring bivariate data
 
FSE 200AdkinsPage 1 of 10Simple Linear Regression Corr.docx
FSE 200AdkinsPage 1 of 10Simple Linear Regression Corr.docxFSE 200AdkinsPage 1 of 10Simple Linear Regression Corr.docx
FSE 200AdkinsPage 1 of 10Simple Linear Regression Corr.docx
 
Sumit presentation
Sumit presentationSumit presentation
Sumit presentation
 
Corr-and-Regress (1).ppt
Corr-and-Regress (1).pptCorr-and-Regress (1).ppt
Corr-and-Regress (1).ppt
 
Corr-and-Regress.ppt
Corr-and-Regress.pptCorr-and-Regress.ppt
Corr-and-Regress.ppt
 
Cr-and-Regress.ppt
Cr-and-Regress.pptCr-and-Regress.ppt
Cr-and-Regress.ppt
 
Correlation & Regression for Statistics Social Science
Correlation & Regression for Statistics Social ScienceCorrelation & Regression for Statistics Social Science
Correlation & Regression for Statistics Social Science
 

More from Regent University

EYEWITNESS TESTIMONY.ppt criminal psychol
EYEWITNESS TESTIMONY.ppt criminal psycholEYEWITNESS TESTIMONY.ppt criminal psychol
EYEWITNESS TESTIMONY.ppt criminal psychol
Regent University
 
Interviewing Suspects in Criminal Cases.ppt
Interviewing Suspects in Criminal Cases.pptInterviewing Suspects in Criminal Cases.ppt
Interviewing Suspects in Criminal Cases.ppt
Regent University
 
DETECTING DECEPTION.ppt psychology crimi
DETECTING DECEPTION.ppt psychology crimiDETECTING DECEPTION.ppt psychology crimi
DETECTING DECEPTION.ppt psychology crimi
Regent University
 
MedicalResearcher.edited.docx in Sweden,
MedicalResearcher.edited.docx in Sweden,MedicalResearcher.edited.docx in Sweden,
MedicalResearcher.edited.docx in Sweden,
Regent University
 
Policing.ppt criminal psychology in introduction
Policing.ppt criminal psychology in introductionPolicing.ppt criminal psychology in introduction
Policing.ppt criminal psychology in introduction
Regent University
 
Offender Profiling and Linking Crime.ppt
Offender Profiling and Linking Crime.pptOffender Profiling and Linking Crime.ppt
Offender Profiling and Linking Crime.ppt
Regent University
 
Definitions and Historical Background.ppt
Definitions and Historical Background.pptDefinitions and Historical Background.ppt
Definitions and Historical Background.ppt
Regent University
 
Zero State Theorem of Medical Science.ppt
Zero State Theorem of Medical Science.pptZero State Theorem of Medical Science.ppt
Zero State Theorem of Medical Science.ppt
Regent University
 
Swedish Prisons Presentation1.ppt
Swedish Prisons Presentation1.pptSwedish Prisons Presentation1.ppt
Swedish Prisons Presentation1.ppt
Regent University
 
What about the 80% (Farmers)
What about the 80% (Farmers)What about the 80% (Farmers)
What about the 80% (Farmers)
Regent University
 
Theorems in Medicine
Theorems in MedicineTheorems in Medicine
Theorems in Medicine
Regent University
 
Three Fundamental Theorems in Medicine
Three Fundamental Theorems in MedicineThree Fundamental Theorems in Medicine
Three Fundamental Theorems in Medicine
Regent University
 
Ancient Egyptians,Ancient Persians
Ancient Egyptians,Ancient Persians Ancient Egyptians,Ancient Persians
Ancient Egyptians,Ancient Persians
Regent University
 
Historical Data on Prof. Desmond Ayim-Aboagye
Historical Data on Prof. Desmond Ayim-AboagyeHistorical Data on Prof. Desmond Ayim-Aboagye
Historical Data on Prof. Desmond Ayim-Aboagye
Regent University
 
Biography of desmond ayim aboagye cur
Biography of desmond ayim aboagye curBiography of desmond ayim aboagye cur
Biography of desmond ayim aboagye cur
Regent University
 
Biography of desmond ayim aboagye
Biography of desmond ayim aboagyeBiography of desmond ayim aboagye
Biography of desmond ayim aboagye
Regent University
 
Biography of desmond ayim aboagye
Biography of desmond ayim aboagyeBiography of desmond ayim aboagye
Biography of desmond ayim aboagye
Regent University
 
Biography of desmond ayim aboagye
Biography of desmond ayim aboagyeBiography of desmond ayim aboagye
Biography of desmond ayim aboagye
Regent University
 
Professor ayim aboagye's profile
Professor ayim aboagye's profileProfessor ayim aboagye's profile
Professor ayim aboagye's profile
Regent University
 
Biography of desmond ayim aboagye
Biography of desmond ayim aboagyeBiography of desmond ayim aboagye
Biography of desmond ayim aboagye
Regent University
 

More from Regent University (20)

EYEWITNESS TESTIMONY.ppt criminal psychol
EYEWITNESS TESTIMONY.ppt criminal psycholEYEWITNESS TESTIMONY.ppt criminal psychol
EYEWITNESS TESTIMONY.ppt criminal psychol
 
Interviewing Suspects in Criminal Cases.ppt
Interviewing Suspects in Criminal Cases.pptInterviewing Suspects in Criminal Cases.ppt
Interviewing Suspects in Criminal Cases.ppt
 
DETECTING DECEPTION.ppt psychology crimi
DETECTING DECEPTION.ppt psychology crimiDETECTING DECEPTION.ppt psychology crimi
DETECTING DECEPTION.ppt psychology crimi
 
MedicalResearcher.edited.docx in Sweden,
MedicalResearcher.edited.docx in Sweden,MedicalResearcher.edited.docx in Sweden,
MedicalResearcher.edited.docx in Sweden,
 
Policing.ppt criminal psychology in introduction
Policing.ppt criminal psychology in introductionPolicing.ppt criminal psychology in introduction
Policing.ppt criminal psychology in introduction
 
Offender Profiling and Linking Crime.ppt
Offender Profiling and Linking Crime.pptOffender Profiling and Linking Crime.ppt
Offender Profiling and Linking Crime.ppt
 
Definitions and Historical Background.ppt
Definitions and Historical Background.pptDefinitions and Historical Background.ppt
Definitions and Historical Background.ppt
 
Zero State Theorem of Medical Science.ppt
Zero State Theorem of Medical Science.pptZero State Theorem of Medical Science.ppt
Zero State Theorem of Medical Science.ppt
 
Swedish Prisons Presentation1.ppt
Swedish Prisons Presentation1.pptSwedish Prisons Presentation1.ppt
Swedish Prisons Presentation1.ppt
 
What about the 80% (Farmers)
What about the 80% (Farmers)What about the 80% (Farmers)
What about the 80% (Farmers)
 
Theorems in Medicine
Theorems in MedicineTheorems in Medicine
Theorems in Medicine
 
Three Fundamental Theorems in Medicine
Three Fundamental Theorems in MedicineThree Fundamental Theorems in Medicine
Three Fundamental Theorems in Medicine
 
Ancient Egyptians,Ancient Persians
Ancient Egyptians,Ancient Persians Ancient Egyptians,Ancient Persians
Ancient Egyptians,Ancient Persians
 
Historical Data on Prof. Desmond Ayim-Aboagye
Historical Data on Prof. Desmond Ayim-AboagyeHistorical Data on Prof. Desmond Ayim-Aboagye
Historical Data on Prof. Desmond Ayim-Aboagye
 
Biography of desmond ayim aboagye cur
Biography of desmond ayim aboagye curBiography of desmond ayim aboagye cur
Biography of desmond ayim aboagye cur
 
Biography of desmond ayim aboagye
Biography of desmond ayim aboagyeBiography of desmond ayim aboagye
Biography of desmond ayim aboagye
 
Biography of desmond ayim aboagye
Biography of desmond ayim aboagyeBiography of desmond ayim aboagye
Biography of desmond ayim aboagye
 
Biography of desmond ayim aboagye
Biography of desmond ayim aboagyeBiography of desmond ayim aboagye
Biography of desmond ayim aboagye
 
Professor ayim aboagye's profile
Professor ayim aboagye's profileProfessor ayim aboagye's profile
Professor ayim aboagye's profile
 
Biography of desmond ayim aboagye
Biography of desmond ayim aboagyeBiography of desmond ayim aboagye
Biography of desmond ayim aboagye
 

Recently uploaded

A Survey of Techniques for Maximizing LLM Performance.pptx
A Survey of Techniques for Maximizing LLM Performance.pptxA Survey of Techniques for Maximizing LLM Performance.pptx
A Survey of Techniques for Maximizing LLM Performance.pptx
thanhdowork
 
A Strategic Approach: GenAI in Education
A Strategic Approach: GenAI in EducationA Strategic Approach: GenAI in Education
A Strategic Approach: GenAI in Education
Peter Windle
 
Pride Month Slides 2024 David Douglas School District
Pride Month Slides 2024 David Douglas School DistrictPride Month Slides 2024 David Douglas School District
Pride Month Slides 2024 David Douglas School District
David Douglas School District
 
DRUGS AND ITS classification slide share
DRUGS AND ITS classification slide shareDRUGS AND ITS classification slide share
DRUGS AND ITS classification slide share
taiba qazi
 
Your Skill Boost Masterclass: Strategies for Effective Upskilling
Your Skill Boost Masterclass: Strategies for Effective UpskillingYour Skill Boost Masterclass: Strategies for Effective Upskilling
Your Skill Boost Masterclass: Strategies for Effective Upskilling
Excellence Foundation for South Sudan
 
Group Presentation 2 Economics.Ariana Buscigliopptx
Group Presentation 2 Economics.Ariana BuscigliopptxGroup Presentation 2 Economics.Ariana Buscigliopptx
Group Presentation 2 Economics.Ariana Buscigliopptx
ArianaBusciglio
 
A Independência da América Espanhola LAPBOOK.pdf
A Independência da América Espanhola LAPBOOK.pdfA Independência da América Espanhola LAPBOOK.pdf
A Independência da América Espanhola LAPBOOK.pdf
Jean Carlos Nunes Paixão
 
The Diamonds of 2023-2024 in the IGRA collection
The Diamonds of 2023-2024 in the IGRA collectionThe Diamonds of 2023-2024 in the IGRA collection
The Diamonds of 2023-2024 in the IGRA collection
Israel Genealogy Research Association
 
Pollock and Snow "DEIA in the Scholarly Landscape, Session One: Setting Expec...
Pollock and Snow "DEIA in the Scholarly Landscape, Session One: Setting Expec...Pollock and Snow "DEIA in the Scholarly Landscape, Session One: Setting Expec...
Pollock and Snow "DEIA in the Scholarly Landscape, Session One: Setting Expec...
National Information Standards Organization (NISO)
 
Chapter 4 - Islamic Financial Institutions in Malaysia.pptx
Chapter 4 - Islamic Financial Institutions in Malaysia.pptxChapter 4 - Islamic Financial Institutions in Malaysia.pptx
Chapter 4 - Islamic Financial Institutions in Malaysia.pptx
Mohd Adib Abd Muin, Senior Lecturer at Universiti Utara Malaysia
 
PCOS corelations and management through Ayurveda.
PCOS corelations and management through Ayurveda.PCOS corelations and management through Ayurveda.
PCOS corelations and management through Ayurveda.
Dr. Shivangi Singh Parihar
 
Film vocab for eal 3 students: Australia the movie
Film vocab for eal 3 students: Australia the movieFilm vocab for eal 3 students: Australia the movie
Film vocab for eal 3 students: Australia the movie
Nicholas Montgomery
 
World environment day ppt For 5 June 2024
World environment day ppt For 5 June 2024World environment day ppt For 5 June 2024
World environment day ppt For 5 June 2024
ak6969907
 
What is the purpose of studying mathematics.pptx
What is the purpose of studying mathematics.pptxWhat is the purpose of studying mathematics.pptx
What is the purpose of studying mathematics.pptx
christianmathematics
 
Liberal Approach to the Study of Indian Politics.pdf
Liberal Approach to the Study of Indian Politics.pdfLiberal Approach to the Study of Indian Politics.pdf
Liberal Approach to the Study of Indian Politics.pdf
WaniBasim
 
Advanced Java[Extra Concepts, Not Difficult].docx
Advanced Java[Extra Concepts, Not Difficult].docxAdvanced Java[Extra Concepts, Not Difficult].docx
Advanced Java[Extra Concepts, Not Difficult].docx
adhitya5119
 
Assignment_4_ArianaBusciglio Marvel(1).docx
Assignment_4_ArianaBusciglio Marvel(1).docxAssignment_4_ArianaBusciglio Marvel(1).docx
Assignment_4_ArianaBusciglio Marvel(1).docx
ArianaBusciglio
 
Top five deadliest dog breeds in America
Top five deadliest dog breeds in AmericaTop five deadliest dog breeds in America
Top five deadliest dog breeds in America
Bisnar Chase Personal Injury Attorneys
 
MATATAG CURRICULUM: ASSESSING THE READINESS OF ELEM. PUBLIC SCHOOL TEACHERS I...
MATATAG CURRICULUM: ASSESSING THE READINESS OF ELEM. PUBLIC SCHOOL TEACHERS I...MATATAG CURRICULUM: ASSESSING THE READINESS OF ELEM. PUBLIC SCHOOL TEACHERS I...
MATATAG CURRICULUM: ASSESSING THE READINESS OF ELEM. PUBLIC SCHOOL TEACHERS I...
NelTorrente
 
How to Add Chatter in the odoo 17 ERP Module
How to Add Chatter in the odoo 17 ERP ModuleHow to Add Chatter in the odoo 17 ERP Module
How to Add Chatter in the odoo 17 ERP Module
Celine George
 

Recently uploaded (20)

A Survey of Techniques for Maximizing LLM Performance.pptx
A Survey of Techniques for Maximizing LLM Performance.pptxA Survey of Techniques for Maximizing LLM Performance.pptx
A Survey of Techniques for Maximizing LLM Performance.pptx
 
A Strategic Approach: GenAI in Education
A Strategic Approach: GenAI in EducationA Strategic Approach: GenAI in Education
A Strategic Approach: GenAI in Education
 
Pride Month Slides 2024 David Douglas School District
Pride Month Slides 2024 David Douglas School DistrictPride Month Slides 2024 David Douglas School District
Pride Month Slides 2024 David Douglas School District
 
DRUGS AND ITS classification slide share
DRUGS AND ITS classification slide shareDRUGS AND ITS classification slide share
DRUGS AND ITS classification slide share
 
Your Skill Boost Masterclass: Strategies for Effective Upskilling
Your Skill Boost Masterclass: Strategies for Effective UpskillingYour Skill Boost Masterclass: Strategies for Effective Upskilling
Your Skill Boost Masterclass: Strategies for Effective Upskilling
 
Group Presentation 2 Economics.Ariana Buscigliopptx
Group Presentation 2 Economics.Ariana BuscigliopptxGroup Presentation 2 Economics.Ariana Buscigliopptx
Group Presentation 2 Economics.Ariana Buscigliopptx
 
A Independência da América Espanhola LAPBOOK.pdf
A Independência da América Espanhola LAPBOOK.pdfA Independência da América Espanhola LAPBOOK.pdf
A Independência da América Espanhola LAPBOOK.pdf
 
The Diamonds of 2023-2024 in the IGRA collection
The Diamonds of 2023-2024 in the IGRA collectionThe Diamonds of 2023-2024 in the IGRA collection
The Diamonds of 2023-2024 in the IGRA collection
 
Pollock and Snow "DEIA in the Scholarly Landscape, Session One: Setting Expec...
Pollock and Snow "DEIA in the Scholarly Landscape, Session One: Setting Expec...Pollock and Snow "DEIA in the Scholarly Landscape, Session One: Setting Expec...
Pollock and Snow "DEIA in the Scholarly Landscape, Session One: Setting Expec...
 
Chapter 4 - Islamic Financial Institutions in Malaysia.pptx
Chapter 4 - Islamic Financial Institutions in Malaysia.pptxChapter 4 - Islamic Financial Institutions in Malaysia.pptx
Chapter 4 - Islamic Financial Institutions in Malaysia.pptx
 
PCOS corelations and management through Ayurveda.
PCOS corelations and management through Ayurveda.PCOS corelations and management through Ayurveda.
PCOS corelations and management through Ayurveda.
 
Film vocab for eal 3 students: Australia the movie
Film vocab for eal 3 students: Australia the movieFilm vocab for eal 3 students: Australia the movie
Film vocab for eal 3 students: Australia the movie
 
World environment day ppt For 5 June 2024
World environment day ppt For 5 June 2024World environment day ppt For 5 June 2024
World environment day ppt For 5 June 2024
 
What is the purpose of studying mathematics.pptx
What is the purpose of studying mathematics.pptxWhat is the purpose of studying mathematics.pptx
What is the purpose of studying mathematics.pptx
 
Liberal Approach to the Study of Indian Politics.pdf
Liberal Approach to the Study of Indian Politics.pdfLiberal Approach to the Study of Indian Politics.pdf
Liberal Approach to the Study of Indian Politics.pdf
 
Advanced Java[Extra Concepts, Not Difficult].docx
Advanced Java[Extra Concepts, Not Difficult].docxAdvanced Java[Extra Concepts, Not Difficult].docx
Advanced Java[Extra Concepts, Not Difficult].docx
 
Assignment_4_ArianaBusciglio Marvel(1).docx
Assignment_4_ArianaBusciglio Marvel(1).docxAssignment_4_ArianaBusciglio Marvel(1).docx
Assignment_4_ArianaBusciglio Marvel(1).docx
 
Top five deadliest dog breeds in America
Top five deadliest dog breeds in AmericaTop five deadliest dog breeds in America
Top five deadliest dog breeds in America
 
MATATAG CURRICULUM: ASSESSING THE READINESS OF ELEM. PUBLIC SCHOOL TEACHERS I...
MATATAG CURRICULUM: ASSESSING THE READINESS OF ELEM. PUBLIC SCHOOL TEACHERS I...MATATAG CURRICULUM: ASSESSING THE READINESS OF ELEM. PUBLIC SCHOOL TEACHERS I...
MATATAG CURRICULUM: ASSESSING THE READINESS OF ELEM. PUBLIC SCHOOL TEACHERS I...
 
How to Add Chatter in the odoo 17 ERP Module
How to Add Chatter in the odoo 17 ERP ModuleHow to Add Chatter in the odoo 17 ERP Module
How to Add Chatter in the odoo 17 ERP Module
 

Linear regression

  • 1.
  • 2. WHAT IS IT? • LINEAR REGRESSION IS INTIMATELY RELATED TO CORRELATION • IT IS A TECHNIQUE FOR PREDICTING A SCORE ON VARIABLE Y BASED ON WHAT WE KNOW TO BE TRUE ABOUT THE VALUE OF SOME VARIABLE X. • UNLESS ONE VARIABLE IS SUBSTANTIALLY CORRELATED WITH THE OTHER, THERE IS NO REASON TO USE REGRESSION TO PREDICT A SCORE ON Y FROM A SCORE ON X.
  • 3. EXAMPLES: If I know that you studied 10 hours (X) for the exam, then, can I predict your actual score on the exam (Y)? Regression analysis helps in this regard by essentially searching for a pattern in the data, usually a scatter plot of points representing hours studied (x) by exam scores (Y). It is a statistical technique that seeks to find the best fit for a straight line projected among a points on the scatter plot.
  • 4. IMPORTANT! • CORRELATION = ASSOCIATION • REGRESSION = PREDICTION
  • 5. SIMPLE LINEAR REGRESSION • THE MOST BASIC FORM OF REGRESSION ANALYSIS IS CALLED SIMPLE LINEAR OR BIVARIATE (“TWO VARIABLE”) REGRESSION.
  • 6. DEFINITION: Regression analysis is based on correlational analysis, and it involves examining changes in the level of Y relative to changes in the level of X. Variable Y is the dependent measure and is called criterion measure The independent or predictor variable is represented by variable X
  • 7. Variable Y (criterion measure) Variable X (predict or variable ) Bivariate Regression or Simple Linear Regression Education Income level Presumably, higher income is predictedby more years of education (vice versa)
  • 8. THE Z-SCORE APPROACH TO REGRESSION A variable Y can be predicted from X using the z score regression equation: ZÝ = RxyZx (please note it ^ which stands on Y and it is called “caret”) ZÝ is predicted score for variable Y. Rxy is the correlation between variables X and Y. Zx actual z score based on variable X
  • 9. IMPORTANCE Two reasons: 1. When Rxy is positive in value, Zx will be multiplied by a positive number– thus, ZÝ will be positive when Zx is positive and it will be negative when Zx is negative. [The importance of this characteristic is that when Rxy is positive, then ZÝ will have the same sign as Zx, so that a high score will covary with high scores and low scores will do so with low scores (see book 7.1.1). When Rxy is negative, however, the sign of ZÝ will be opposite of Zx; low scores will be associatedwith high scores and high scores with low scores (see book7.1.1) 2. The second point is when z score equation for regression is that Rxy = ± 1.00, ZÝ will have the same score as Zx. As we know, of course, such perfectcorrelation is rare in behavioral data. Thus, when Rxy <± 1.00, ZÝ will be closer to 0.0 than Zx. Any Z score that approaches 0.0 is based on a raw score that is close to a distribution’s mean. When Zx is multiplied by 0.0 and ZÝ becomes equal to 0.0, the mean of the Z distribution.
  • 10. THE MEAN, Z SCORE AND REGRESSION When two variables are uncorrelated with one another, the best predictor of any individual score on one of the variables is the mean. The mean is the predicted value of X or Y when the correlation between these variables is 0.
  • 11. COMPUTATIONAL APPROACHES TO REGRESSION Computational equation: Y = a + b (X) Y is criterion variable a and b are constants with fixed values X variable is the predictor variable This is the formula for a straight line
  • 12. SLOPE OF LINE B = 𝐶ℎ𝑎𝑛𝑔𝑒 𝑖𝑛 𝑌 𝐶ℎ𝑎𝑛𝑔𝑒 𝑖𝑛 𝑋 B is called the slope of the line, the purpose of which is to link Y values to X values. In regression equation, a is called the intercept of the line or y- intercept. The intercept is the point in a regression of Y or X where the line crosses the Y axis.
  • 13. 60 50 40 30 20 10 0 1 2 3 4 5 6 X Y Procra stinati on. score s Minutes Spent on Behavioral Task Fig. 7.1 Procrastination Scores as a Function of time Spent Performing Behavioral Task (minutes) Y = 20 + 5 (X)
  • 14. A REGRESSION LINE A regression line is a straight line projecting through a given set of data, one designed to represent the best fitting linear relationship between variables X and Y.
  • 15. THE METHOD OF LEAST SQUARES FOR REGRESSION When the least squares method is used in the context of regression, the best fitting line is the one drawn (out of an infinite number of possible lines) so that the sum of the squared distances between the actual Y values and the predicted Y values is minimized. Y actual or observed value of Y Ý (^) predicted or estimated value for Y A regression line will minimize the distance between Y and Ý (^) Sum of squares terms = ∑ (Y-Ý)² Formula for a straight line = Ý= a + b (X)
  • 16. RAW SCORE METHOD FOR REGRESSION Ý (^) = Ῡ + r ( 𝑺𝒚 𝑺𝒙 ) (X -X‾) A rule of thumb for selecting r(Sx/Sy) or r(Sy/Sx) for the raw score regression formula: The standard deviation for the variable you wish to predict is the numerator and the standard deviation for the predictor variable is in the denominator.
  • 17. RESIDUAL VARIATION AND THE STANDARD ERROR OF ESTIMATE • OUR BEST FIT, OR COURSE, DEPENDENT ON HOW WELL PREDICTED VALUES MATCH UP TO ACTUAL VALUES, OR THE RELATIVE AMOUNT OF ERROR IN OUR REGRESSION ANALYSIS. • WE CAN CHARACTERIZE THE ACCURACY OF PREDICTION BY CONSIDERING ERROR IN REGRESSION AKIN TO THE WAY SCORES DEVIATE FROM SOME AVERAGE (MEAN)
  • 18. RESIDUAL VARIATION Think about how the observations fall on or near the regression line in the same way that observations cluster closer or farther away from the mean of a distribution– minor deviation entails low error and a better fit of the line to the data, greater deviation indicates more error and a poorer fit. The information leftover from any such deviation– the distance between a predicted and actual Y value– is called a residual. Residual variance refers to the variance of the observations around a regression line.
  • 19. RESIDUAL VARIANCE Symbol for residual variance: S² estY = (𝑌 − Ý)² 𝑁 − 2 It is known as error variance. And is based on the sum of the squared deviations between the actual Y scores and the predicted or Ý (^) scores divided by the number of pairs of X and Y scores minus two (i.e., N – 2).
  • 20. STANDARD ERROR OF ESTIMATE The standard error of estimate is a numerical index describing the standard distance between actual data points and the predicted points on a regression line. The standard error of estimate characterizes the standard deviation around a regression line. It is similar to the standard deviation, as both measures provide a standardized indication of how close or far away observations lie from a certain point. Mean- Standard deviation Regression line – Standard error of estimate
  • 21. TERMINOLOGIES • HOMOSCEDASTICITY • THE VARIABILITY ASSOCIATED WITH ONE VARIABLE (Y) REMAINS CONSTANT AT ALL OF THE LEVELS OF THE OTHER VARIABLE (X). • HETEROSCEDASTICITY • IT IS THE OPPOSITE OF HOMOSCEDASTICITY. IT REFERS TO THE CONDITION WHERE (Y) OBSERVATIONS VARY IN DIFFERING AMOUNTS AT DIFFERENT LEVELS OF (X)
  • 22. Y X - S est Y + S est Y Fig. 7.8 Standard Error of Estimate with Assumptions of Homoscedasticityand Normal Distribution of Y at Every level of X being met. Approx 68.3% of Y scores fall within + S est Y
  • 23. EXPLAINED AND UNEXPLAINED VARIANCE SUM OF SQUARES FOR EXPLAINED VARIANCE IN (Y) ∑ (Ý - Ῡ) 2 REGRESSION SUM OF SQUARES SUM OF SQUARES FOR THE UNEXPLAINED VARIANCE IN (Y) ∑ (Y - Ý) 2 ERROR SUM OF SQUARES ∑ (Y - Ῡ) 2 TOTAL SUM OF SQUARES
  • 24. TOTAL SUM OF SQUARES Total sum of squares = Unexplained variation in Y (i.e., error sum of squares + Explained variation in Y (i.e., explained sum of squares) ∑ (Y - Ῡ) 2 = ∑ (Ý - Ῡ) 2 + ∑ (Y - Ý) 2 OR SStot = SSunexplained + SSexplained
  • 25. REGRESSION TOWARD THE MEAN • REGRESSION TOWARD THE MEAN REFERS TO SITUATIONS WHERE INITIALLY HIGH OR LOW OBSERVATIONS ARE FOUND TO MOVE CLOSER TO OR “REGRESS TOWARD” THEIR MEAN AFTER SUBSEQUENT MEASUREMENT.
  • 26. To begin, we know observations in any distribution tend to cluster around a mean. If variables X and Y are more or less independent of one another (i.e., Rxy ≅ 0.0), then some outlying score on one variable is likely to be associated with either a high or low score on the other variable (recall the earlier review of the z score formula for regression). More to the point, though, if we obtain an extreme score on X, the corresponding Y score is likely to regress toward the mean of Y. If, however, X and Y are highly correlated with one another (i.e., Rxy ≅ ±1.00), then an extreme score on X is likely to be associated with an extreme score on Y, and regression to the mean will probably not occur. Regression to the mean, then, can explain why an unexpected or aberrant performance on one exam does mean subsequent performance will be equally outstanding or disastrous. Regression toward the mean
  • 27. Multiple Regression Analysis Multiple regression is a statistical technique for exploring the relationship between one dependent variable (Y) and more than one independent variable (X1, X2, …, XN). Multiple Regression equation for two independent variables: Y = a + b1 (X1) + b2 (X2). a is the intercept, b1 and b2 are the two slopes X1 and X2 are the predictor variables
  • 28. MULTIPLE REGRESSION: IMPORTANCE Multiple regression is used to learn how well some predictor variables (X) actually do predict the criterion variable (Y). Any multiple regression analysis yields what is called a multiple correlation coefficient, which is symbolized by the letter R (capital) and range in value from .00 to +1.00. The multiple R, or simply R, indicates the degree of relationship between a given criterion variable (Y) and a set of predictor variables (X). As R increases in magnitude, the multiple regression equation is said to perform a better job of predicting the dependent measure from the independent variables (read further Dana S Dunn, 2001).
  • 29. RequiredReadings: 1. Dunn, D. S. 2001. Statistics and Data Analysis for the Behavioural Sciences.Toronto: McGraw Hill. 1. Babbie, E. 2007. The Practiceof Social Research. Eleventh Edition. Thomsom: Wadsworth. 1. Creswell, J. W. 2003. Research Design: Qualitative, Quantitative, and MixedMethods. Second Edition. Thousand Oaks: Sage Publications. 1. Healey J. F. 2009. Statistics: A Tool for Social Research.