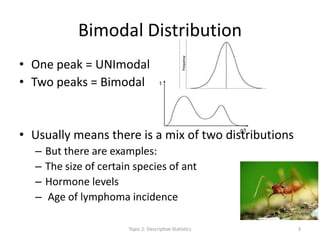
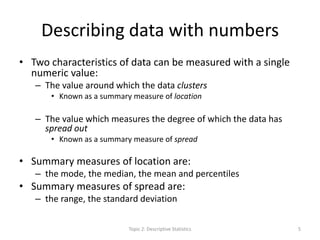
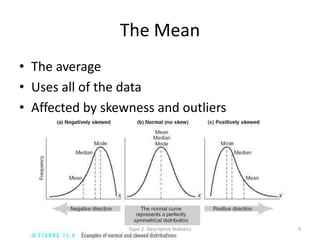
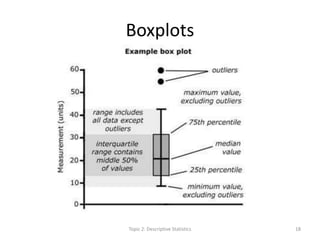
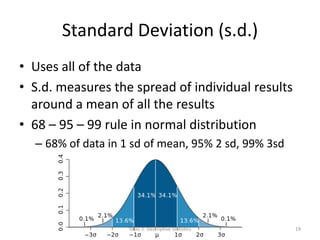
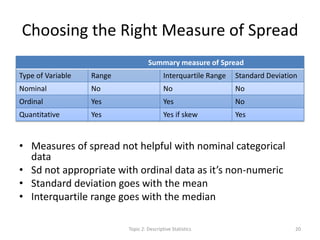
Topic 2
Descriptive Statistics Continued
Dr Luke Kane
April 2014
Topic 2: Descriptive Statistics 1
Outline
• Descriptive Statistics – continued!
• Recap of BIMODAL Distribution (as requested)
– Numerical descriptions of data
– Transformation
– Prevalence and Incidence
Topic 2: Descriptive Statistics 2
Bimodal Distribution
Topic 2: Descriptive Statistics 3
• One peak = UNImodal
• Two peaks = Bimodal
• Usually means there is a mix of two distributions
– But there are examples:
– The size of certain species of ant
– Hormone levels
– Age of lymphoma incidence
Objectives
• Understand numerical ways of describing data
– Including:
• Median, mode, mean
• Range, interquartile range, standard deviation
• Have a vague understanding of transformation
• Calculate prevalence and incidence
Topic 2: Descriptive Statistics 4
Describing data with numbers
• Two characteristics of data can be measured with a single
numeric value:
– The value around which the data clusters
• Known as a summary measure of location
– The value which measures the degree of which the data has
spread out
• Known as a summary measure of spread
• Summary measures of location are:
– the mode, the median, the mean and percentiles
• Summary measures of spread are:
– the range, the standard deviation
Topic 2: Descriptive Statistics 5
Summary Measures of Location
• The value around which most of the data falls
• Median, mode, mean
• Which one you choose depends on type of
variable
Topic 2: Descriptive Statistics 6
The Mode: Common-ness
• The value which has the highest frequency
– i.e. occurs the most often
• A measure of common-ness
Weight of pigs at market / kg Number of pigs (Frequency) n =21
≤110 1
111-130 2
131-150 3
151 - 170 3
171- 190 7
191-210 6
≥211 1Topic 2: Descriptive Statistics 7
The Median: Central-ness
• A measure of central-ness
• Arrange all values in size, median is middle
• Half less than, half more than
• If two median numbers, average them
Topic 2: Descriptive Statistics 8
The Mean
• The average
• Uses all of the data
• Affected by skewness and outliers
Topic 2: Descriptive Statistics 9
N-Tiles
• n-tiles are percentiles, deciles and quintiles
• A way of dividing data into equal groups
• Percentiles (1%) divide the data into 100
• Deciles (10%) into 10
• Quintiles (20%) into 5
Topic 2: Descriptive Statistics 10
Choosing the Right Measure of
Location
Summary measure of location
Type of Variable Mode Median Mean
Nominal Yes No No
Ordinal Yes Yes No
Quant discrete Yes Yes – if skew Yes
Quant continuous No Yes – if skew Yes
• Mode is not suited to quantitative continuous as there may
only be one value
• Median not suited to categorical nominal as there is no
order to the values
• You cannot average categorical data as it’s not made up of
real numbers
Topic 2: Descriptive Statistics 11
Summary Measures of Spread
• Range, interquartile range, standard deviation
• Range
– Distance from smallest value to largest
• Interquartile range
– The range of the middle 50% of the data
• Standard deviation
– Mean distance of all data from overall mean
Topic 2: Descriptive Statistics 12
Range
Topic 2: Descriptive Statistics 13
Poem – to help you remember!
Topic 2: Descriptive Statistics 14
Interquartile Range
• Range is very sensitive
to outliers
• Chop off top 25% and
bottom 25%
– This is the interquartile
range
• Ignores 50% of the
data…
• Can use an ogive…
Topic 2: Descriptive Statistics 15
IQR and an Ogive
Topic 2: Descriptive Statistics 16
An extra chart - Boxplots
• Now we know
about quartiles
• Before we talk
about standard
deviation…
• Boxplots provide a
graphical summary
of quartile values,
minimum and
maximum values
and outliers
Topic 2: Descriptive Statistics 17
Boxplots
Topic 2: Descriptive Statistics 18
Standard Deviation (s.d.)
• Uses all of the data
• S.d. measures the spread of individual results
around a mean of all the results
• 68 – 95 – 99 rule in normal distribution
– 68% of data in 1 sd of mean, 95% 2 sd, 99% 3sd
Topic 2: Descriptive Statistics 19
Choosing the Right Measure of Spread
Summary measure of Spread
Type of Variable Range Interquartile Range Standard Deviation
Nominal No No No
Ordinal Yes Yes No
Quantitative Yes Yes if skew Yes
• Measures of spread not helpful with nominal categorical
data
• Sd not appropriate with ordinal data as it’s non-numeric
• Standard deviation goes with the mean
• Interquartile range goes with the median
Topic 2: Descriptive Statistics 20
Transformation
• Normal distribution looks nice
– BUT not all data is normally distributed
– Real world is more complicated!
• You can transform data to make it more
normal
• For example, take the log of the data
Topic 2: Descriptive Statistics 21
Prevalence and Incidence
• Prevalence is number of cases at a certain
time and place
• Incidence is the number of new cases at a
certain time and place
• What do we mean by certain time and place?
Topic 2: Descriptive Statistics 22
Time & Place
• You must always define the time period
• You must always define the place
– place = specific population
– Time = specific period of time
• …Cambodian population in 2014
• …Plantation workers in Mondulkiri in June-August 2013
• …Irish immigrants in America 1850-1950
Topic 2: Descriptive Statistics 23
Prevalence
• Amount of disease in a specific population at a
particular time
• Prevalence is the probability that any one
individual in the population has the disease
– E.g. 65 cases of a rash in a population of 598
• 65/598 = 10.9%
Topic 2: Descriptive Statistics 24
Incidence
• New cases
– Can think of it as the RISK of getting a disease during a
specific time
= new cases/initial population of disease free
– Can be risk of death, risk of disease, risk of
transmitting a disease, could even be RISK of winning
a lottery
• What is the incidence of malaria if there were
176 new cases in a healthy population of 9888 in
2003
– 176/9888 = 1.78%, i.e. Risk of malaria is nearly 2%
Topic 2: Descriptive Statistics 25
Incidence & Prevalence
• Incidence and prevalence are usually
expressed as a %
• You can also express them as per 1000
population, as per 10,000 population or per
100,000 population
• Don’t get mixed up!
Topic 2: Descriptive Statistics 26
Incidence – TB in SE Asia
• Here is a real example of incidence:
– This is the incidence of TB per 100,000 in SE Asia
2009-2013  I.e. NEW cases
Country TB Incidence
Cambodia 411
Laos 204
Vietnam 147
Thailand 119
Country TB Incidence
South
Africa
1003
Sweden 7Topic 2: Descriptive Statistics 27
Data from World Bank, 2014.
http://data.worldbank.org/indicat
or/SH.TBS.INCD
Prevalence & Incidence: Example
• Calculate the proportion of women infected
with HIV at each clinic:
• Is this prevalence or incidence?
Clinic Antenatal Clinic women seen in Oct 2013 HIV infected
Phnom Penh 412 5
Battambang 179 3
Siem Reap 264 2
1.21%
1.68%
0.76%
Topic 2: Descriptive Statistics 28
Summary
• Numerical descriptions of data
– Summary measures of location:
• Median
• Mode
• Mean
• N-tiles
– Summary measures of location
• Range
• Interquartile range
• Standard deviation
• Prevalence and Incidence
• Transformation
Topic 2: Descriptive Statistics 29
Questions?
Thank You!
Next lesson:
How do we get the data?
Study design, sampling etc.
Probability risks odds
Topic 2: Descriptive Statistics 30
References
• Bowers, D. (2008) Medical Statistics from Scratch: An
Introduction for Health Professionals. USA: Wiley-
Interscience.
• Grant, A. (2014) “Epidemiology for tropical doctors”.
Lecture (S6) from the Diploma of Tropical Medicine &
Hygiene, London School of Hygiene & Tropical
Medicine.
• Greenhalgh, T. (1997) “How to read a paper” British
Medical Journal. Web, accessed April-May 2014 at
<http://www.bmj.com/about-bmj/resources-
readers/publications/how-read-paper>
Topic 2: Descriptive Statistics 31

Statistics for the Health Scientist: Basic Statistics II

  • 1.
    Topic 2 Descriptive StatisticsContinued Dr Luke Kane April 2014 Topic 2: Descriptive Statistics 1
  • 2.
    Outline • Descriptive Statistics– continued! • Recap of BIMODAL Distribution (as requested) – Numerical descriptions of data – Transformation – Prevalence and Incidence Topic 2: Descriptive Statistics 2
  • 3.
    Bimodal Distribution Topic 2:Descriptive Statistics 3 • One peak = UNImodal • Two peaks = Bimodal • Usually means there is a mix of two distributions – But there are examples: – The size of certain species of ant – Hormone levels – Age of lymphoma incidence
  • 4.
    Objectives • Understand numericalways of describing data – Including: • Median, mode, mean • Range, interquartile range, standard deviation • Have a vague understanding of transformation • Calculate prevalence and incidence Topic 2: Descriptive Statistics 4
  • 5.
    Describing data withnumbers • Two characteristics of data can be measured with a single numeric value: – The value around which the data clusters • Known as a summary measure of location – The value which measures the degree of which the data has spread out • Known as a summary measure of spread • Summary measures of location are: – the mode, the median, the mean and percentiles • Summary measures of spread are: – the range, the standard deviation Topic 2: Descriptive Statistics 5
  • 6.
    Summary Measures ofLocation • The value around which most of the data falls • Median, mode, mean • Which one you choose depends on type of variable Topic 2: Descriptive Statistics 6
  • 7.
    The Mode: Common-ness •The value which has the highest frequency – i.e. occurs the most often • A measure of common-ness Weight of pigs at market / kg Number of pigs (Frequency) n =21 ≤110 1 111-130 2 131-150 3 151 - 170 3 171- 190 7 191-210 6 ≥211 1Topic 2: Descriptive Statistics 7
  • 8.
    The Median: Central-ness •A measure of central-ness • Arrange all values in size, median is middle • Half less than, half more than • If two median numbers, average them Topic 2: Descriptive Statistics 8
  • 9.
    The Mean • Theaverage • Uses all of the data • Affected by skewness and outliers Topic 2: Descriptive Statistics 9
  • 10.
    N-Tiles • n-tiles arepercentiles, deciles and quintiles • A way of dividing data into equal groups • Percentiles (1%) divide the data into 100 • Deciles (10%) into 10 • Quintiles (20%) into 5 Topic 2: Descriptive Statistics 10
  • 11.
    Choosing the RightMeasure of Location Summary measure of location Type of Variable Mode Median Mean Nominal Yes No No Ordinal Yes Yes No Quant discrete Yes Yes – if skew Yes Quant continuous No Yes – if skew Yes • Mode is not suited to quantitative continuous as there may only be one value • Median not suited to categorical nominal as there is no order to the values • You cannot average categorical data as it’s not made up of real numbers Topic 2: Descriptive Statistics 11
  • 12.
    Summary Measures ofSpread • Range, interquartile range, standard deviation • Range – Distance from smallest value to largest • Interquartile range – The range of the middle 50% of the data • Standard deviation – Mean distance of all data from overall mean Topic 2: Descriptive Statistics 12
  • 13.
  • 14.
    Poem – tohelp you remember! Topic 2: Descriptive Statistics 14
  • 15.
    Interquartile Range • Rangeis very sensitive to outliers • Chop off top 25% and bottom 25% – This is the interquartile range • Ignores 50% of the data… • Can use an ogive… Topic 2: Descriptive Statistics 15
  • 16.
    IQR and anOgive Topic 2: Descriptive Statistics 16
  • 17.
    An extra chart- Boxplots • Now we know about quartiles • Before we talk about standard deviation… • Boxplots provide a graphical summary of quartile values, minimum and maximum values and outliers Topic 2: Descriptive Statistics 17
  • 18.
  • 19.
    Standard Deviation (s.d.) •Uses all of the data • S.d. measures the spread of individual results around a mean of all the results • 68 – 95 – 99 rule in normal distribution – 68% of data in 1 sd of mean, 95% 2 sd, 99% 3sd Topic 2: Descriptive Statistics 19
  • 20.
    Choosing the RightMeasure of Spread Summary measure of Spread Type of Variable Range Interquartile Range Standard Deviation Nominal No No No Ordinal Yes Yes No Quantitative Yes Yes if skew Yes • Measures of spread not helpful with nominal categorical data • Sd not appropriate with ordinal data as it’s non-numeric • Standard deviation goes with the mean • Interquartile range goes with the median Topic 2: Descriptive Statistics 20
  • 21.
    Transformation • Normal distributionlooks nice – BUT not all data is normally distributed – Real world is more complicated! • You can transform data to make it more normal • For example, take the log of the data Topic 2: Descriptive Statistics 21
  • 22.
    Prevalence and Incidence •Prevalence is number of cases at a certain time and place • Incidence is the number of new cases at a certain time and place • What do we mean by certain time and place? Topic 2: Descriptive Statistics 22
  • 23.
    Time & Place •You must always define the time period • You must always define the place – place = specific population – Time = specific period of time • …Cambodian population in 2014 • …Plantation workers in Mondulkiri in June-August 2013 • …Irish immigrants in America 1850-1950 Topic 2: Descriptive Statistics 23
  • 24.
    Prevalence • Amount ofdisease in a specific population at a particular time • Prevalence is the probability that any one individual in the population has the disease – E.g. 65 cases of a rash in a population of 598 • 65/598 = 10.9% Topic 2: Descriptive Statistics 24
  • 25.
    Incidence • New cases –Can think of it as the RISK of getting a disease during a specific time = new cases/initial population of disease free – Can be risk of death, risk of disease, risk of transmitting a disease, could even be RISK of winning a lottery • What is the incidence of malaria if there were 176 new cases in a healthy population of 9888 in 2003 – 176/9888 = 1.78%, i.e. Risk of malaria is nearly 2% Topic 2: Descriptive Statistics 25
  • 26.
    Incidence & Prevalence •Incidence and prevalence are usually expressed as a % • You can also express them as per 1000 population, as per 10,000 population or per 100,000 population • Don’t get mixed up! Topic 2: Descriptive Statistics 26
  • 27.
    Incidence – TBin SE Asia • Here is a real example of incidence: – This is the incidence of TB per 100,000 in SE Asia 2009-2013  I.e. NEW cases Country TB Incidence Cambodia 411 Laos 204 Vietnam 147 Thailand 119 Country TB Incidence South Africa 1003 Sweden 7Topic 2: Descriptive Statistics 27 Data from World Bank, 2014. http://data.worldbank.org/indicat or/SH.TBS.INCD
  • 28.
    Prevalence & Incidence:Example • Calculate the proportion of women infected with HIV at each clinic: • Is this prevalence or incidence? Clinic Antenatal Clinic women seen in Oct 2013 HIV infected Phnom Penh 412 5 Battambang 179 3 Siem Reap 264 2 1.21% 1.68% 0.76% Topic 2: Descriptive Statistics 28
  • 29.
    Summary • Numerical descriptionsof data – Summary measures of location: • Median • Mode • Mean • N-tiles – Summary measures of location • Range • Interquartile range • Standard deviation • Prevalence and Incidence • Transformation Topic 2: Descriptive Statistics 29
  • 30.
    Questions? Thank You! Next lesson: Howdo we get the data? Study design, sampling etc. Probability risks odds Topic 2: Descriptive Statistics 30
  • 31.
    References • Bowers, D.(2008) Medical Statistics from Scratch: An Introduction for Health Professionals. USA: Wiley- Interscience. • Grant, A. (2014) “Epidemiology for tropical doctors”. Lecture (S6) from the Diploma of Tropical Medicine & Hygiene, London School of Hygiene & Tropical Medicine. • Greenhalgh, T. (1997) “How to read a paper” British Medical Journal. Web, accessed April-May 2014 at <http://www.bmj.com/about-bmj/resources- readers/publications/how-read-paper> Topic 2: Descriptive Statistics 31

Editor's Notes

  • #8 Bad: if the data is continuous there may not be any values that are the same. There may also be more than one mode.
  • #9 Median is good as not affected much by skewness
  • #12 Ordinal – agree, disagree
  • #20 Use excel!68% lie within 1 SD95% lie within 2 SD99% within 3 SD
  • #21 Ordinal – agree, disagree