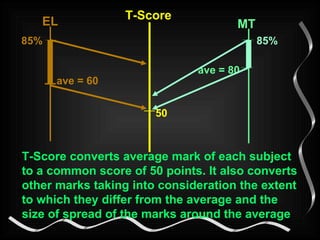
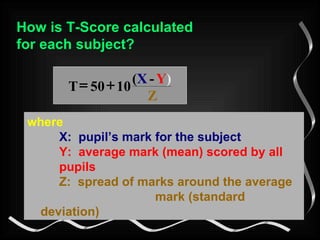
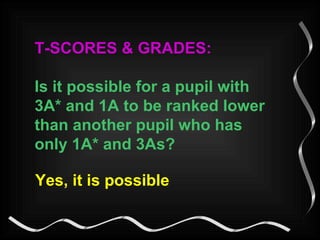
The document explains what a PSLE T-score is. It summarizes that a T-score standardizes raw exam scores across subjects by accounting for average score and standard deviation. It is calculated using a formula that sets the average score to 50 and compares individual scores to the average. The T-scores from each subject are added to calculate an aggregate score used to rank students. While grades are A* to F, a student with 3A* and 1A could be ranked lower than one with 1A* and 3As based on their total T-score aggregate.
Here is a simplified version of Item Analysis for Educational Assessments. Covered here are terminologies, formulas, and processes in conducting Item Discrimination and Difficulty. Thank you. Namaste!
This is my report in my Assessment II subject. I am assigned to discuss on how to interpret test scores by standard deviation unit, Z-score, T-score, Stanine, Deviation IQ and NCE.
Methods of Interpreting Test Scores
Interpretation of test Scores
Referencing Framework
Percentage
Standard deviation
Ranking
Frequency Distribution
Pictoral Form
Approximately half (51%) of the students scored a Satisfactory Level of Performance or
better (grade C or better). This is up from the 47% in 2013 who scored a Satisfactory Level
of Performance or better. As in 2013, the mean score is in the adequate range at 58.4
which is slightly higher than 2013 when it was 57.8. The Mode Grade of C indicates that
most students (27%) scored between 60-69, a Satisfactory Level of Performance, and this
is one grade higher than last year when the Mode Grade was D. The median score is 60;
therefore, half the number of scores were below and half above 60. This is slightly higher
than last year when it was 58.
LifeCollege Information Bulletin for School Year 2015-2016. This serves as a guide for our parent-partners about the school's vision, mission, teaching-learning principles, academic, and non-academic policies.
1 Trevor Rolfe is a 16-year-old sopho.docxjoyjonna282
1
Trevor Rolfe is a 16-year-old sophomore student who attends Clay Local High
School. Trevor has severe hearing loss, but uses hearing aids. His parents taught him sign
language at a young age. Trevor also has 4/20 vision, but it is corrected when he is
wearing glasses. Trevor has dyslexia, a minor learning disability, which inhibits him from
completing the curriculum on his own, unlike his nondisabled peers. He is in an all-
inclusive classroom but because of his dyslexia he has an aid, which reads to him because
he mixes up his letters and words, numbers, and signs.
When Trevor was about four months old, his parents noticed that he did not
respond to them when they walked in the room. He was not startled by loud noises and
did not seem to recognize when little things happened around him. Trevor’s parents took
him to a hearing specialist to discover what was wrong with him. Trevor was identified
with vision loss at age two. When watching TV, he had to sit really close to the television
and had trouble playing with different toys. He often forgot where he put things because
he could not see them. They went to an eye specialist and they tested him with the
2
clinical low-vision assessment, which recommended that would benefit from optical
lenses.
Trevor says he wants to follow in his father’s footsteps and become the
Technology Coordinator at Clay High. Trevor took the OAA in 8
th
grade and got a
proficient in Reading scoring a 402 and a proficient (but low) Math score of 400. Since
he is in 10
th
grade, he will be given a Career Assessment along with an Interest Survey
administered by Career Specialists to determine what he is interested in. These tests will
help Trevor’s parents and educators make appropriate decisions when planning his
postsecondary education. Trevor will also take the OGT, or the Ohio Graduation Test, at
the end of his sophomore year so he can graduate and attend college. Trevor will take the
ACT when he is a junior in hope to receive a composite score of 21.
While Trevor suffers from some impairments, he does well in school. Trevor’s
favorite subject is Math, but it does not come easy to him. Because of his dyslexia, he
struggles with mixing up numbers and letters, making it hard for him to correctly copy
down problems and formulas. This is especially challenging for him in Geometry because
there are so many formulas that he has to memorize. He has no trouble memorizing the
formulas, but when he tries to write them down he gets mixed up. However, he loves
solving equations and is able to answer some upper level math problems.
Trevor’s other main weakness is reading because of his dyslexia. He struggles
with reading and writing. Trevor mixes up words and spells some things backwards
making his work similar to cracking a code. However, he is determined to increase his
reading level and works very hard to improve.
The KWL-IG ...
Welcome to TechSoup New Member Orientation and Q&A (May 2024).pdfTechSoup
In this webinar you will learn how your organization can access TechSoup's wide variety of product discount and donation programs. From hardware to software, we'll give you a tour of the tools available to help your nonprofit with productivity, collaboration, financial management, donor tracking, security, and more.
Read| The latest issue of The Challenger is here! We are thrilled to announce that our school paper has qualified for the NATIONAL SCHOOLS PRESS CONFERENCE (NSPC) 2024. Thank you for your unwavering support and trust. Dive into the stories that made us stand out!
Biological screening of herbal drugs: Introduction and Need for
Phyto-Pharmacological Screening, New Strategies for evaluating
Natural Products, In vitro evaluation techniques for Antioxidants, Antimicrobial and Anticancer drugs. In vivo evaluation techniques
for Anti-inflammatory, Antiulcer, Anticancer, Wound healing, Antidiabetic, Hepatoprotective, Cardio protective, Diuretics and
Antifertility, Toxicity studies as per OECD guidelines
Palestine last event orientationfvgnh .pptxRaedMohamed3
An EFL lesson about the current events in Palestine. It is intended to be for intermediate students who wish to increase their listening skills through a short lesson in power point.
How to Make a Field invisible in Odoo 17Celine George
It is possible to hide or invisible some fields in odoo. Commonly using “invisible” attribute in the field definition to invisible the fields. This slide will show how to make a field invisible in odoo 17.
Model Attribute Check Company Auto PropertyCeline George
In Odoo, the multi-company feature allows you to manage multiple companies within a single Odoo database instance. Each company can have its own configurations while still sharing common resources such as products, customers, and suppliers.
Francesca Gottschalk - How can education support child empowerment.pptxEduSkills OECD
Francesca Gottschalk from the OECD’s Centre for Educational Research and Innovation presents at the Ask an Expert Webinar: How can education support child empowerment?
9. DOLLY I scored 85% in both English and Mother Tongue ! H U R R A Y !
10.
11. A need for standardisation of the raw scores Transformed Score or T-Score
12. T-Score MT T-Score converts average mark of each subject to a common score of 50 points. It also converts other marks taking into consideration the extent to which they differ from the average and the size of spread of the marks around the average ave = 60 EL ave = 80 50 85% 85%
13.
14. How is T-Score calculated for each subject? where X: pupil’s mark for the subject Y: average mark (mean) scored by all pupils Z: spread of marks around the average mark (standard deviation) Z Y ) - ( X 10 50 T
15.
16. How is the Aggregate Score calculated? By adding the T-Scores of the 4 subjects
My presentation will focus on: Placement: there is a need to inform pupils what is in store for them in their next lap of education careers. And How this is met through the use of PSLE aggregates Whose building blocks are the T-scores . Just what are this PSLE aggregates and T-scores: I will elaborate on this and the mechanic of their computation as we proceed.t Last but not least, I will illustrate with example on the relationship between grades and T-scores.
T
Basic consideration in the derivation of the aggregate: Must do JUSTICE to the pupils, the aggregate must incorporate the performance of the pupils in their four main areas of studies. Ranking to to into consideration, the relative standing (worth) of pupils in the respective subjects.
Elaborate on SPREAD: As how ell the pupils’ performance are spread across the possible mark range. In some sense, spread denotes how precise a given test (as an instrument) Proceed s to the next slide to illustrate the concept of SPREAD as Precision of instrument.. The extent to which the test is ble to distinguish the performance of the pupils.
Illustrate the concept of SPREAD as Precision of instrument.. The extent to which the test is able to distinguish the performance of the pupils.: by pointing to the way the (size/strength) of the given animals.
Pinpoint in the order of the slide how as more information on the performance are revealed, the relative standing of Dolly’s in MT differ starkly from that of her EL.
The previous slide showed that different subjects appeared to have different standard and thus there is a need to standardise the marks before aggregating them. This is done through the use of T-Score.
Elaborate on the GIST of this transformation process: GIST: Bench mark each pupil’s performance against the average and reward he/she to the extent on how well he/she performed in relation to the average pupil., taking into consideration, the spread (precision) of the distribution of marks earned by the pupils.
In essence, T-Scores provide the relative standing standing of a pupil’s performance in relation to his/her who take the same examination (in the same subject)
Stress the concept of benchmarking against each pupil to the average performance (X-Y) and reward he/she with regards to how far is he/she above (or below) the average level of performance within a given subject, taking into consideration, the spread of the performance in the subject.
Just the sum of T-scores
This slide is to illustrate relationship between grades and T-score/aggregates
Key Idea: There is a range of T-scores associated with a given grade. The A* in John case were weak A*. While the As in Susan’s case were very strong As, and her A8 was really a strong A* as well.