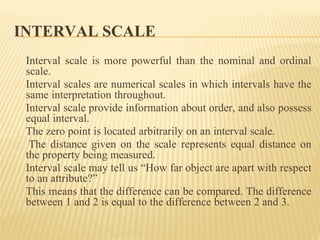
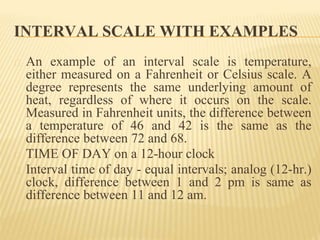
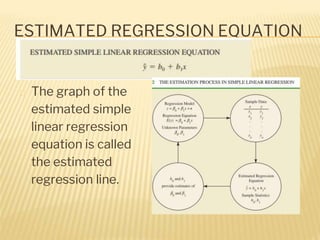
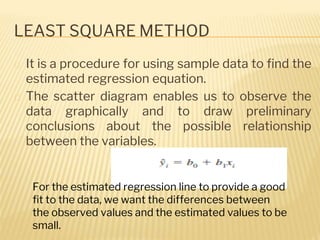
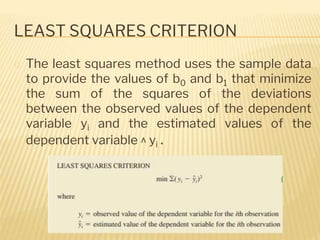
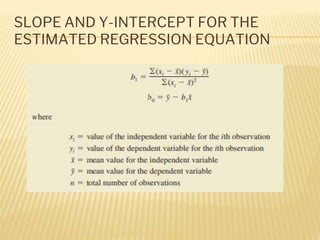
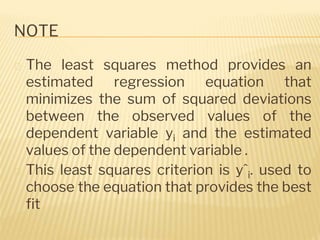
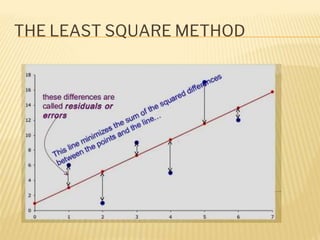
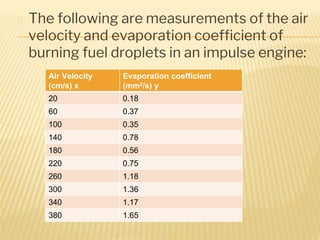
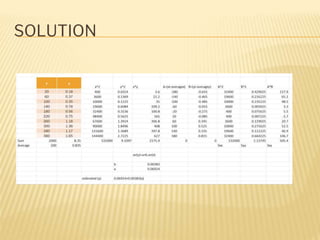
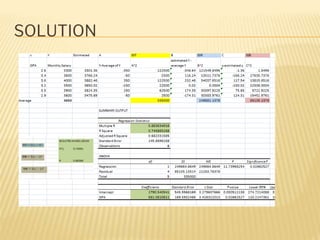
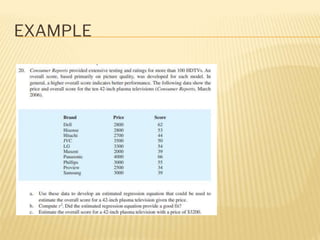
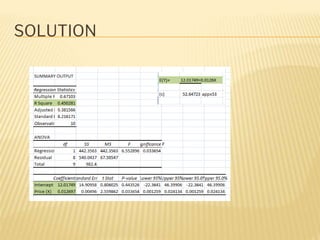
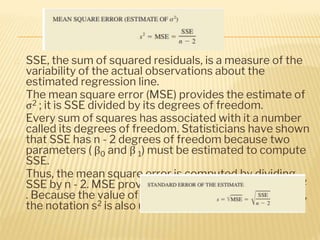
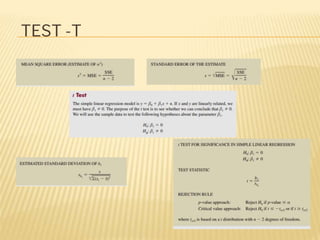
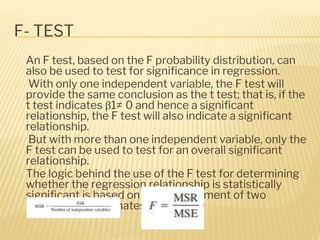
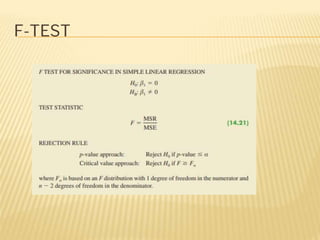
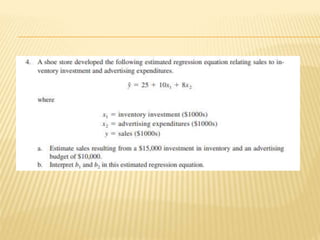
REGRESSION
MEANING
� The dictionary meaning of the word
Regression is ‘Stepping back’ or ‘Going back’.
� Regression is the measures of the average
relationship between two or more variables in
terms of the original units of the data. And it is
also attempts to establish the nature of the
relationship between variables that is to study
the functional relationship between the
variables and thereby provide a mechanism
for prediction, or forecasting
IMPORTANCE OF REGRESSION
ANALYSIS
� Regression analysis helps in three
important ways:
1. provides estimate of values of dependent
variables from values of independent
variables.
2. It can be extended to 2 or more variables,
which is known as multiple regression.
3. It shows the nature of relationship
between two or more variable
TWO MAIN OBJECTIVES
1. Establish if there is a relationship between
two variables. more specifically , establish
if there is a statistically significant
relationship between the two.
2. Forecast new observations.
In regression analysis, the data used to
describe the relationship between the
variables are primarily measured on interval
scale. with such data it is possible to
describe the relationship between variables
more exactly employing mathematical
equation.
INTERVAL SCALE
� Interval scale is more powerful than the nominal and ordinal
scale.
� Interval scales are numerical scales in which intervals have the
same interpretation throughout.
� Interval scale provide information about order, and also possess
equal interval.
� The zero point is located arbitrarily on an interval scale.
� The distance given on the scale represents equal distance on
the property being measured.
� Interval scale may tell us “How far object are apart with respect
to an attribute?”
This means that the difference can be compared. The difference
between 1 and 2 is equal to the difference between 2 and 3.
INTERVAL SCALE WITH EXAMPLES
� An example of an interval scale is temperature,
either measured on a Fahrenheit or Celsius scale. A
degree represents the same underlying amount of
heat, regardless of where it occurs on the scale.
Measured in Fahrenheit units, the difference between
a temperature of 46 and 42 is the same as the
difference between 72 and 68.
� TIME OF DAY on a 12-hour clock
� Interval time of day - equal intervals; analog (12-hr.)
clock, difference between 1 and 2 pm is same as
difference between 11 and 12 am.
VARIABLES
Variable
Dependent
(Want to predict)
Independent
(Used to predict)
β0 and β1 are referred to as the parameters of the model, and ε
(the Greek letter epsilon) is a random variable referred to as
the error term.
The graph of the simple linear regression equation is a
straight line; β0 is the y-intercept of the regression line, β1
is the slope, and E( y) is the mean or expected value of y for
a given value of x.
POSSIBLE REGRESSION LINES IN SIMPLE
LINEAR REGRESSION
ESTIMATED REGRESSION EQUATION
� The graph of the
estimated simple
linear regression
equation is called
the estimated
regression line.
NOTE
� Regression analysis cannot be interpreted
as a procedure for establishing a cause-
and-effect relationship between variables.
� It can only indicate how or to what extent
variables are associated with each other.
LEAST SQUARE METHOD
� It is a procedure for using sample data to find the
estimated regression equation.
� The scatter diagram enables us to observe the
data graphically and to draw preliminary
conclusions about the possible relationship
between the variables.
For the estimated regression line to provide a good
fit to the data, we want the differences between
the observed values and the estimated values to be
small.
LEAST SQUARES CRITERION
� The least squares method uses the sample data
to provide the values of b0 and b1 that minimize
the sum of the squares of the deviations
between the observed values of the dependent
variable yi and the estimated values of the
dependent variable ^ yi .
SLOPE AND Y-INTERCEPT FOR THE
ESTIMATED REGRESSION EQUATION
NOTE
� The least squares method provides an
estimated regression equation that
minimizes the sum of squared deviations
between the observed values of the
dependent variable yi and the estimated
values of the dependent variable .
� This least squares criterion is yˆi. used to
choose the equation that provides the best
fit
THE LEAST SQUARE METHOD
� The following are measurements of the air
velocity and evaporation coefficient of
burning fuel droplets in an impulse engine:
Air Velocity
(cm/s) x
Evaporation coefficient
(mm2/s) y
20 0.18
60 0.37
100 0.35
140 0.78
180 0.56
220 0.75
260 1.18
300 1.36
340 1.17
380 1.65
SOLUTION
EXAMPLE
RESIDUAL/ERROR
� For the ith observation, the difference
between the observed value of the
dependent variable, yi , and the estimated
value of the dependent variable, is
called the ith residual.
� Sum of squares of these residuals or errors
is the quantity that is minimized by the
least squares method. This quantity, also
known as the sum of squares due to error,
and denoted by SSE.
� SST as a measure of how well the
observations cluster about the ý line and
SSE as a measure of how well the
observations cluster about the ŷ line.
� To measure how much the ŷ values on the
estimated regression line deviate from ý ,
another sum of squares is computed. This
sum of squares, called the sum of squares
due to regression, is denoted SSR.
HOW ARE SST, SSR AND SSE RELATED?
The coefficient of determination is a
statistical measurement that examines
how differences in one variable can be
explained by the difference in a second
variable, when predicting the outcome of a
given event.
COEFFICIENT OF DETERMINATION
� After the construction of estimated
regression equation now the question
comes, How well does the estimated
regression equation fit the data?
� The coefficient of determination provides
a measure of the goodness of fit for the
estimated regression equation.
COEFFICIENT OF DETERMINATION
(R2)
� The coefficient of determination is used to explain
how much variability of one factor can be caused
by its relationship to another factor.
� This coefficient is commonly known as R-squared
(or R2), and is sometimes referred to as the
"goodness of fit."
� This measure is represented as a value between
0.0 and 1.0, where a value of 1.0 indicates a perfect
fit, and is thus a highly reliable model for future
forecasts, while a value of 0.0 would indicate that
the model fails to accurately model the data at all.
The correlation coefficient as a descriptive measure of the
strength of linear association between two variables, x
and y. Values of the correlation coefficient are always
between -1 and +1.
The sign for the sample correlation coefficient is positive
if the estimated regression equation has a positive slope
(b1 >0) and negative if the estimated regression equation
has a negative slope (b1 < 0)
COEFFICIENT OF CORRELATION AND
COEFFICIENT OF DETERMINATION
� In the case of a linear relationship between two variables, both
the coefficient of determination and the sample correlation
coefficient provide measure of strength of relationship.
� The coefficient of determination provides a wider range of
applicability.
� Larger values of r2 imply that the least squares line provides a
better fit to the data; that is, the observations are more closely
grouped about the least squares line
Coefficient of Determination Sample correlation coefficient
•Provides a measure between 0 and 1 •Provides a measure between +1 and -1
•This can be used for non-linear
relationship and for relationships that
have 2 or more independent variables.
•It is restricted to a linear relationship
between two variables.
EXAMPLE
SOLUTION
EXAMPLE
SOLUTION
� SSE, the sum of squared residuals, is a measure of the
variability of the actual observations about the
estimated regression line.
� The mean square error (MSE) provides the estimate of
σ2 ; it is SSE divided by its degrees of freedom.
� Every sum of squares has associated with it a number
called its degrees of freedom. Statisticians have shown
that SSE has n - 2 degrees of freedom because two
parameters ( β0 and β 1) must be estimated to compute
SSE.
� Thus, the mean square error is computed by dividing
SSE by n - 2. MSE provides an unbiased estimator of σ2
. Because the value of MSE provides an estimate of σ2 ,
the notation s2 is also used.
ADJUSTED R SQUARE
� The adjusted R-squared is a modified version of
R-squared that adjusts for predictors that are not
significant in a regression model.
� Compared to a model with additional input
variables, a lower adjusted R-squared indicates
that the additional input variables are not adding
value to the model.
� Compared to a model with additional input
variables, a higher adjusted R-squared indicates
that the additional input variables are adding
value to the model.
�
ADJUSTED R SQUARE
ADJUSTED R SQUARE
TEST -T
F- TEST
� An F test, based on the F probability distribution, can
also be used to test for significance in regression.
� With only one independent variable, the F test will
provide the same conclusion as the t test; that is, if the
t test indicates β1≠ 0 and hence a significant
relationship, the F test will also indicate a significant
relationship.
� But with more than one independent variable, only the
F test can be used to test for an overall significant
relationship.
� The logic behind the use of the F test for determining
whether the regression relationship is statistically
significant is based on the development of two
independent estimates of σ2
F-TEST
Regression -Linear.pptx

Regression -Linear.pptx

  • 1.
  • 2.
    MEANING � The dictionarymeaning of the word Regression is ‘Stepping back’ or ‘Going back’. � Regression is the measures of the average relationship between two or more variables in terms of the original units of the data. And it is also attempts to establish the nature of the relationship between variables that is to study the functional relationship between the variables and thereby provide a mechanism for prediction, or forecasting
  • 3.
    IMPORTANCE OF REGRESSION ANALYSIS �Regression analysis helps in three important ways: 1. provides estimate of values of dependent variables from values of independent variables. 2. It can be extended to 2 or more variables, which is known as multiple regression. 3. It shows the nature of relationship between two or more variable
  • 4.
    TWO MAIN OBJECTIVES 1.Establish if there is a relationship between two variables. more specifically , establish if there is a statistically significant relationship between the two. 2. Forecast new observations.
  • 5.
    In regression analysis,the data used to describe the relationship between the variables are primarily measured on interval scale. with such data it is possible to describe the relationship between variables more exactly employing mathematical equation.
  • 6.
    INTERVAL SCALE � Intervalscale is more powerful than the nominal and ordinal scale. � Interval scales are numerical scales in which intervals have the same interpretation throughout. � Interval scale provide information about order, and also possess equal interval. � The zero point is located arbitrarily on an interval scale. � The distance given on the scale represents equal distance on the property being measured. � Interval scale may tell us “How far object are apart with respect to an attribute?” This means that the difference can be compared. The difference between 1 and 2 is equal to the difference between 2 and 3.
  • 7.
    INTERVAL SCALE WITHEXAMPLES � An example of an interval scale is temperature, either measured on a Fahrenheit or Celsius scale. A degree represents the same underlying amount of heat, regardless of where it occurs on the scale. Measured in Fahrenheit units, the difference between a temperature of 46 and 42 is the same as the difference between 72 and 68. � TIME OF DAY on a 12-hour clock � Interval time of day - equal intervals; analog (12-hr.) clock, difference between 1 and 2 pm is same as difference between 11 and 12 am.
  • 8.
  • 9.
    β0 and β1are referred to as the parameters of the model, and ε (the Greek letter epsilon) is a random variable referred to as the error term. The graph of the simple linear regression equation is a straight line; β0 is the y-intercept of the regression line, β1 is the slope, and E( y) is the mean or expected value of y for a given value of x.
  • 10.
    POSSIBLE REGRESSION LINESIN SIMPLE LINEAR REGRESSION
  • 12.
    ESTIMATED REGRESSION EQUATION �The graph of the estimated simple linear regression equation is called the estimated regression line.
  • 13.
    NOTE � Regression analysiscannot be interpreted as a procedure for establishing a cause- and-effect relationship between variables. � It can only indicate how or to what extent variables are associated with each other.
  • 14.
    LEAST SQUARE METHOD �It is a procedure for using sample data to find the estimated regression equation. � The scatter diagram enables us to observe the data graphically and to draw preliminary conclusions about the possible relationship between the variables. For the estimated regression line to provide a good fit to the data, we want the differences between the observed values and the estimated values to be small.
  • 15.
    LEAST SQUARES CRITERION �The least squares method uses the sample data to provide the values of b0 and b1 that minimize the sum of the squares of the deviations between the observed values of the dependent variable yi and the estimated values of the dependent variable ^ yi .
  • 16.
    SLOPE AND Y-INTERCEPTFOR THE ESTIMATED REGRESSION EQUATION
  • 17.
    NOTE � The leastsquares method provides an estimated regression equation that minimizes the sum of squared deviations between the observed values of the dependent variable yi and the estimated values of the dependent variable . � This least squares criterion is yˆi. used to choose the equation that provides the best fit
  • 18.
  • 19.
    � The followingare measurements of the air velocity and evaporation coefficient of burning fuel droplets in an impulse engine: Air Velocity (cm/s) x Evaporation coefficient (mm2/s) y 20 0.18 60 0.37 100 0.35 140 0.78 180 0.56 220 0.75 260 1.18 300 1.36 340 1.17 380 1.65
  • 20.
  • 21.
  • 24.
    RESIDUAL/ERROR � For theith observation, the difference between the observed value of the dependent variable, yi , and the estimated value of the dependent variable, is called the ith residual.
  • 25.
    � Sum ofsquares of these residuals or errors is the quantity that is minimized by the least squares method. This quantity, also known as the sum of squares due to error, and denoted by SSE.
  • 26.
    � SST asa measure of how well the observations cluster about the ý line and SSE as a measure of how well the observations cluster about the ŷ line.
  • 27.
    � To measurehow much the ŷ values on the estimated regression line deviate from ý , another sum of squares is computed. This sum of squares, called the sum of squares due to regression, is denoted SSR.
  • 30.
    HOW ARE SST,SSR AND SSE RELATED? The coefficient of determination is a statistical measurement that examines how differences in one variable can be explained by the difference in a second variable, when predicting the outcome of a given event.
  • 31.
    COEFFICIENT OF DETERMINATION �After the construction of estimated regression equation now the question comes, How well does the estimated regression equation fit the data? � The coefficient of determination provides a measure of the goodness of fit for the estimated regression equation.
  • 32.
    COEFFICIENT OF DETERMINATION (R2) �The coefficient of determination is used to explain how much variability of one factor can be caused by its relationship to another factor. � This coefficient is commonly known as R-squared (or R2), and is sometimes referred to as the "goodness of fit." � This measure is represented as a value between 0.0 and 1.0, where a value of 1.0 indicates a perfect fit, and is thus a highly reliable model for future forecasts, while a value of 0.0 would indicate that the model fails to accurately model the data at all.
  • 33.
    The correlation coefficientas a descriptive measure of the strength of linear association between two variables, x and y. Values of the correlation coefficient are always between -1 and +1. The sign for the sample correlation coefficient is positive if the estimated regression equation has a positive slope (b1 >0) and negative if the estimated regression equation has a negative slope (b1 < 0)
  • 34.
    COEFFICIENT OF CORRELATIONAND COEFFICIENT OF DETERMINATION � In the case of a linear relationship between two variables, both the coefficient of determination and the sample correlation coefficient provide measure of strength of relationship. � The coefficient of determination provides a wider range of applicability. � Larger values of r2 imply that the least squares line provides a better fit to the data; that is, the observations are more closely grouped about the least squares line Coefficient of Determination Sample correlation coefficient •Provides a measure between 0 and 1 •Provides a measure between +1 and -1 •This can be used for non-linear relationship and for relationships that have 2 or more independent variables. •It is restricted to a linear relationship between two variables.
  • 35.
  • 36.
  • 37.
  • 39.
  • 40.
    � SSE, thesum of squared residuals, is a measure of the variability of the actual observations about the estimated regression line. � The mean square error (MSE) provides the estimate of σ2 ; it is SSE divided by its degrees of freedom. � Every sum of squares has associated with it a number called its degrees of freedom. Statisticians have shown that SSE has n - 2 degrees of freedom because two parameters ( β0 and β 1) must be estimated to compute SSE. � Thus, the mean square error is computed by dividing SSE by n - 2. MSE provides an unbiased estimator of σ2 . Because the value of MSE provides an estimate of σ2 , the notation s2 is also used.
  • 41.
    ADJUSTED R SQUARE �The adjusted R-squared is a modified version of R-squared that adjusts for predictors that are not significant in a regression model. � Compared to a model with additional input variables, a lower adjusted R-squared indicates that the additional input variables are not adding value to the model. � Compared to a model with additional input variables, a higher adjusted R-squared indicates that the additional input variables are adding value to the model. �
  • 42.
  • 43.
  • 44.
  • 45.
    F- TEST � AnF test, based on the F probability distribution, can also be used to test for significance in regression. � With only one independent variable, the F test will provide the same conclusion as the t test; that is, if the t test indicates β1≠ 0 and hence a significant relationship, the F test will also indicate a significant relationship. � But with more than one independent variable, only the F test can be used to test for an overall significant relationship. � The logic behind the use of the F test for determining whether the regression relationship is statistically significant is based on the development of two independent estimates of σ2
  • 46.