Download to read offline

![7
Saad Haj Bakry
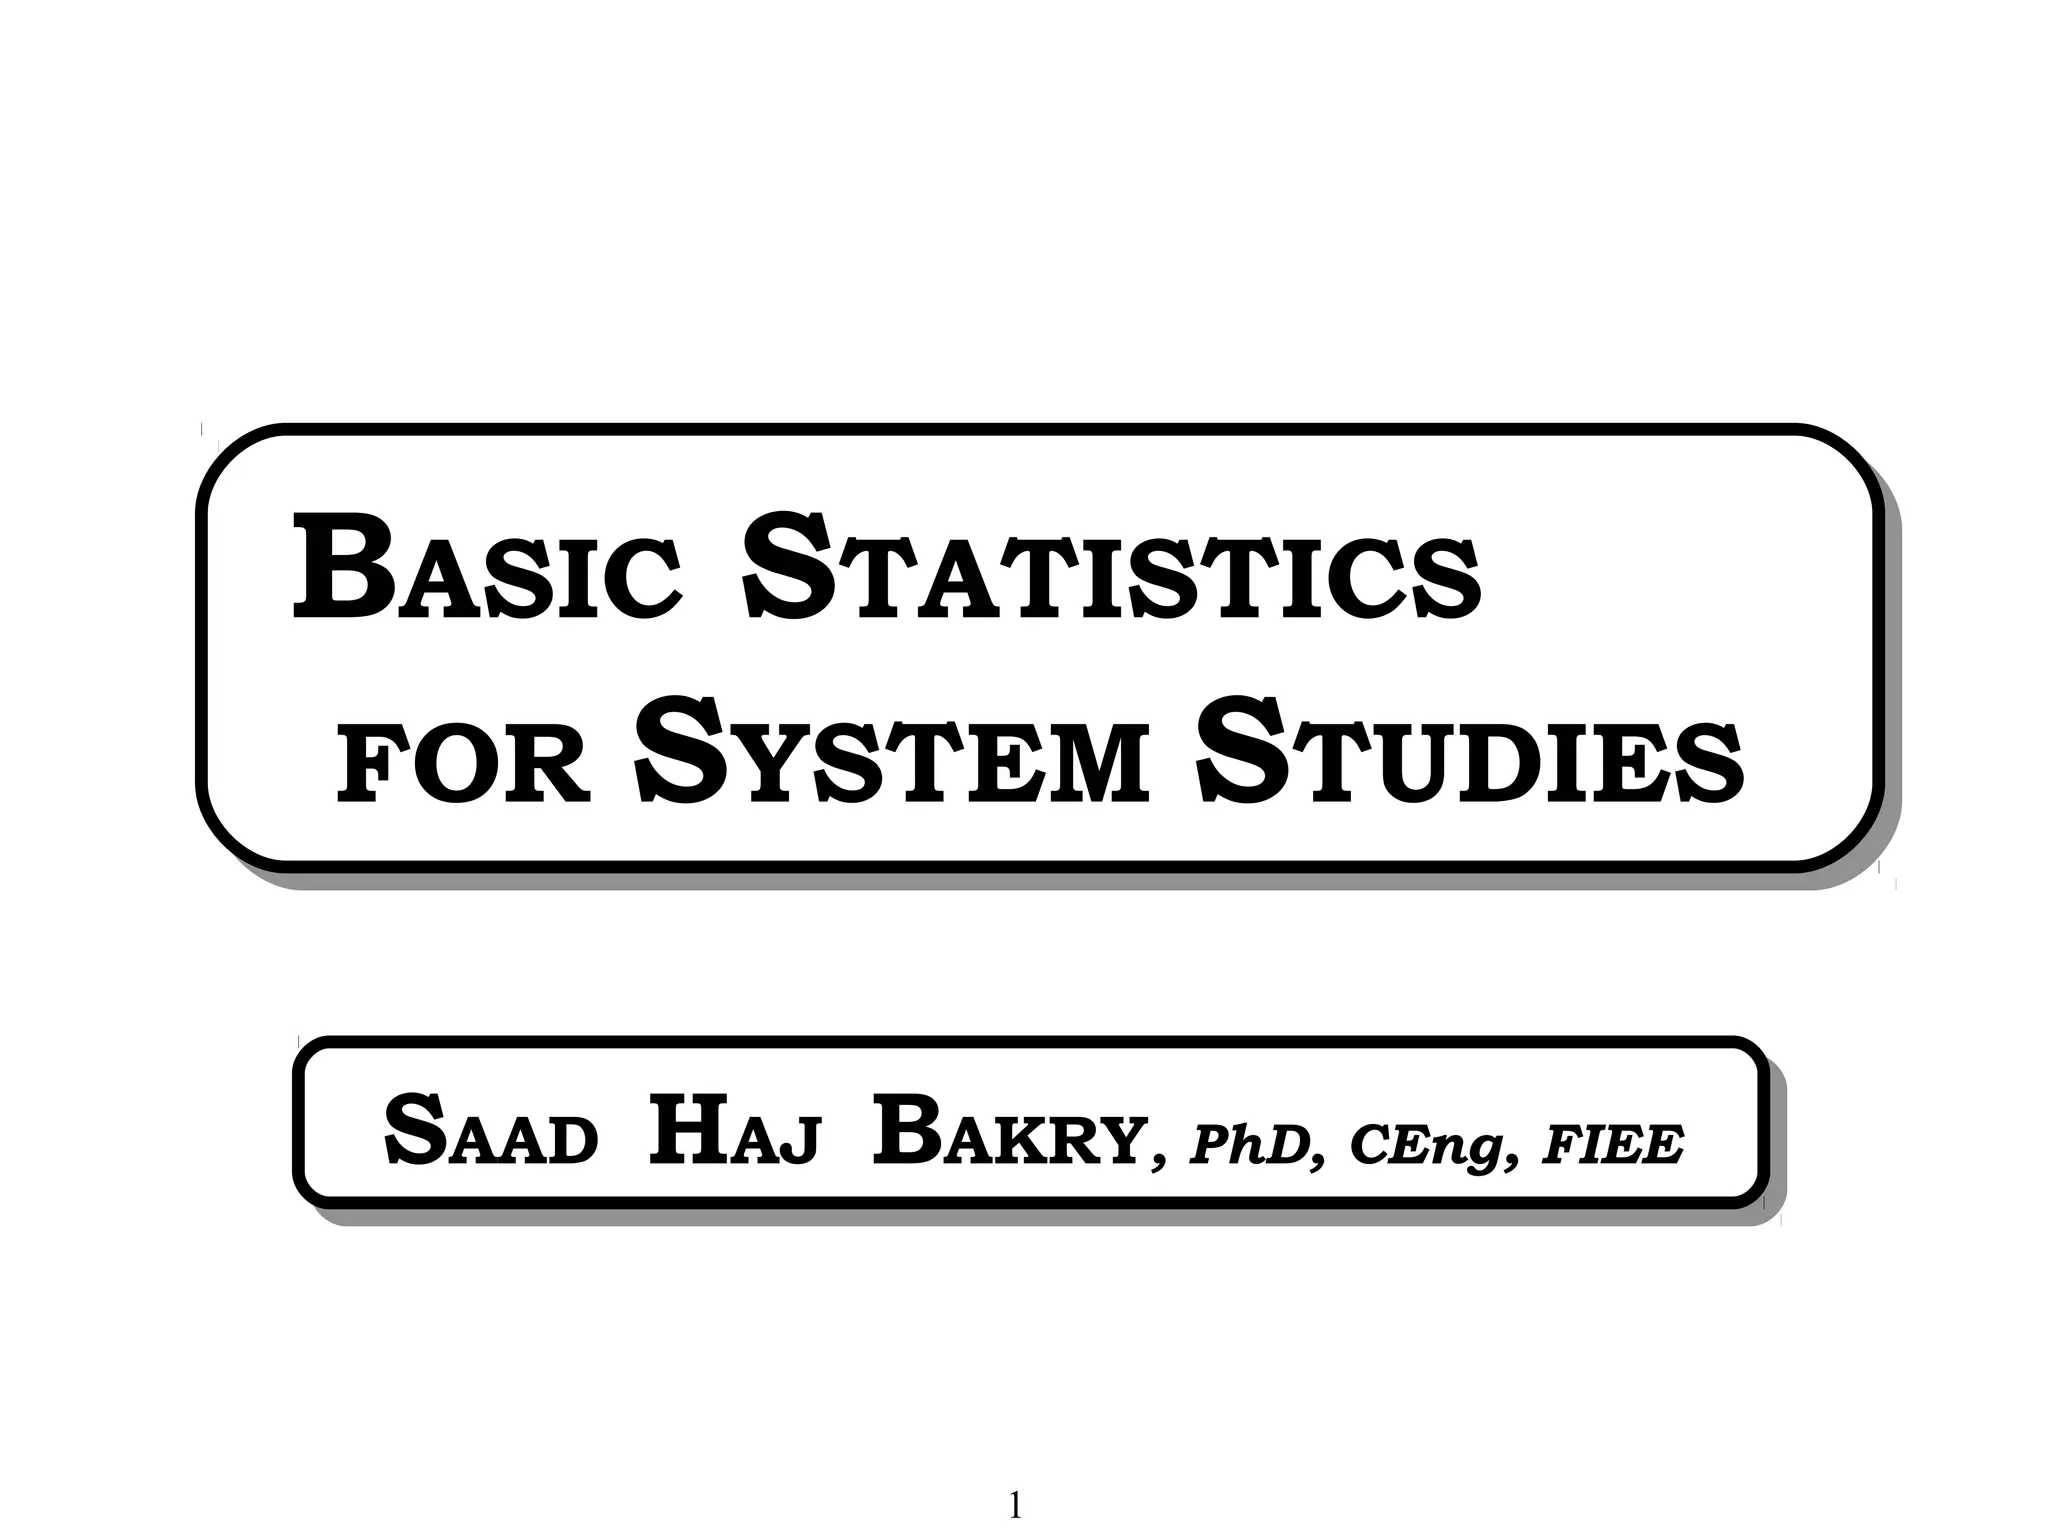
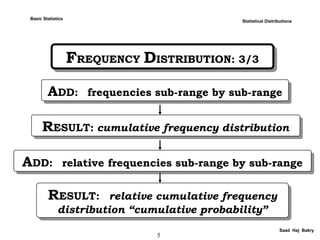
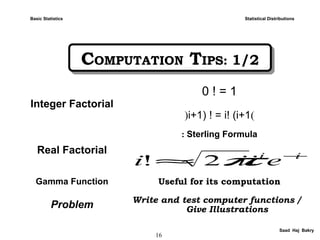
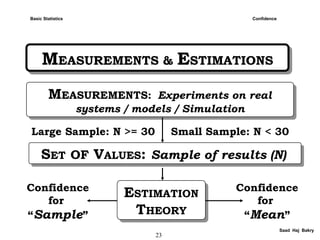
MEAN : AVERAGE : EXPECTATIONMEAN : AVERAGE : EXPECTATION
Statistical Distributions
Definition Arithmetic mean
Raw Data Given values: x[1], x[2], …. x[N[
Mean m=
Raw Data
Given ranges: y[1], y[2], ….y[n[
Frequencies: f[1], f[2], …. f[n[
Weighted
Mean
m= :
Problem Write and test computer functions /
Give Illustrations
][].[
1
1
∑
=
=
nj
j
jyjf
N
∑
=
=
Ni
i
ix
N 1
][
1
∑
=
=
=
nj
j
Njf
1
][
Basic Statistics](https://image.slidesharecdn.com/1504-basicstatistics-161031144015/85/1504-basic-statistics-7-320.jpg)
![8
Saad Haj Bakry
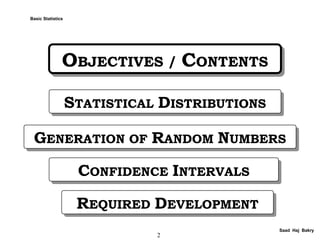
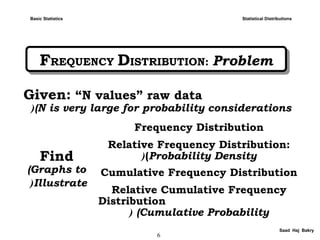
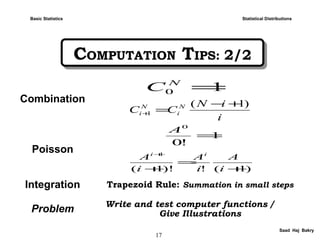
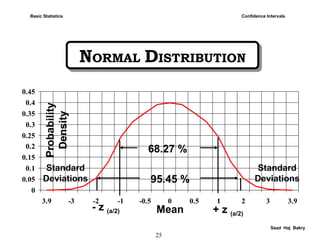
MODE / MEDIANMODE / MEDIAN
Statistical Distributions
Median Middle value
Mode Value with highest frequency
Raw Data Given values: x[1], x[2], …. x[N]
Median
For ODD N: m = x[(N+1)/2]
EVEN: m = (1/2) {x[N/2]+x[(N/2)+1]}
Mode
Find frequency distribution:
m = x[k] : f[k] highest frequency
Problem Write and test computer functions /
Give Illustrations
Basic Statistics](https://image.slidesharecdn.com/1504-basicstatistics-161031144015/85/1504-basic-statistics-8-320.jpg)
![9
Saad Haj Bakry
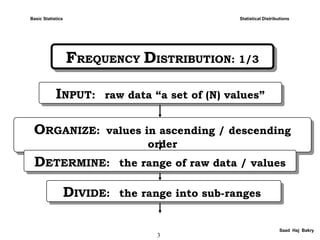
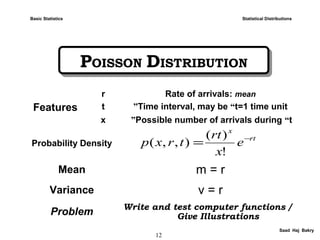
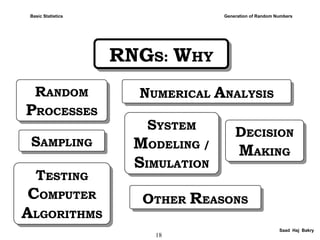
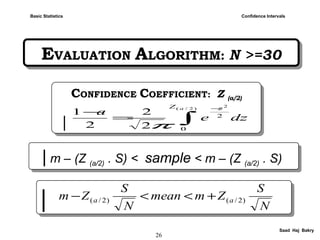
DEVIATION / VARIANCEDEVIATION / VARIANCE
Statistical Distributions
Deviation
Deviation from the “mean”
d[i] = |x[i] – m|
Mean
Deviation
Variance /
Standard
Deviation
Standard
Score
Standardized Variables: z[i] = d[i] / s
Problem Write and test computer functions /
Give Illustrations
∑
=
=
=
Ni
i
id
N
d
1
][
1
∑=
=
n
j
jdjf
n
d
1
][].[
1
∑
=
=
=
nj
j
Njf
1
][
∑
=
=
=
Ni
i
idN
v
1
2
][
1
vs =
Basic Statistics](https://image.slidesharecdn.com/1504-basicstatistics-161031144015/85/1504-basic-statistics-9-320.jpg)
![10
Saad Haj Bakry
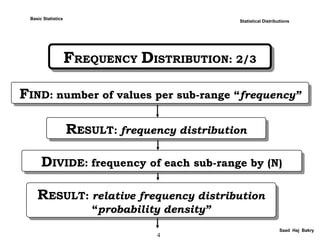
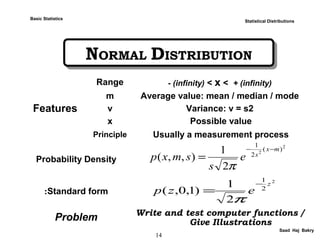
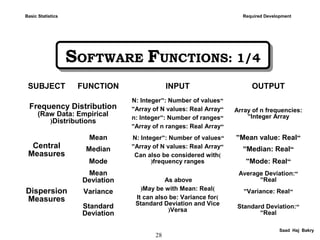
UNIFORM DISTRIBUTIONUNIFORM DISTRIBUTION
Statistical Distributions
Features
Range
“min”: Minimum number
“max”: Maximum number
Principle All numbers “x[i] : x” are equally likely
Probability Density p(x,min,max) = 1 / (max-min(
Mean m = (max + min) / 2
Variance v = (max - min)2
/ 12
Problem Write and test computer functions /
Give Illustrations
Basic Statistics](https://image.slidesharecdn.com/1504-basicstatistics-161031144015/85/1504-basic-statistics-10-320.jpg)


![15
Saad Haj Bakry
t DISTRIBUTIONt DISTRIBUTION
Statistical Distributions
Features
Range - (infinity) < t < + (infinity)
m mean / median / mode at “zero”
f Degree of freedom: 0 < f < + (infinity(
Principle Used for estimation: small sample
t Distribution variable: variance unknown
Probability Density
Gamma Function
Problem Write and test computer functions /
Give Illustrations
2/(1(
2
(1(
(2/(
]2/(1[(
(,( +−
+
Γ
+Γ
= f
f
t
ff
f
ftp
π
(!1(((
0
1
−==Γ −
∞
−
∫ fdxexf xf
Basic Statistics](https://image.slidesharecdn.com/1504-basicstatistics-161031144015/85/1504-basic-statistics-15-320.jpg)
![19
Saad Haj Bakry
UNIFORM RNG: U (0,1)UNIFORM RNG: U (0,1)
Features
m
Modulus factor: large (st) prime number within
memory cell size (for wide repeated sequence cycle(
m = 231
- 1 = 2,147,483,674 (for 32 bit cell(
a Multiplier: a = 314,159,269
b Increment: b = 453,806,245
X[0[ Starting value: X[0] = 577,215,665 (the seed)
X[i-1[ “)ith-1)” value: seed for X[i[
Uniform: X (0,m( X[i] = {a . X[i-1] + b} MOD m
Uniform: U (0,1( U[i] = X[i] / m
Problem Write and test computer functions /
Give Illustrations
Generation of Random NumbersBasic Statistics](https://image.slidesharecdn.com/1504-basicstatistics-161031144015/85/1504-basic-statistics-19-320.jpg)
![20
Saad Haj Bakry
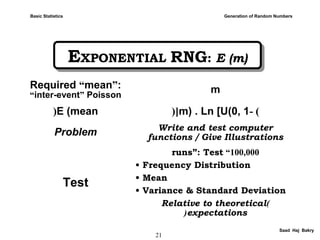
UNIFORM RNG: U (min , max)UNIFORM RNG: U (min , max)
Integer
Range
min Required minimum integer value
max Required maximum integer value
U (min, max( min + TRUNC [(max – min + 1) . U (0, 1([
Problem Write and test computer functions /
Give Illustrations
Test
100,000“runs”: Test
• Frequency Distribution
• Mean
• Variance & Standard Deviation
)Relative to theoretical expectations(
Note Every new set of runs should start with
a different seed: X[0]
Generation of Random NumbersBasic Statistics](https://image.slidesharecdn.com/1504-basicstatistics-161031144015/85/1504-basic-statistics-20-320.jpg)
![22
Saad Haj Bakry
NORMAL RNG: N (m, s)NORMAL RNG: N (m, s)
Features
m Required “mean” of the normal RNG
s Required “standard deviation”
STEPS
1
V[1] = 2 . { U(0,1)[1] } – 1
V[2] = 2 . { U(0,1)[2] } – 1
2 SUM = V2
[1] + V2
[2[
3 IF SUM >= 1 GO TO STEP 1
4
5 N (m,s) = m + s . Y
Standard Normal N (0,1) = Y
Problem Write and test computer functions /
Give Illustrations
SUMSUMLnVY /)](.2[].2[ −=
Generation of Random NumbersBasic Statistics](https://image.slidesharecdn.com/1504-basicstatistics-161031144015/85/1504-basic-statistics-22-320.jpg)
![24
Saad Haj Bakry
EVALUATION ALGORITHM: GeneralEVALUATION ALGORITHM: General
Confidence IntervalsBasic Statistics
INPUT: Measurements: N & x[1], x[2],….,x[N]
Required “confidence level” : L (%)
INPUT: Measurements: N & x[1], x[2],….,x[N]
Required “confidence level” : L (%)
MEAN: |MEAN: | ∑
=
=
=
Ni
i
ix
N
m
1
][
1
STANDARD DEVIATION:|STANDARD DEVIATION:| ∑
=
=
−
−
=
ni
i
mix
N
s
1
2
}][{
1
1
AREA UNDER CURVE: | a = 1 – (L/100)AREA UNDER CURVE: | a = 1 – (L/100)](https://image.slidesharecdn.com/1504-basicstatistics-161031144015/85/1504-basic-statistics-24-320.jpg)
![27
Saad Haj Bakry
EVALUATION ALGORITHM: N < 30EVALUATION ALGORITHM: N < 30
Confidence IntervalsBasic Statistics
| m – (T (a/2) . S) < sample < m – (T (a/2) . S)| m – (T (a/2) . S) < sample < m – (T (a/2) . S)
|| ∫
−
−
+
−−Γ
Γ
=
−
)2/(
0
)2/(
2
)
1
1(
)1(]2/)1[(
)2/(
2
1
aT
N
dt
N
t
NN
Na
π
|| N
S
Tmmean
N
S
Tm aa )2/()2/( +<<−
|| )!1(.)(
0
1
−==Γ ∫
∞
−−
fdxexf xf](https://image.slidesharecdn.com/1504-basicstatistics-161031144015/85/1504-basic-statistics-27-320.jpg)
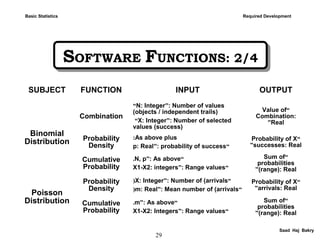
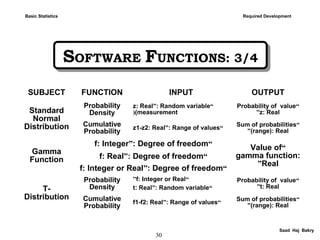
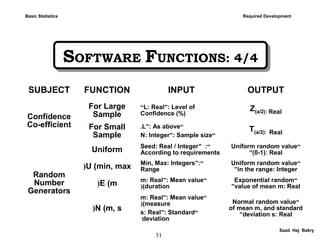

The document by Saad Haj Bakry provides an extensive overview of basic statistics applicable to system studies, covering topics such as statistical distributions, random number generation, and confidence intervals. It elaborates on different statistical measures including mean, mode, median, variance, and distributions like binomial and normal. Additionally, it includes practical algorithms and software functions necessary for data processing and analysis in statistics.