
Download as PDF, PPTX


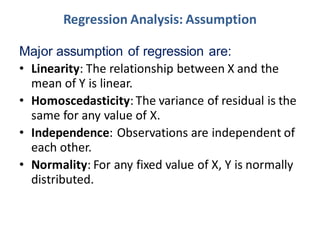


This document provides an overview of regression analysis, including: - Regression analysis estimates relationships between dependent and independent variables and can be used for prediction and assessing variable influence. - It mathematically determines which factors impact an outcome and which can be ignored. - Simple and multiple linear regression fit linear equations to relate one or more explanatory variables to an outcome variable. - Assumptions include linearity, homoscedasticity, independence, and normality. - Regression analysis can infer causal relationships and is widely used for forecasting.


![[Xin yan, xiao_gang_su]_linear_regression_analysis(book_fi.org)](https://cdn.slidesharecdn.com/ss_thumbnails/xinyanxiaogangsulinearregressionanalysisbookfi-140714092751-phpapp02-thumbnail.jpg?width=640&height=640&fit=bounds)


