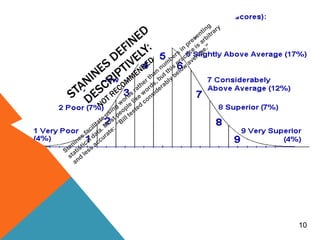
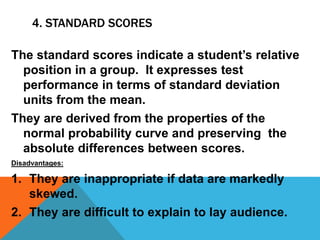
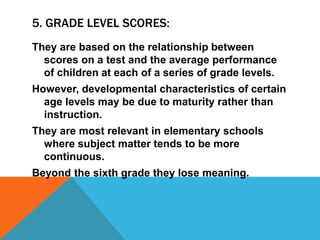
1. The document discusses different types of test scores including raw scores, percentiles, stanines, standard scores, and grade level scores.
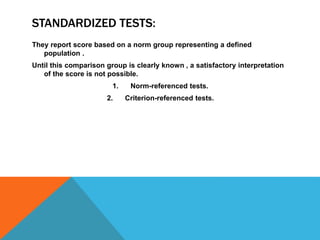
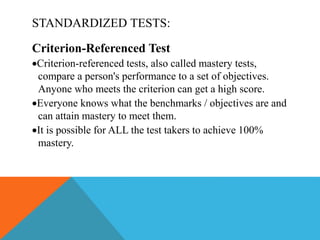
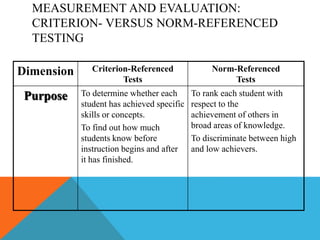
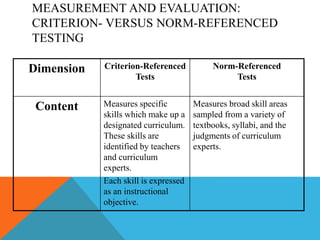
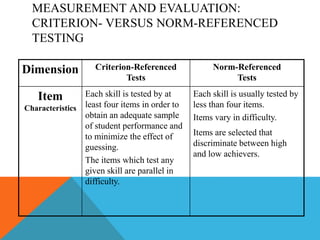
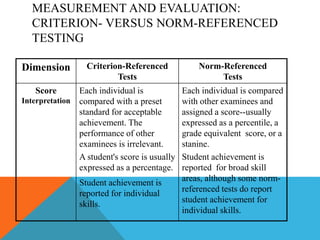
2. It also explains the key differences between criterion-referenced tests and norm-referenced tests. Criterion-referenced tests measure specific skills defined by objectives, while norm-referenced tests measure broad skills to rank students against others.
3. The document provides details on how each type of test score is calculated and interpreted, and what each type aims to convey about a student's performance.