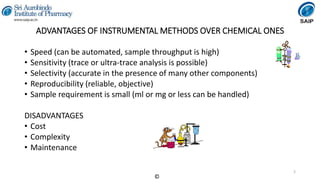
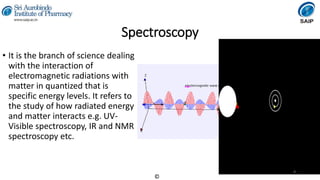
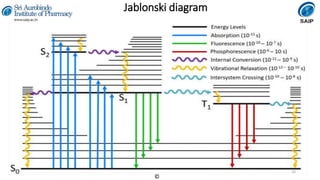
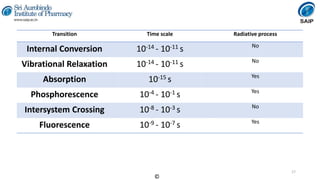
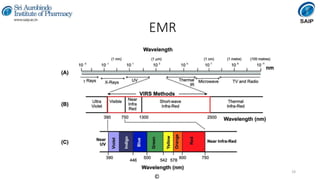
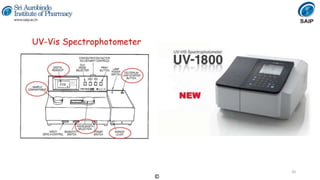
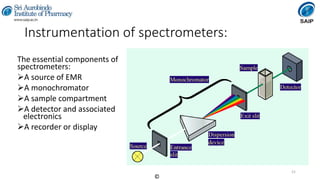
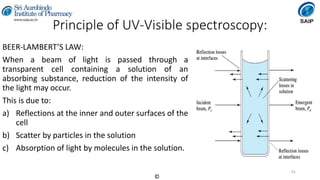
SlideShare a Scribd company logo
Basics of spectroscopy, Jablonski diagram, Instrumentation of UV-Visible
Spectrometer,
Beer-Lambert’s law and its deviation
Shweta Mishra, M. Pharm (Pharmaceutical Chemistry)
shweta.mishra@saip.ac.in
Sri Aurobindo Institute of Pharmacy, Indore-Ujjain State Highway,
Indore, Madhya Pradesh 453555
1
©
ADVANTAGES OF INSTRUMENTAL METHODS OVER CHEMICAL ONES
• Speed (can be automated, sample throughput is high)
• Sensitivity (trace or ultra-trace analysis is possible)
• Selectivity (accurate in the presence of many other components)
• Reproducibility (reliable, objective)
• Sample requirement is small (ml or mg or less can be handled)
DISADVANTAGES
• Cost
• Complexity
• Maintenance
2
©
Introduction to the electronic structure of the atoms
• In 1904 Sir JJ Thomson proposed the theory of matter. He pictured the positive charge of an atom
distributed uniformly throughout a sphere of protons and neutrons and the negative charge was
surrounding it in a jelly like fashion.
• Rutherford modified this theory that electrons revolves around the nucleus in such a way that
the centrifugal force exactly balances the inward attractive force much like our planets to around the sun.
Hence regardless of their speed, they enter the nucleus. Moreover the electron losing energy would
omit continuous radiation without any sharp breaks.
• In 1903, Bohr proposed a radically different view of the atomic a structure based on the optical
spectrum of hydrogen. He included the postulates of quantum theory proposed by Max Planck.
3
©
Introduction to the electronic structure of the atoms
• Bohr proposed that the electron in a hydrogen atom always described a fixed circular path around the
nucleus. Search orbits named ‘stationary states' maybe thought of various circles differing in radius.
• The angular momentum of each
stationary state was an integral multiple of
N.H/2П which amounts to angular momentum.
• The angular momentum mvr is given by the
formula:
mvr = N (H/2П)
where N is an integer called a quantum
number
4
©
• He also postulated that as long as the electron remained in a given
orbit it neither radiates nor absorbs energy. When the electron moves
from one orbit to another it was considered to involve the absorption
or emission of definite quantity of energy depending upon whether
the electron moved from lower state to higher one or vice versa. This
energy manifests as radiation and the frequency of such radiation is
manifests as a spectral line which could be related to the energies of
electron in the two states E1 and E2:
• E2 - E1 = hυ
5
©
• Line spectra appear in two forms, absorption spectra,
showing dark lines on a bright background, and
emission spectra with bright lines on a dark or black
background.
• These two types are in fact related and arise
due to quantum mechanical interactions between
electrons orbiting atoms and photons of light.
• Photons of light each have a specific frequency.
• The energy of a photon is a function of its frequency
and is determined by:
E = hf
where f is the frequency of the photon, E is the energy
and h is Planck's constant (= 6.626 x 10⁻³⁴J.s)
Production of Line Spectra
6
©
• An electron orbits around a nucleus in a stable
energy level. If a photon of a specific frequency
interacts with the electron, it can gain sufficient
energy to "jump up" one or more levels. The
photon is absorbed by the electron so cannot
continue on to be detected by an observer. The
electron then "de-excites" and jumps back down
to a lower energy orbit, emitting a photon of
specific frequency. This photon, however, could
be emitted in any direction, not just in the same
direction as the original incident photon.
• The Balmer series of visible lines for atomic
hydrogen are caused by transitions from the n =
2 orbit to and from higher orbits. This is shown
schematically in the diagram for the Bohr model
of the atom. The Lyman Series involves transitions
down to the n = 1 orbit and involve higher
frequency photons in the UV region whilst the
Paschen Series (to n = 3) produces IR spectral
lines. 7
©
Spectroscopy
• It is the branch of science dealing
with the interaction of
electromagnetic radiations with
matter in quantized that is
specific energy levels. It refers to
the study of how radiated energy
and matter interacts e.g. UV-
Visible spectroscopy, IR and NMR
spectroscopy etc.
8
©
Spectroscopy? Spectrogram?
Spectrometry? Spectrograph?
The measurement of a
specific spectrum
The machine for recording spectra
9
©
SPECTROSCOPY
Atomic Spectroscopy Molecular Spectroscopy
Absorption Emission Absorption Emission
AAS Flame emission/
Flame
photometry
UV, IR, NMR, Electron
spin resonance spectra,
Raman spectra
Flourimetry,
Phosphorimetry
10
©
The absorption and emission spectrum concept
11
©
The origin of UV band
• If energy is supplied to the sample, for example, by passing
electromagnetic radiation through it, the sample atoms or molecules
may absorb energy and be promoted into the higher energy level.
• For an atom that absorbs in the UV, the absorption spectrum
sometimes consist of very sharp lines as would be expected for a
quantized process occurring between two discrete energy levels.
• For molecules, however, the UV absorption usually occurs over a wide
range of wavelengths, because molecules (as opposed to atoms)
normally have many excited modes of vibration and rotation at room
temperature. In fact, the vibration of molecules has many states of
vibrational and rotational excitation.
12
©
The energy levels for these states are quite closely spaced,
corresponding to energy differences considerably smaller
than those of electronic levels. The rotational and
vibrational levels are thus superimposed on the electronic
levels. A molecule can therefore undergo electronic and
vibrational rotational excitation simultaneously. Because
there are so many possible transitions, each differing from
the others by only a slight amount, each transition consists
of a vast number of lines spaced so closely that the
spectrophotometer cannot resolve them and usually
consider them as a broad band of absorption centered near
the wavelength of the major transition in UV spectrum.
• Deactivation of the thermally excited atoms to lower
energy states occurs very rapidly and photons of light are
emitted which have energy (δE) equal to the difference
between the upper and lower energy states.
• δE = Eh - El = (Eelectronic - Evibrational - Erotational)h - (Eelectronic -
Evibrational - Erotational)l
13
©
When a sample containing metallic atoms is
heated above 2000ᵒC, it undergoes partial or
complete partial or complete dissociation into
free atoms and then volatilizes to free
gaseous atoms. The electrons of the gaseous
atoms exist in discrete quantized energy
levels, i.e. they are in the orbitals which have
specific energy levels that are characteristic of
the element. The electrons in the outer
orbitals of the atom may absorb thermal
energy and be promoted to one or higher
energy states. The gain in energy of each
electron during a transition is a specific
quantity corresponding to the difference
between the energy levels after and before
excitation. 14
©
• δE = E2 - E1 = hυ = hc/λ = hcΰ
• E α 1/ λ
• Consequently, a very large number of wavelengths are
absorbed, each corresponding to a particular δE value,
which are so close together that they appear as a
continuous band spectrum. The transition δE4, given
by the highest proportion of molecules, corresponds
with the wavelength of maximum absorption (λmax).
Light at longer and shorter wavelengths is absorbed
less strongly because fewer molecules give related
transitions. Longer wavelengths have insufficient
energy to induce electronic transitions but they are
sufficiently energetic sufficiently energetic to increase
the vibrational energy levels, and the associated
rotational levels, of many molecular bonds.
https://d396qusza40orc.cloudfront.net/physicalchemistry/Spectroscopy_Course/spectroscopy-graphs/visible-
spectrum-phenolphthalein.html
15
©
Jablonski diagram
16
©
Transition Time scale Radiative process
Internal Conversion 10-14 - 10-11 s No
Vibrational Relaxation 10-14 - 10-11 s No
Absorption 10-15 s Yes
Phosphorescence 10-4 - 10-1 s Yes
Intersystem Crossing 10-8 - 10-3 s No
Fluorescence 10-9 - 10-7 s Yes
17
©
Order of energy:
Energy for absorption > Energy for Fluorescence > Energy for phosphorescence
Order of wavelength:
Wavelength for absorption < Wavelength for Fluorescence < Wavelength for phosphorescence
18
©
EMR
19
©
20
©
Instrumentation of spectrometers:
The essential components of
spectrometers:
A source of EMR
A monochromator
A sample compartment
A detector and associated
electronics
A recorder or display
21
©
Light source
• Ideal requirements of light source:
It should generate a beam with sufficient power for ready detection
and measurement.
It should emit continuous radiation in the region being studied.
It should be stable.
It should emit a measurable signal throughout the region.
The distribution of energy through a spectrum is mainly a function of
temperature; higher the temperature of the light source the shorter
the wavelength of the peak emission.
22
©
• Common energy sources for the various regions are indicated below:
IR Radiation:
Globar and nerst glowers are the common sources of IR radiation.
The globar is an electrically heated rod of silicon carbide, and the
Nernst glower is a small rod of refractory oxides which, when heated
to 1200-1500 degrees, will conduct electricity and thus maintain itself
in incandescence.
Both these sources operate without a glass envelope, which would
absorb IR radiation of wavelength greater than 2μm.
23
©
 Visible radiation:
Tungsten filament lamp is used for the region 350 nm- 2000 nm.
Tungsten filament is contained in a glass envelope.
IR Radiations which may cause stray light effects can be removed by using
suitable filters.
The life of the lamp is limited by the evaporation of tungsten, which darkens the
inside of the envelope and reduces the energy of the incident light.
Tungsten-halogen lamps, are used in more expensive instruments and halogen
gas is filled inside a quartz envelope.
The halogen prevents evaporation of the tungsten and increases the life of the
tungsten.
The higher operating temperatures extends the lower wavelength limit to 310 nm
and gives greater light intensity.
24
©
 UV Radiations:
 The most convenient light source for measurement in the UV region is a
deuterium discharge lamp.
It consists of 2 electrodes contained in a deuterium- filled silica envelope.
The passage of high voltage from a special power supply across the
electrodes causes emission of deuterium lines which, at low pressure
inside the lamp, broaden to give a continuous spectrum in the range 185-
380 nm.
Above 380 nm, the emission is not continuous, and the sharp lines at 486
nm and 656.1 nm may be used to calibrate the wavelength scale in this
region.
25
©
 Below 185 nm the output is reduced by absorption in the silica
envelope.
Deuterium lamps give approx. five times greater light intensity than
hydrogen lamps when operated at same voltage.
UV-Visible spectrophotometers normally have both a deuterium
lamp and a tungsten (or tungsten-halogen) lamp, and selection of the
appropriate lamp is made by moving either the lamp mountings or a
mirror to cause the light to fall on the entrance slit of the
manochromator.
26
©
Monochromators
• Light gives radiation from 400-800nm
• This is called polychromatic light which is of several wavelength
• Hence a filter or monochromator is used to convert polychromatic
light into monochromatic lights used
27
©
Monochromators
Ideal requirements of the monochromator:
oIt should be able to isolate a particular wavelength or range of
wavelengths.
oIt should adhere to the beer-lambert’s law.
oIt should emit a measurable signal throughout the region.
Commonly used monochromators are:
• Filters
• Prisms
• Gratings
28
©
Absorption Filters
Glass filters are pieces of coloured glass which transmit limited
wavelength ranges of the spectrum.
The color is produced by incorporating oxides of such metals as
vanadium, chromium, manganese, iron, nickel, and copper in glass.
The color absorbed is the complement of the color of the filter. For
example, a filter absorbing yellow light will appear blue.
The range of wavelengths transmitted (bandwidth) is very high and
may exceed 150 nm.
29
©
Wavelength (nm) Color Complement color
400-450 Violet Yellow-green
450-480 Blue Yellow
480-490 Green-blue Orange
490-500 Blue-green Red
500-560 Green Purple
560-575 Yellow-green Violet
575-590 Yellow Blue
590-625 Orange Green-blue
625-750 Red Blue-green
Below 400 nm the color gradually becomes invisible as
it passes into UV; above 750 nm it passes into IR.
30
©
 Gelatin filters consisting of a mixture of dyes incorporated in gelatin
and sandwitched between glass plates are more selective, with
bandwidths about 25 nm.
Merits:
• Simple, cheaper
Demerits:
• Less acurate, bandpass is more (+/- 30 nm), intensity is less
31
©
32
©
Interferometeric filters
• They have an even more narrower bandwidth (about 15 nm) and
consists of 2 parallel glass plates, silvered internally and separated by
a thin film of cryolite or other dielectric material.
• Such filters make use of interference of light waves rather than
absorption to eliminate the undesired radiation, and serve as
relatively inexpensive monochromators for a specific purpose.
• Eg. Isolation of calcium radiation at 626 nm and sodium at 589.3 nm
in flame photometer
• Ordinary filters are incapable for this and cause large errors in
measurement of calcium content.
33
©
• Also known as fabry-perot filter
• It has dielectric spacer made up of
CaF2, MgF2, or SiO.
• Thickness of dielectric spacer film can
be ½ ʎ (1st order),
2/2 ʎ (2nd order) , 3/2 ʎ (3rd order).
• Mechanism is constructive interference
followed by this equation.
• ʎ=2ηb/m
ʎ=wavelength of light
η= dielectric constant of material
B= layer thickness
34
©
Prisms
• When a beam of monochromatic light
passes through a prism, it is bent or
refracted.
• The amount of deviation depends upon
the wavelength, eg. Blue light being
refracted more than red.
• If white polychromatic light is substituted
for monochromatic light, a separation of
different wavelengths lead to the
formation of a spectrum from which a
required wavelength can be selected.
35
©
• Prisms are made up of quartz for use in UV region, since glass absorbs
wavelengths shorter than about 330 nm.
• Glass prisms are preferable for the visible region of the spectrum, as
the dispersion is much greater than that obtained with quartz.
• For the IR region, the transparent substances usually used are NaCl
(2– 15 μm), KBr (12-25μm), LiF (0.2-0.6μm), and CsBr (15-38μm).
• Prisms produce a non-linear dispersion, with long wavelengths being
less efficient separated than short wavelengths.
• The older spectrophotometers show larger divisions btw each nm in
the UV region than in the Visible region.
36
©
Gratings
• The dispersing element in the monochromator of
most modern UV, Vis, IR spectrophotometers is the
diffraction grating.
• It consists of a very large number of equispaced
lines (200-2000 per mm) ruled on a glass blank
coated with a thin film of aluminium.
• Parallel lines or grooves are chemically joined on a
thin layer of photoresist coated glass which
produces interference of light beams.
• They can be used as transmission gratings or when
aluminized can be used as reflection gratings.
• Rotation of grating permits appropriate
wavelengths of the spectrum to emerge from the
exit slit of the monochromator.
37
©
• The ruling of a grating can be shaped to
concentrate the light in certain orders
to give greater efficiency which is
especially imp in IR.
• A grating can be plane or concave.
• Concave gratings are capable of
focusing on its own spectra without the
use of lenses or mirrors.
• For convenience plane gratings are
used which can be made to cover all
spectral regions from 180 nm- 15 μm.
38
©
39
©
Sample Compartment
Ideal requirements:
• It should hold the sample and
should be made of substance which
are transparent in the region being
studied.
• It should be reproducible in path
length.
For example. Quartz cells in UV can
hold 3 ml sample with 1 cm
pathlength.
40
©
• Samples presented for the spectrometric analysis may be in the solid,
liquid or gaseous state.
• For the analysis of liquids and gases in the UV-Visible region above
323 nm, cells (or cuvettes) constructed with optically flat fused glass
may be used.
• Measurements below 325 nm (the UV cut off value of glass), requires
the use of more expensive fused silica cells, which are transparent to
below 180 nm.
• The standard path-length of cells for the measurements of molecular
absorption or fluorescence in the UV-visible region is 10 mm.
• The most common sample-containing materials in IR spectroscopy are
NaCl (2.5 – 17 μm) and KBr ( 2.5 – 30 μm).
41
©
Detector
Ideal requirement of the detectors:
• Respond to the radiant energy over a broad wavelength range.
• It should be sensitive to low levels of radiant power.
• It should respond rapidly to the radiation.
• It should produce an electrical signal that can rapidly be amplified and
the signal produced is directly proportional to the power of the
striking area.
42
©
Detectors
Commonly used detectors are:
• Barrier-layer cells
• Phototubes
• Photomultiplier tubes
• Photodiodes
• Thermocouples
• Bolometers
• Thermistors
• Golay detectors
43
©
Barrier-layer cell:
• One of the simplest detector.
• Advtg.
Requires no power supply but gives a current
which, under suitable conditions, is directly
proportional to the light intensity.
• Instrumentation:
It consists of a metallic plate, usually copper or
iron, upon which is deposited a layer of selenium
or sometimes copper oxide.
44
©
• An extremely thin layer of a good conducting metal, eg, silver, platinum
or copper, is formed over the selenium to act as one electrode, the
metallic plate acting as the other.
• Ordinarily, selenium and metallic oxides and sulphides have extremely
small electrical conductivities, the electrons being in energy levels at
stationary state that is they are not mobile.
• Light of suitable frequency, imparts sufficient energy to the electrons so
that they leave the selenium and enter the transparent metal layer.
• If 2 electrodes are now connected to the galvanometer, a current will
flow shown by the needle of galvanometer.
• If the resistance is small, the current produced is directly proportional to
the intensity of the light.
45
©
• The current output also depends upon the wavelength of the incident
light.
• With higher resistance, there would be loss of linearity.
• The useful working range of selenium photocells is 380- 780 nm.
• Demerits: lack of sensitivity
• Merits: Requires no power supply but gives a current which, under
suitable conditions, is directly proportional to the light intensity.
Cheapest and still used in colorimeters and flame photometers. 46
©
Phototubes:
oElectrons are liberated when light falls on a metal surface, and if this
is enclosed in an evacuated envelope and kept at a negative voltage, a
current which is proportional to the incident light can be drawn from
it.
oThe essential feature for a sensitive surface in these cells is that the
electrons should be liberated easily from the metal.
oElements of high atomic volume, eg. K or Cs, are commonly used and,
in order to increase the sensitivity, composite coatings such as Cs/
CsO2/ AgO2 have proved of more value than the metal alone.
oThe sensitive surface is enclosed in a high vacuum and forms the
cathode of the cell.
47
©
oApplication of a sufficiently high potential
between cathode and anode ensures that all the
electrons liberated by the action of light reach
the anode.
oA saturation photocurrent which exhibits a linear
relationship with the intensity of illumination is
then obtained.
oBy using different metals, the cells can be made
to respond to different regions of the spectrum.
oIn spectrophotometers 2 cells are usually used,
one being responsive to the UV and visible
radiation of wavelengths upto about 620 nm,
and the other to radiation of wavelengths 620-
1000nm.
48
©
oA modification of the above type of cell involves the inclusion of an
inert gas at a low pressure to give gas-filled cells.
oThe underlying principle is that the liberated electrons cause
ionization of the gas with consequent increase in the photocurrent
but, owing to the lack of linear response, the cells cannot be used in
instruments designed for accurate intensity measurement.
PHOTOMULTIPLIER tubes (PMTs)
In order to obtain greater sensitivity to very weak light intensities,
multiplication of the initial photoelectrons by secondary emission is
employed.
49
©
50
©
Several anodes at a gradually increasing potential are contained in 1
bulb.
Electrons from the photocathode are attracted to anode 1 and
liberate more electrons which travel to anode 2 because of its higher
potential relative to anode 1.
This process then continues to the last anode, and the result is a final
photocurrent 106-108 times greater than the primary current, which
still shows a linear response with increase in the intensity of
illumination.
PMT are ideal for measuring weak light intensities such as occur in
fluorescence and in the determination of trace elements by their
emission spectra.
51
©
The current from phototubes and PMTs never falls to zero.
A small residual current called dark current is produced, due to
spontaneous discharge at the high voltage of the dynodes or to the
thermal emission from the cathode.
PHOTODIODES
In essence, the diode is charged to a pre-set potential by a
continuously scanning electron beam.
If radiation impinges on the diode, the charge is depleted in
proportion to the intensity of the radiation.
When the electron beam scans again, a current in proportion to the
light intensity flows to recharge the diode to the preset voltage.
52
©
Photodiodes, like vacuum phototubes and PMTs, are single-channel
detectors, i.e. they monitor the total intensity of light and cannot
distinguish between different wavelengths.
A spectrum is obtained with single-channel detectors by varying the
monochromatic light passing through the sample.
When used in combination with a dispersing system each diode can
monitor the light intensity at a different wavelength, and the array
provides an almost instantaneous spectrum.
The multi-channel detector based upon linear diode arrays is of
particular advantage in monitoring fast reaction kinetics and eluate
(combination of mp and ana.) in HPLC.
53
©
Thermocouples
A thermocouple consists of elements of 2
different metals joined together at one end, the
other end being attached to a sensitive
galvanometer.
When radiant energy impinges on the junction
of the metals, a thermoelectromotive force is set
up which causes a current to flow.
 Thermocouples are used in the IR region, and to
assist in the complete absorption of the available
energy the ‘’hot’’ junction or receiver is usually
blackened.
54
©
Bolometers
These make use of the increase in
resistance of a metal with increase in
temperature.
Like thermocouples they are used in IR
region.
If 2 platinum foils are suitably incorporated
into a wheatstone bridge, and radiation is
allowed to fall on 1 foil, a change in
resistance is produced, which results in
current which is proportional to the
incident radiation.
55
©
Thermistors
• Its made of metal oxides.
• It functions by changing resistance
when heated.
• It consists of 2 closely placed
thermistor flakes, one of the 10 µm is
an active detector, while the other acts
the compensating/ reference detector.
• It is made of semi-conducting material
which has a high negative coefficient of
resistivity, i.e. the resistance decreases
with increase in temp. and this gives
the intensity of the IR radiation.
56
©
Golay detector
In this detector, the absorption of IR
radiation causes expansion of an
inert gas in a cell chamber.
One wall of the chamber consists of
a flexible mirror and the resulting
distortion varies the intensity of
illumination falling on a photocell
from a reflected beam of light.
The current from the photocell is
proportional to the incident
radiation.
57
©
Display system
• The signal from the detector is normally proportional to the intensity
of the light incident on the detector and after amplification may be
displayed as % transmittance or absorbance.
• There are 3 common systems for displaying the %T or absorbance, i.e.
a) Moving coil meter
b) Digital display
c) Strip chart recorder
58
©
Single beam spectrophotometers
• https://www.youtube.com/watch?v=XAp-5r3LxQo
• https://www.youtube.com/watch?v=pxC6F7bK8CU
59
©
Double beam spectrophotometer
• http://mas-iiith.vlabs.ac.in/exp1/expt1/instrument_animation.html
60
©
Principle of UV-Visible spectroscopy:
BEER-LAMBERT’S LAW:
When a beam of light is passed through a
transparent cell containing a solution of an
absorbing substance, reduction of the intensity of
the light may occur.
This is due to:
a) Reflections at the inner and outer surfaces of the
cell
b) Scatter by particles in the solution
c) Absorption of light by molecules in the solution.
61
©
• The reflections at the cell surfaces can be compensated by a
reference cell containing the solvent only, and scattering may be
eliminated by filtration of the solution.
• The intensity of the light absorbed is then given by:
I absorbed = I0 - IT
Where I0 is the original intensity on the cell
IT is the reduced intensity transmitted from the cell.
62
©
• The transmittance (T) is the ratio IT / I0 and the % transmittance (%T)
is given by:
%T = 100 IT / I0
• In 1760, lambert investigated the relationship between I0 and IT for
various thickness of substance and found that the rate of decrease in
the intensity of light with the thickness, b, of the medium is
proportional to the intensity of incident light.
• Expressed mathematically,
- db / dI α I
or – dI/ db = k’ I
where k’ is a proportionality constant
63
©
-db / dI = 1 / k’ I
Integrating, -b = 1/k’ lnIT + C
Where IT is the intensity transmitted at thickness b.
When b = 0,
C = - 1/k’ ln I0
Therefore, -b = 1/ k’ ln IT – 1/k’ ln I0
LnI0 / IT = k’b
64
©
On conversion to a common logarithm, the expression becomes
Log I0 / IT = k’b/ 2.303
The quantity log I0 / IT is called absorbance (A) and is equal to the reciprocal
of the common logarithm of transmittance.
A = Log 10 I0 / IT = log 10 (1/T) = -log T = 2 – log (%T)
Older terms for absorbance such as extinction, optical density, and
absorbancy are now obsolete.
65
©
• Lambert’s law is defined as:
The intensity of a beam of parallel monochromatic radiation decreases exponentially
as it passes through a medium of homogenous thickness.
More simply it is stated that the absorbance is proportional to the thickness
(pathlength) of the solution.
• Beer showed in 1852 that a similar relationship exists between the absorbance and
the concentration.
Log I0 / IT = k’’c/ 2.303
where k’’ is a proportionality constant and c is the concentration.
66
©
• Beer’s law is defined as follows:
The intensity of a beam of parallel monochromatic radiation decreases
exponentially with the number of absorbing molecules.
More simply stated that the absorbance is proportional to the
concentration.
A combination of the two laws yields the Beer-Lambert Law:
A = Log I0 / IT = abc
In which the proportionality constants k’/2.303 and k’’/2.303 are
combined as a single constant called absorptivity (a).
67
©
Molar absorptivity
• When c is in moles per liter, the constant is called molar absorptivity
(formerly called as molar extinction coefficient) and has the symbol ϵ.
• The equation therefore becomes,
A = ϵbc
The molar absorptivity at a specified wavelength of a substance in
solution is the absorbance at that wavelength of a mol/l solution in a 1
cm cell.
The units of ϵ are therefore 1 l/mol/cm
68
©
Specific absorbance
Another form of the beer-lambert proportionality constant is the
specific absorbance, which is the absorbance of a specified
concentration in a cell of specified pathlength.
The most common form is A (1%, 1cm), which is the absorbance of a
1 g/ 100 ml (1% w/v) solution in a 1 cm cell.
The beer-lambert equation therefore takes the form,
A = A 1cm bc
69
1%
©
Deviations from BL Law:
• Sample conditions
• Instrumental parameters
• Chemical effects
70
©
Common organic solvents with their cut-off values
71
©
oOne factor that influences the absorbance of a sample is the concentration
(c).
oThe expectation would be that, as the concentration goes up, more
radiation is absorbed and the absorbance goes up.
oTherefore, the absorbance is directly proportional to the concentration.
oA second factor is the path length (b).
oThe longer the path length, the more molecules there are in the path of the
beam of radiation, therefore the absorbance goes up.
oTherefore, the path length is directly proportional to the concentration
72
Concentration and pathlength
©
73
©
oFundamental requirement under BL-Law is:
Every photon of light striking the detector must have equal chances of
absorption.
oSuppose we want to measure some high concentrations, above the
usual linear range of calibration curve, without diluting the samples
and without shorter path-length cells
What will be the result?
The absorbance would be non-linear which means the maximum
absorbance value will shift from 1 to 2 because of stray light effects.
74
©
oIn order to reduce that if the wavelength is set to higher values the
linearity would be improved that’s bcz the stray light is lessened by
the reduced absorbance at the higher wavelength.
oThe intensity of light transmitted from an absorbing solution (IT) will
show small random fluctuations owing to small variations in the light
source intensity, detector and amplifier noise etc.
oConsequently, every absorbance value will have a small random error
associated with it.
oThe % relative error is the difference between the true conc. And that
calculated from the measured absorbance (δc) expressed as a % of
the true conc. (c):
75
©
% relative error = 100 δc/ c
oThe % relative error is dependent on the magnitude of the measured
absorbance and the type of detector used to measure the intensities
of light.
oFor modern instruments with a phototube detector, it may be shown
that the relative error is at minimum when abs is 0.869.
oThe optimum accuracy and precision are therefore obtained when
the absorbance is around 0.9.
oIn general practice, the abs values in range 0.3-1.5 are sufficiently
reliable, and the combination of cell path-length and conc. of analyte
should be adjusted to give an absorbance within this range.
76
©
Instrumental parameters
Slit width
It is the width (usually in mm) of the entrance and exit slits of the
monochromator.
The slits are rectangular apertures through which light enters inside
and exists from the monochromator.
Their purpose is to control the spectral resolution of the
monochromator, that is, it has the ability to separate close
wavelengths.
77
©
78
©
Light is focused onto the entrance slit B, is focused by concave mirror
C onto the grating D, which disperses the light according to
wavelength.
Concave mirror E then focuses the light on the exist slit F, forming a
spectrum across the exit slit.
Only the particular wavelength that falls directly on the exit slit
passes through it and is detected.
Adjusting the rotating angle of the grating changes the wavelength
that passes through the exist slit.
In a standard monochromator design, the entrance slits and exist slits
have equal width.
79
©
The wider the slit widths, the larger the range of wavelengths that
passes through the monochromator.
Most research-grade instruments have user-controllable slit widths.
In general, smaller (narrower) slit widths yield greater spectral
resolution but cut down the amount of light that is transmitted
through the monochromator.
In an Absorption spectrophotometer, a monochromator is used to
limit the wavelength range of light passed through the sample to that
which can be absorbed by the sample.
In the most common arrangement, the light source is focused onto
the entrance slit and the absorbing sample is placed immediately
after the exist slit, with the photodetector exactly behind it to detect
the intensity of transmitted light.
80
©
What is the optimum slit width for
absorption spectroscopy?
The answer to this question depends on the purpose of the
measurement.
If the purpose is to record an accurate absorption spectrum, for
example, for use as a reference spectrum for future measurements or
for identification, then a sufficiently small slit width must be used to
avoid the polychromaticity deviation from the BL-law.
The requirement is that the spectral bandpass be small compared to
the spectral width of the absorber.
The monochromaticity or spectral purity of the light incident on the
sample cell is defined by the spectral bandwidth, which is the width
of the triangle (in nm) at one half of the peak intensity.
81
©
Difference between spectral bandwidth,
spectral bandpass and slit width
• The spectral bandwidth is defined as the width of the band of light at
one-half the peak maximum (or full width at half maximum [FWHM])
• Spectral bandpass is the FWHM of the wavelength distribution
passed by the exit slit. Resolution is related to bandpass but
determines whether the separation of two peaks can be
distinguished.
82
©
83
©
In a dispersive instrument, the spectral bandpass is given by the
product of the slitwidth (sw) and the linear dispersion (LD).
The slit-width is user-variable in many instruments, whereas the LD is
fixed by the design of the monochromator. So, the SW is adjustable,
setting it to the smallest slit width will insure the smallest spectral
bandpass and result in the minimum polychromaticity error.
However, the signal-to-noise ratio decreases as the slit width is
reduced, so it is not always practical to use the smallest slit width
possible.
A smallest slit width, even if it is possible on that spectrometer, will
not be useful if the random signal-to-noise error exceeds the error
caused by non-linearity.
84
©
The effect that increasing slitwidth has on measured absorbance value
depends on the width of the absorption band and on whether the
wavelength of measurement corresponds with a maximum or minimum
absorbance.
The width of the absorption band is defined as natural bandwidth, which is
the width of the absorption band at one half the A max.
Furthermore, as the absorbance increases due to higher conc. Or longer
pathlengths, the % error increases, resulting in a negative deviation from
the BL-Law.
If the slit width is too narrow, the resultant reduction of the incident
energy lowers the signal to noise ratio and decreases the precision of the
measurement.
The optimum slitwidth is therefore the widest setting that provides
spectral fidelity.
85
©
Scanning speed
• If the scan speed selected for the automatic recording of the
spectrum is too fast, electronic and mechanical damping of the
spectrophotometer’s signal to the recorder may prevent the recorder
pen responding quickly enough to the rapid changes of absorbance.
• The effects observed in progressively faster replicate scans of an
absorption spectrum are that the apparent lambda max is displaced
in the direction of the scan, Amax are decreased, Amin are increased
and the resolution btw adjacent bands is reduced.
• The optimum scan speed is normally the fastest speed that maintains
the pen fidelity.
86
©
87
©
Stray light
Any radiation reaching the photodetector other than
the narrow range of wavelengths normally transmitted
by the monochromator.
It arises from scattering and refraction inside the
monochromator, due to mainly imperfections on the
optical surface.
If stray light comprises wavelengths which the sample
does not absorb, it will fall on the photocell during the
measurement of the intensity of both the incident
light (Io) and unabsorbed light (IT). Thus, the observed
absorbances is given by:
Aobs = log [Io+ SL/ IT + SL]
88
©
89
 The effect of stray light is
particularly evident at high
absorbances, i.e. when IT is
low, where deviation from the
BL-Law may be observed.
 This figure shows the effect of
increasing levels of stray light
on a Beer’s law plot.
©
It should be noted that the
spectrophotometer cannot measure
absorbances greater than that corresponding
with the level of stray light.
For example, if the unabsorbed stray light is
equivalent to 1% of the intensity of light at a
particular wavelength, the limiting value of
Aobs is 2 (approximately). 90
©
The effect of stray light may also be seen at wavelengths near the
extremes of the usual wavelength range of light sources, where the
available energy is low.
For example, the intensity of light from a Deuterium lamp below 220
nm decreases rapidly with decreasing wavelength.
Unabsorbed stray light of higher wavelengths may reduced the
absorbance sufficiently for a spurious maximum which are common
below 220 nm and may be detected by marked deviations in Beer’s
law when solutions of different conc. are examined.
Alternatively, stray light at a particular wavelength can be detected by
placing the solution of a substance that is known to absorb
completely at that wavelength.
91
©
Observed absorbances other than infinite absorbance (%T = 0)
confirms the presence of stray light.
Chemical effects
Deviations from BL-Law may occur if the substance undergoes
chemical changes (e.g. dissociation, association, polymerization,
complex formation) as a result of the variation of conc.
For example, a solution of benzoic acid high conc. In a simple
unbuffered aqueous solution has a low pH and contains a higher
proportion of the unionized form than a solution of low conc.
92
©
• The ionized and unionized forms of benzoic acid have different
absorption characteristics:
λmax = 273 nm λmax = 268 nm
ε273 = 970 ε268 = 560
Therefore, increasing the conc. of benzoic acid produces higher
absorpitivity values at 273 nm with positive deviation from BL, and
lower absorpitivity values at 268 nm with negative deviation from
beer’s law.
93
C6H5COOHC6H5COOH
©
References
• Beckett and Stenlake, 5th Ed., CBS publishers
• YR Sharma, Introduction to spectroscopy
• Pavia, Introduction to spectroscopy
• https://commons.wikimedia.org/wiki/File:Bohr_atom_animation.gif
• https://www.priyamstudycentre.com/2019/02/hydrogen-
spectrum.html
• https://www.edinst.com/blog/jablonski-diagram/
94
©
95
©

More Related Content

What's hot

FLUORIMETRY
FLUORIMETRYFLUORIMETRY
Instrumentation of uv visible spectroscopy
Instrumentation of uv visible spectroscopyInstrumentation of uv visible spectroscopy
Instrumentation of uv visible spectroscopy
Zainab&Sons
 
Fluorimetery.
Fluorimetery.Fluorimetery.
Fluorimetery.
yogeeta Goyat
 
Partition column-chromatography
Partition column-chromatographyPartition column-chromatography
Partition column-chromatography
Asif - A - Khuda Pappu
 
Infrared instrumentation
Infrared instrumentationInfrared instrumentation
Infrared instrumentation
NIPER MOHALI
 
Nephelometry and turbidimetry
Nephelometry and turbidimetryNephelometry and turbidimetry
Nephelometry and turbidimetry
Muhammad Asif Shaheeen
 
Ion exchange chromatography - by Shree
Ion   exchange chromatography - by ShreeIon   exchange chromatography - by Shree
Ion exchange chromatography - by Shree
ShrikantDivekar
 
UV-Visible spectroscopy
UV-Visible spectroscopyUV-Visible spectroscopy
UV-Visible spectroscopy
Divya V
 
Factors affecting fluorescence intensity(pharmaceutical analysis)
Factors affecting fluorescence intensity(pharmaceutical analysis)Factors affecting fluorescence intensity(pharmaceutical analysis)
Factors affecting fluorescence intensity(pharmaceutical analysis)
MdIrfanUddin2
 
Nepheloturbidometry.pptx
Nepheloturbidometry.pptxNepheloturbidometry.pptx
Nepheloturbidometry.pptx
NIDHI GUPTA
 
Fluorimetry presentation
Fluorimetry presentationFluorimetry presentation
Fluorimetry presentation
Vinass Jamali
 
UV-Visible Spectroscopy
UV-Visible SpectroscopyUV-Visible Spectroscopy
UV-Visible SpectroscopySudha Reddy
 
Infrared spectroscopy
Infrared spectroscopy Infrared spectroscopy
Infrared spectroscopy
Prachi Pathak
 
Mucosal drug delivery system
Mucosal drug delivery systemMucosal drug delivery system
Mucosal drug delivery system
Pranali Palandurkar
 
Detectors used in HPLC
Detectors used in HPLCDetectors used in HPLC
Detectors used in HPLC
Argha Sen
 
GEL CHROMATOGRAPHY
GEL CHROMATOGRAPHYGEL CHROMATOGRAPHY
INSTRUMENTATION OF UV-VISIBLE SPECTROPHOTOMETRY
INSTRUMENTATION OF UV-VISIBLE SPECTROPHOTOMETRYINSTRUMENTATION OF UV-VISIBLE SPECTROPHOTOMETRY
INSTRUMENTATION OF UV-VISIBLE SPECTROPHOTOMETRY
Ashwini Somayaji
 
Gastro retentive drug delivery system (GRDDS)
Gastro retentive drug delivery system (GRDDS)Gastro retentive drug delivery system (GRDDS)
Gastro retentive drug delivery system (GRDDS)
Shweta Nehate
 
UV-Visible spectroscopy
UV-Visible spectroscopyUV-Visible spectroscopy
UV-Visible spectroscopy
MehulJain143
 

What's hot (20)

FLUORIMETRY
FLUORIMETRYFLUORIMETRY
FLUORIMETRY
 
Instrumentation of uv visible spectroscopy
Instrumentation of uv visible spectroscopyInstrumentation of uv visible spectroscopy
Instrumentation of uv visible spectroscopy
 
Fluorimetery.
Fluorimetery.Fluorimetery.
Fluorimetery.
 
Partition column-chromatography
Partition column-chromatographyPartition column-chromatography
Partition column-chromatography
 
Infrared instrumentation
Infrared instrumentationInfrared instrumentation
Infrared instrumentation
 
Nephelometry and turbidimetry
Nephelometry and turbidimetryNephelometry and turbidimetry
Nephelometry and turbidimetry
 
Ion exchange chromatography - by Shree
Ion   exchange chromatography - by ShreeIon   exchange chromatography - by Shree
Ion exchange chromatography - by Shree
 
UV-Visible spectroscopy
UV-Visible spectroscopyUV-Visible spectroscopy
UV-Visible spectroscopy
 
Factors affecting fluorescence intensity(pharmaceutical analysis)
Factors affecting fluorescence intensity(pharmaceutical analysis)Factors affecting fluorescence intensity(pharmaceutical analysis)
Factors affecting fluorescence intensity(pharmaceutical analysis)
 
Nepheloturbidometry.pptx
Nepheloturbidometry.pptxNepheloturbidometry.pptx
Nepheloturbidometry.pptx
 
Fluorimetry
FluorimetryFluorimetry
Fluorimetry
 
Fluorimetry presentation
Fluorimetry presentationFluorimetry presentation
Fluorimetry presentation
 
UV-Visible Spectroscopy
UV-Visible SpectroscopyUV-Visible Spectroscopy
UV-Visible Spectroscopy
 
Infrared spectroscopy
Infrared spectroscopy Infrared spectroscopy
Infrared spectroscopy
 
Mucosal drug delivery system
Mucosal drug delivery systemMucosal drug delivery system
Mucosal drug delivery system
 
Detectors used in HPLC
Detectors used in HPLCDetectors used in HPLC
Detectors used in HPLC
 
GEL CHROMATOGRAPHY
GEL CHROMATOGRAPHYGEL CHROMATOGRAPHY
GEL CHROMATOGRAPHY
 
INSTRUMENTATION OF UV-VISIBLE SPECTROPHOTOMETRY
INSTRUMENTATION OF UV-VISIBLE SPECTROPHOTOMETRYINSTRUMENTATION OF UV-VISIBLE SPECTROPHOTOMETRY
INSTRUMENTATION OF UV-VISIBLE SPECTROPHOTOMETRY
 
Gastro retentive drug delivery system (GRDDS)
Gastro retentive drug delivery system (GRDDS)Gastro retentive drug delivery system (GRDDS)
Gastro retentive drug delivery system (GRDDS)
 
UV-Visible spectroscopy
UV-Visible spectroscopyUV-Visible spectroscopy
UV-Visible spectroscopy
 

Similar to Instrumental Methods of Analysis

Introduction of spectroscopy
Introduction of spectroscopyIntroduction of spectroscopy
Introduction of spectroscopy
Zainab&Sons
 
Chapter 1 ultraviolet Spectroscopy 1.pdf
Chapter 1 ultraviolet Spectroscopy 1.pdfChapter 1 ultraviolet Spectroscopy 1.pdf
Chapter 1 ultraviolet Spectroscopy 1.pdf
hend49
 
Spectroscopy basics
Spectroscopy basicsSpectroscopy basics
Spectroscopy basics
Ashfaq Ahmad
 
UV Visible Spectroscopy
UV Visible SpectroscopyUV Visible Spectroscopy
UV Visible Spectroscopy
krishslide
 
1. UV- Visible spectrophotometry.pdf
1. UV- Visible spectrophotometry.pdf1. UV- Visible spectrophotometry.pdf
1. UV- Visible spectrophotometry.pdf
JibrilAliSe
 
CHM260 - Spectroscopy Method
CHM260 - Spectroscopy MethodCHM260 - Spectroscopy Method
CHM260 - Spectroscopy MethodAlia Najiha
 
UV- VISIBLE SPECTROSCOPY BY Ann
UV- VISIBLE SPECTROSCOPY BY AnnUV- VISIBLE SPECTROSCOPY BY Ann
UV- VISIBLE SPECTROSCOPY BY Ann
Anjali Rarichan
 
Electron spin resonance spectroscopy
Electron spin resonance spectroscopy Electron spin resonance spectroscopy
Electron spin resonance spectroscopy
sunp994
 
Visible and ultraviolet spectroscopy
Visible and ultraviolet spectroscopyVisible and ultraviolet spectroscopy
Visible and ultraviolet spectroscopy
Rawat DA Greatt
 
Spectroscpoic techniques
Spectroscpoic techniquesSpectroscpoic techniques
Spectroscpoic techniques
navaneethapulijala
 
NMR spectroscopy
NMR spectroscopy NMR spectroscopy
NMR spectroscopy
AnukrittiMehra
 
Uv
UvUv
Electron Spin Resonance Spectroscopy by arju
Electron Spin Resonance Spectroscopy by arjuElectron Spin Resonance Spectroscopy by arju
Electron Spin Resonance Spectroscopy by arju
Arjun kumar
 
ESR Spectrophotometry
ESR SpectrophotometryESR Spectrophotometry
ESR Spectrophotometry
pragneshchandan
 
Electron spin resonance(ESR) spectroscopy
Electron spin resonance(ESR) spectroscopyElectron spin resonance(ESR) spectroscopy
Electron spin resonance(ESR) spectroscopy
Preeti Choudhary
 
UV-Vis 0422034001_Md. Ershad Khan.pptx
UV-Vis 0422034001_Md. Ershad Khan.pptxUV-Vis 0422034001_Md. Ershad Khan.pptx
UV-Vis 0422034001_Md. Ershad Khan.pptx
MdErshadKhan
 
Uv visible spectroscopy by dr. pamod r. padole
Uv visible spectroscopy by dr. pamod r. padoleUv visible spectroscopy by dr. pamod r. padole
Uv visible spectroscopy by dr. pamod r. padole
pramod padole
 
2 spectra and energy levels
2 spectra and energy levels2 spectra and energy levels
2 spectra and energy levelsMissingWaldo
 
Analytical Chemistry
Analytical ChemistryAnalytical Chemistry
Analytical Chemistry
Sidra Javed
 

Similar to Instrumental Methods of Analysis (20)

Introduction of spectroscopy
Introduction of spectroscopyIntroduction of spectroscopy
Introduction of spectroscopy
 
Chapter 1 ultraviolet Spectroscopy 1.pdf
Chapter 1 ultraviolet Spectroscopy 1.pdfChapter 1 ultraviolet Spectroscopy 1.pdf
Chapter 1 ultraviolet Spectroscopy 1.pdf
 
Spectroscopy basics
Spectroscopy basicsSpectroscopy basics
Spectroscopy basics
 
UV Visible Spectroscopy
UV Visible SpectroscopyUV Visible Spectroscopy
UV Visible Spectroscopy
 
1. UV- Visible spectrophotometry.pdf
1. UV- Visible spectrophotometry.pdf1. UV- Visible spectrophotometry.pdf
1. UV- Visible spectrophotometry.pdf
 
CHM260 - Spectroscopy Method
CHM260 - Spectroscopy MethodCHM260 - Spectroscopy Method
CHM260 - Spectroscopy Method
 
UV- VISIBLE SPECTROSCOPY BY Ann
UV- VISIBLE SPECTROSCOPY BY AnnUV- VISIBLE SPECTROSCOPY BY Ann
UV- VISIBLE SPECTROSCOPY BY Ann
 
Electron spin resonance spectroscopy
Electron spin resonance spectroscopy Electron spin resonance spectroscopy
Electron spin resonance spectroscopy
 
Visible and ultraviolet spectroscopy
Visible and ultraviolet spectroscopyVisible and ultraviolet spectroscopy
Visible and ultraviolet spectroscopy
 
Spectroscpoic techniques
Spectroscpoic techniquesSpectroscpoic techniques
Spectroscpoic techniques
 
NMR spectroscopy
NMR spectroscopy NMR spectroscopy
NMR spectroscopy
 
Uv
UvUv
Uv
 
Electron Spin Resonance Spectroscopy by arju
Electron Spin Resonance Spectroscopy by arjuElectron Spin Resonance Spectroscopy by arju
Electron Spin Resonance Spectroscopy by arju
 
NMR Spectroscopy
NMR SpectroscopyNMR Spectroscopy
NMR Spectroscopy
 
ESR Spectrophotometry
ESR SpectrophotometryESR Spectrophotometry
ESR Spectrophotometry
 
Electron spin resonance(ESR) spectroscopy
Electron spin resonance(ESR) spectroscopyElectron spin resonance(ESR) spectroscopy
Electron spin resonance(ESR) spectroscopy
 
UV-Vis 0422034001_Md. Ershad Khan.pptx
UV-Vis 0422034001_Md. Ershad Khan.pptxUV-Vis 0422034001_Md. Ershad Khan.pptx
UV-Vis 0422034001_Md. Ershad Khan.pptx
 
Uv visible spectroscopy by dr. pamod r. padole
Uv visible spectroscopy by dr. pamod r. padoleUv visible spectroscopy by dr. pamod r. padole
Uv visible spectroscopy by dr. pamod r. padole
 
2 spectra and energy levels
2 spectra and energy levels2 spectra and energy levels
2 spectra and energy levels
 
Analytical Chemistry
Analytical ChemistryAnalytical Chemistry
Analytical Chemistry
 

Recently uploaded

Charaka Samhita Sutra Sthana 9 Chapter khuddakachatuspadadhyaya
Charaka Samhita Sutra Sthana 9 Chapter khuddakachatuspadadhyayaCharaka Samhita Sutra Sthana 9 Chapter khuddakachatuspadadhyaya
Charaka Samhita Sutra Sthana 9 Chapter khuddakachatuspadadhyaya
Dr KHALID B.M
 
Are There Any Natural Remedies To Treat Syphilis.pdf
Are There Any Natural Remedies To Treat Syphilis.pdfAre There Any Natural Remedies To Treat Syphilis.pdf
Are There Any Natural Remedies To Treat Syphilis.pdf
Little Cross Family Clinic
 
The hemodynamic and autonomic determinants of elevated blood pressure in obes...
The hemodynamic and autonomic determinants of elevated blood pressure in obes...The hemodynamic and autonomic determinants of elevated blood pressure in obes...
The hemodynamic and autonomic determinants of elevated blood pressure in obes...
Catherine Liao
 
Report Back from SGO 2024: What’s the Latest in Cervical Cancer?
Report Back from SGO 2024: What’s the Latest in Cervical Cancer?Report Back from SGO 2024: What’s the Latest in Cervical Cancer?
Report Back from SGO 2024: What’s the Latest in Cervical Cancer?
bkling
 
Prix Galien International 2024 Forum Program
Prix Galien International 2024 Forum ProgramPrix Galien International 2024 Forum Program
Prix Galien International 2024 Forum Program
Levi Shapiro
 
BENIGN PROSTATIC HYPERPLASIA.BPH. BPHpdf
BENIGN PROSTATIC HYPERPLASIA.BPH. BPHpdfBENIGN PROSTATIC HYPERPLASIA.BPH. BPHpdf
BENIGN PROSTATIC HYPERPLASIA.BPH. BPHpdf
DR SETH JOTHAM
 
Evaluation of antidepressant activity of clitoris ternatea in animals
Evaluation of antidepressant activity of clitoris ternatea in animalsEvaluation of antidepressant activity of clitoris ternatea in animals
Evaluation of antidepressant activity of clitoris ternatea in animals
Shweta
 
Alcohol_Dr. Jeenal Mistry MD Pharmacology.pdf
Alcohol_Dr. Jeenal Mistry MD Pharmacology.pdfAlcohol_Dr. Jeenal Mistry MD Pharmacology.pdf
Alcohol_Dr. Jeenal Mistry MD Pharmacology.pdf
Dr Jeenal Mistry
 
Lung Cancer: Artificial Intelligence, Synergetics, Complex System Analysis, S...
Lung Cancer: Artificial Intelligence, Synergetics, Complex System Analysis, S...Lung Cancer: Artificial Intelligence, Synergetics, Complex System Analysis, S...
Lung Cancer: Artificial Intelligence, Synergetics, Complex System Analysis, S...
Oleg Kshivets
 
micro teaching on communication m.sc nursing.pdf
micro teaching on communication m.sc nursing.pdfmicro teaching on communication m.sc nursing.pdf
micro teaching on communication m.sc nursing.pdf
Anurag Sharma
 
TEST BANK for Operations Management, 14th Edition by William J. Stevenson, Ve...
TEST BANK for Operations Management, 14th Edition by William J. Stevenson, Ve...TEST BANK for Operations Management, 14th Edition by William J. Stevenson, Ve...
TEST BANK for Operations Management, 14th Edition by William J. Stevenson, Ve...
kevinkariuki227
 
heat stroke and heat exhaustion in children
heat stroke and heat exhaustion in childrenheat stroke and heat exhaustion in children
heat stroke and heat exhaustion in children
SumeraAhmad5
 
Physiology of Chemical Sensation of smell.pdf
Physiology of Chemical Sensation of smell.pdfPhysiology of Chemical Sensation of smell.pdf
Physiology of Chemical Sensation of smell.pdf
MedicoseAcademics
 
Charaka Samhita Sutra sthana Chapter 15 Upakalpaniyaadhyaya
Charaka Samhita Sutra sthana Chapter 15 UpakalpaniyaadhyayaCharaka Samhita Sutra sthana Chapter 15 Upakalpaniyaadhyaya
Charaka Samhita Sutra sthana Chapter 15 Upakalpaniyaadhyaya
Dr KHALID B.M
 
Antiulcer drugs Advance Pharmacology .pptx
Antiulcer drugs Advance Pharmacology .pptxAntiulcer drugs Advance Pharmacology .pptx
Antiulcer drugs Advance Pharmacology .pptx
Rohit chaurpagar
 
Superficial & Deep Fascia of the NECK.pptx
Superficial & Deep Fascia of the NECK.pptxSuperficial & Deep Fascia of the NECK.pptx
Superficial & Deep Fascia of the NECK.pptx
Dr. Rabia Inam Gandapore
 
Flu Vaccine Alert in Bangalore Karnataka
Flu Vaccine Alert in Bangalore KarnatakaFlu Vaccine Alert in Bangalore Karnataka
Flu Vaccine Alert in Bangalore Karnataka
addon Scans
 
Pulmonary Thromboembolism - etilogy, types, medical- Surgical and nursing man...
Pulmonary Thromboembolism - etilogy, types, medical- Surgical and nursing man...Pulmonary Thromboembolism - etilogy, types, medical- Surgical and nursing man...
Pulmonary Thromboembolism - etilogy, types, medical- Surgical and nursing man...
VarunMahajani
 
MANAGEMENT OF ATRIOVENTRICULAR CONDUCTION BLOCK.pdf
MANAGEMENT OF ATRIOVENTRICULAR CONDUCTION BLOCK.pdfMANAGEMENT OF ATRIOVENTRICULAR CONDUCTION BLOCK.pdf
MANAGEMENT OF ATRIOVENTRICULAR CONDUCTION BLOCK.pdf
Jim Jacob Roy
 
Ocular injury ppt Upendra pal optometrist upums saifai etawah
Ocular injury  ppt  Upendra pal  optometrist upums saifai etawahOcular injury  ppt  Upendra pal  optometrist upums saifai etawah
Ocular injury ppt Upendra pal optometrist upums saifai etawah
pal078100
 

Recently uploaded (20)

Charaka Samhita Sutra Sthana 9 Chapter khuddakachatuspadadhyaya
Charaka Samhita Sutra Sthana 9 Chapter khuddakachatuspadadhyayaCharaka Samhita Sutra Sthana 9 Chapter khuddakachatuspadadhyaya
Charaka Samhita Sutra Sthana 9 Chapter khuddakachatuspadadhyaya
 
Are There Any Natural Remedies To Treat Syphilis.pdf
Are There Any Natural Remedies To Treat Syphilis.pdfAre There Any Natural Remedies To Treat Syphilis.pdf
Are There Any Natural Remedies To Treat Syphilis.pdf
 
The hemodynamic and autonomic determinants of elevated blood pressure in obes...
The hemodynamic and autonomic determinants of elevated blood pressure in obes...The hemodynamic and autonomic determinants of elevated blood pressure in obes...
The hemodynamic and autonomic determinants of elevated blood pressure in obes...
 
Report Back from SGO 2024: What’s the Latest in Cervical Cancer?
Report Back from SGO 2024: What’s the Latest in Cervical Cancer?Report Back from SGO 2024: What’s the Latest in Cervical Cancer?
Report Back from SGO 2024: What’s the Latest in Cervical Cancer?
 
Prix Galien International 2024 Forum Program
Prix Galien International 2024 Forum ProgramPrix Galien International 2024 Forum Program
Prix Galien International 2024 Forum Program
 
BENIGN PROSTATIC HYPERPLASIA.BPH. BPHpdf
BENIGN PROSTATIC HYPERPLASIA.BPH. BPHpdfBENIGN PROSTATIC HYPERPLASIA.BPH. BPHpdf
BENIGN PROSTATIC HYPERPLASIA.BPH. BPHpdf
 
Evaluation of antidepressant activity of clitoris ternatea in animals
Evaluation of antidepressant activity of clitoris ternatea in animalsEvaluation of antidepressant activity of clitoris ternatea in animals
Evaluation of antidepressant activity of clitoris ternatea in animals
 
Alcohol_Dr. Jeenal Mistry MD Pharmacology.pdf
Alcohol_Dr. Jeenal Mistry MD Pharmacology.pdfAlcohol_Dr. Jeenal Mistry MD Pharmacology.pdf
Alcohol_Dr. Jeenal Mistry MD Pharmacology.pdf
 
Lung Cancer: Artificial Intelligence, Synergetics, Complex System Analysis, S...
Lung Cancer: Artificial Intelligence, Synergetics, Complex System Analysis, S...Lung Cancer: Artificial Intelligence, Synergetics, Complex System Analysis, S...
Lung Cancer: Artificial Intelligence, Synergetics, Complex System Analysis, S...
 
micro teaching on communication m.sc nursing.pdf
micro teaching on communication m.sc nursing.pdfmicro teaching on communication m.sc nursing.pdf
micro teaching on communication m.sc nursing.pdf
 
TEST BANK for Operations Management, 14th Edition by William J. Stevenson, Ve...
TEST BANK for Operations Management, 14th Edition by William J. Stevenson, Ve...TEST BANK for Operations Management, 14th Edition by William J. Stevenson, Ve...
TEST BANK for Operations Management, 14th Edition by William J. Stevenson, Ve...
 
heat stroke and heat exhaustion in children
heat stroke and heat exhaustion in childrenheat stroke and heat exhaustion in children
heat stroke and heat exhaustion in children
 
Physiology of Chemical Sensation of smell.pdf
Physiology of Chemical Sensation of smell.pdfPhysiology of Chemical Sensation of smell.pdf
Physiology of Chemical Sensation of smell.pdf
 
Charaka Samhita Sutra sthana Chapter 15 Upakalpaniyaadhyaya
Charaka Samhita Sutra sthana Chapter 15 UpakalpaniyaadhyayaCharaka Samhita Sutra sthana Chapter 15 Upakalpaniyaadhyaya
Charaka Samhita Sutra sthana Chapter 15 Upakalpaniyaadhyaya
 
Antiulcer drugs Advance Pharmacology .pptx
Antiulcer drugs Advance Pharmacology .pptxAntiulcer drugs Advance Pharmacology .pptx
Antiulcer drugs Advance Pharmacology .pptx
 
Superficial & Deep Fascia of the NECK.pptx
Superficial & Deep Fascia of the NECK.pptxSuperficial & Deep Fascia of the NECK.pptx
Superficial & Deep Fascia of the NECK.pptx
 
Flu Vaccine Alert in Bangalore Karnataka
Flu Vaccine Alert in Bangalore KarnatakaFlu Vaccine Alert in Bangalore Karnataka
Flu Vaccine Alert in Bangalore Karnataka
 
Pulmonary Thromboembolism - etilogy, types, medical- Surgical and nursing man...
Pulmonary Thromboembolism - etilogy, types, medical- Surgical and nursing man...Pulmonary Thromboembolism - etilogy, types, medical- Surgical and nursing man...
Pulmonary Thromboembolism - etilogy, types, medical- Surgical and nursing man...
 
MANAGEMENT OF ATRIOVENTRICULAR CONDUCTION BLOCK.pdf
MANAGEMENT OF ATRIOVENTRICULAR CONDUCTION BLOCK.pdfMANAGEMENT OF ATRIOVENTRICULAR CONDUCTION BLOCK.pdf
MANAGEMENT OF ATRIOVENTRICULAR CONDUCTION BLOCK.pdf
 
Ocular injury ppt Upendra pal optometrist upums saifai etawah
Ocular injury  ppt  Upendra pal  optometrist upums saifai etawahOcular injury  ppt  Upendra pal  optometrist upums saifai etawah
Ocular injury ppt Upendra pal optometrist upums saifai etawah
 

Instrumental Methods of Analysis

  • 1. Basics of spectroscopy, Jablonski diagram, Instrumentation of UV-Visible Spectrometer, Beer-Lambert’s law and its deviation Shweta Mishra, M. Pharm (Pharmaceutical Chemistry) shweta.mishra@saip.ac.in Sri Aurobindo Institute of Pharmacy, Indore-Ujjain State Highway, Indore, Madhya Pradesh 453555 1 ©
  • 2. ADVANTAGES OF INSTRUMENTAL METHODS OVER CHEMICAL ONES • Speed (can be automated, sample throughput is high) • Sensitivity (trace or ultra-trace analysis is possible) • Selectivity (accurate in the presence of many other components) • Reproducibility (reliable, objective) • Sample requirement is small (ml or mg or less can be handled) DISADVANTAGES • Cost • Complexity • Maintenance 2 ©
  • 3. Introduction to the electronic structure of the atoms • In 1904 Sir JJ Thomson proposed the theory of matter. He pictured the positive charge of an atom distributed uniformly throughout a sphere of protons and neutrons and the negative charge was surrounding it in a jelly like fashion. • Rutherford modified this theory that electrons revolves around the nucleus in such a way that the centrifugal force exactly balances the inward attractive force much like our planets to around the sun. Hence regardless of their speed, they enter the nucleus. Moreover the electron losing energy would omit continuous radiation without any sharp breaks. • In 1903, Bohr proposed a radically different view of the atomic a structure based on the optical spectrum of hydrogen. He included the postulates of quantum theory proposed by Max Planck. 3 ©
  • 4. Introduction to the electronic structure of the atoms • Bohr proposed that the electron in a hydrogen atom always described a fixed circular path around the nucleus. Search orbits named ‘stationary states' maybe thought of various circles differing in radius. • The angular momentum of each stationary state was an integral multiple of N.H/2П which amounts to angular momentum. • The angular momentum mvr is given by the formula: mvr = N (H/2П) where N is an integer called a quantum number 4 ©
  • 5. • He also postulated that as long as the electron remained in a given orbit it neither radiates nor absorbs energy. When the electron moves from one orbit to another it was considered to involve the absorption or emission of definite quantity of energy depending upon whether the electron moved from lower state to higher one or vice versa. This energy manifests as radiation and the frequency of such radiation is manifests as a spectral line which could be related to the energies of electron in the two states E1 and E2: • E2 - E1 = hυ 5 ©
  • 6. • Line spectra appear in two forms, absorption spectra, showing dark lines on a bright background, and emission spectra with bright lines on a dark or black background. • These two types are in fact related and arise due to quantum mechanical interactions between electrons orbiting atoms and photons of light. • Photons of light each have a specific frequency. • The energy of a photon is a function of its frequency and is determined by: E = hf where f is the frequency of the photon, E is the energy and h is Planck's constant (= 6.626 x 10⁻³⁴J.s) Production of Line Spectra 6 ©
  • 7. • An electron orbits around a nucleus in a stable energy level. If a photon of a specific frequency interacts with the electron, it can gain sufficient energy to "jump up" one or more levels. The photon is absorbed by the electron so cannot continue on to be detected by an observer. The electron then "de-excites" and jumps back down to a lower energy orbit, emitting a photon of specific frequency. This photon, however, could be emitted in any direction, not just in the same direction as the original incident photon. • The Balmer series of visible lines for atomic hydrogen are caused by transitions from the n = 2 orbit to and from higher orbits. This is shown schematically in the diagram for the Bohr model of the atom. The Lyman Series involves transitions down to the n = 1 orbit and involve higher frequency photons in the UV region whilst the Paschen Series (to n = 3) produces IR spectral lines. 7 ©
  • 8. Spectroscopy • It is the branch of science dealing with the interaction of electromagnetic radiations with matter in quantized that is specific energy levels. It refers to the study of how radiated energy and matter interacts e.g. UV- Visible spectroscopy, IR and NMR spectroscopy etc. 8 ©
  • 9. Spectroscopy? Spectrogram? Spectrometry? Spectrograph? The measurement of a specific spectrum The machine for recording spectra 9 ©
  • 10. SPECTROSCOPY Atomic Spectroscopy Molecular Spectroscopy Absorption Emission Absorption Emission AAS Flame emission/ Flame photometry UV, IR, NMR, Electron spin resonance spectra, Raman spectra Flourimetry, Phosphorimetry 10 ©
  • 11. The absorption and emission spectrum concept 11 ©
  • 12. The origin of UV band • If energy is supplied to the sample, for example, by passing electromagnetic radiation through it, the sample atoms or molecules may absorb energy and be promoted into the higher energy level. • For an atom that absorbs in the UV, the absorption spectrum sometimes consist of very sharp lines as would be expected for a quantized process occurring between two discrete energy levels. • For molecules, however, the UV absorption usually occurs over a wide range of wavelengths, because molecules (as opposed to atoms) normally have many excited modes of vibration and rotation at room temperature. In fact, the vibration of molecules has many states of vibrational and rotational excitation. 12 ©
  • 13. The energy levels for these states are quite closely spaced, corresponding to energy differences considerably smaller than those of electronic levels. The rotational and vibrational levels are thus superimposed on the electronic levels. A molecule can therefore undergo electronic and vibrational rotational excitation simultaneously. Because there are so many possible transitions, each differing from the others by only a slight amount, each transition consists of a vast number of lines spaced so closely that the spectrophotometer cannot resolve them and usually consider them as a broad band of absorption centered near the wavelength of the major transition in UV spectrum. • Deactivation of the thermally excited atoms to lower energy states occurs very rapidly and photons of light are emitted which have energy (δE) equal to the difference between the upper and lower energy states. • δE = Eh - El = (Eelectronic - Evibrational - Erotational)h - (Eelectronic - Evibrational - Erotational)l 13 ©
  • 14. When a sample containing metallic atoms is heated above 2000ᵒC, it undergoes partial or complete partial or complete dissociation into free atoms and then volatilizes to free gaseous atoms. The electrons of the gaseous atoms exist in discrete quantized energy levels, i.e. they are in the orbitals which have specific energy levels that are characteristic of the element. The electrons in the outer orbitals of the atom may absorb thermal energy and be promoted to one or higher energy states. The gain in energy of each electron during a transition is a specific quantity corresponding to the difference between the energy levels after and before excitation. 14 ©
  • 15. • δE = E2 - E1 = hυ = hc/λ = hcΰ • E α 1/ λ • Consequently, a very large number of wavelengths are absorbed, each corresponding to a particular δE value, which are so close together that they appear as a continuous band spectrum. The transition δE4, given by the highest proportion of molecules, corresponds with the wavelength of maximum absorption (λmax). Light at longer and shorter wavelengths is absorbed less strongly because fewer molecules give related transitions. Longer wavelengths have insufficient energy to induce electronic transitions but they are sufficiently energetic sufficiently energetic to increase the vibrational energy levels, and the associated rotational levels, of many molecular bonds. https://d396qusza40orc.cloudfront.net/physicalchemistry/Spectroscopy_Course/spectroscopy-graphs/visible- spectrum-phenolphthalein.html 15 ©
  • 17. Transition Time scale Radiative process Internal Conversion 10-14 - 10-11 s No Vibrational Relaxation 10-14 - 10-11 s No Absorption 10-15 s Yes Phosphorescence 10-4 - 10-1 s Yes Intersystem Crossing 10-8 - 10-3 s No Fluorescence 10-9 - 10-7 s Yes 17 ©
  • 18. Order of energy: Energy for absorption > Energy for Fluorescence > Energy for phosphorescence Order of wavelength: Wavelength for absorption < Wavelength for Fluorescence < Wavelength for phosphorescence 18 ©
  • 20. 20 ©
  • 21. Instrumentation of spectrometers: The essential components of spectrometers: A source of EMR A monochromator A sample compartment A detector and associated electronics A recorder or display 21 ©
  • 22. Light source • Ideal requirements of light source: It should generate a beam with sufficient power for ready detection and measurement. It should emit continuous radiation in the region being studied. It should be stable. It should emit a measurable signal throughout the region. The distribution of energy through a spectrum is mainly a function of temperature; higher the temperature of the light source the shorter the wavelength of the peak emission. 22 ©
  • 23. • Common energy sources for the various regions are indicated below: IR Radiation: Globar and nerst glowers are the common sources of IR radiation. The globar is an electrically heated rod of silicon carbide, and the Nernst glower is a small rod of refractory oxides which, when heated to 1200-1500 degrees, will conduct electricity and thus maintain itself in incandescence. Both these sources operate without a glass envelope, which would absorb IR radiation of wavelength greater than 2μm. 23 ©
  • 24.  Visible radiation: Tungsten filament lamp is used for the region 350 nm- 2000 nm. Tungsten filament is contained in a glass envelope. IR Radiations which may cause stray light effects can be removed by using suitable filters. The life of the lamp is limited by the evaporation of tungsten, which darkens the inside of the envelope and reduces the energy of the incident light. Tungsten-halogen lamps, are used in more expensive instruments and halogen gas is filled inside a quartz envelope. The halogen prevents evaporation of the tungsten and increases the life of the tungsten. The higher operating temperatures extends the lower wavelength limit to 310 nm and gives greater light intensity. 24 ©
  • 25.  UV Radiations:  The most convenient light source for measurement in the UV region is a deuterium discharge lamp. It consists of 2 electrodes contained in a deuterium- filled silica envelope. The passage of high voltage from a special power supply across the electrodes causes emission of deuterium lines which, at low pressure inside the lamp, broaden to give a continuous spectrum in the range 185- 380 nm. Above 380 nm, the emission is not continuous, and the sharp lines at 486 nm and 656.1 nm may be used to calibrate the wavelength scale in this region. 25 ©
  • 26.  Below 185 nm the output is reduced by absorption in the silica envelope. Deuterium lamps give approx. five times greater light intensity than hydrogen lamps when operated at same voltage. UV-Visible spectrophotometers normally have both a deuterium lamp and a tungsten (or tungsten-halogen) lamp, and selection of the appropriate lamp is made by moving either the lamp mountings or a mirror to cause the light to fall on the entrance slit of the manochromator. 26 ©
  • 27. Monochromators • Light gives radiation from 400-800nm • This is called polychromatic light which is of several wavelength • Hence a filter or monochromator is used to convert polychromatic light into monochromatic lights used 27 ©
  • 28. Monochromators Ideal requirements of the monochromator: oIt should be able to isolate a particular wavelength or range of wavelengths. oIt should adhere to the beer-lambert’s law. oIt should emit a measurable signal throughout the region. Commonly used monochromators are: • Filters • Prisms • Gratings 28 ©
  • 29. Absorption Filters Glass filters are pieces of coloured glass which transmit limited wavelength ranges of the spectrum. The color is produced by incorporating oxides of such metals as vanadium, chromium, manganese, iron, nickel, and copper in glass. The color absorbed is the complement of the color of the filter. For example, a filter absorbing yellow light will appear blue. The range of wavelengths transmitted (bandwidth) is very high and may exceed 150 nm. 29 ©
  • 30. Wavelength (nm) Color Complement color 400-450 Violet Yellow-green 450-480 Blue Yellow 480-490 Green-blue Orange 490-500 Blue-green Red 500-560 Green Purple 560-575 Yellow-green Violet 575-590 Yellow Blue 590-625 Orange Green-blue 625-750 Red Blue-green Below 400 nm the color gradually becomes invisible as it passes into UV; above 750 nm it passes into IR. 30 ©
  • 31.  Gelatin filters consisting of a mixture of dyes incorporated in gelatin and sandwitched between glass plates are more selective, with bandwidths about 25 nm. Merits: • Simple, cheaper Demerits: • Less acurate, bandpass is more (+/- 30 nm), intensity is less 31 ©
  • 32. 32 ©
  • 33. Interferometeric filters • They have an even more narrower bandwidth (about 15 nm) and consists of 2 parallel glass plates, silvered internally and separated by a thin film of cryolite or other dielectric material. • Such filters make use of interference of light waves rather than absorption to eliminate the undesired radiation, and serve as relatively inexpensive monochromators for a specific purpose. • Eg. Isolation of calcium radiation at 626 nm and sodium at 589.3 nm in flame photometer • Ordinary filters are incapable for this and cause large errors in measurement of calcium content. 33 ©
  • 34. • Also known as fabry-perot filter • It has dielectric spacer made up of CaF2, MgF2, or SiO. • Thickness of dielectric spacer film can be ½ ʎ (1st order), 2/2 ʎ (2nd order) , 3/2 ʎ (3rd order). • Mechanism is constructive interference followed by this equation. • ʎ=2ηb/m ʎ=wavelength of light η= dielectric constant of material B= layer thickness 34 ©
  • 35. Prisms • When a beam of monochromatic light passes through a prism, it is bent or refracted. • The amount of deviation depends upon the wavelength, eg. Blue light being refracted more than red. • If white polychromatic light is substituted for monochromatic light, a separation of different wavelengths lead to the formation of a spectrum from which a required wavelength can be selected. 35 ©
  • 36. • Prisms are made up of quartz for use in UV region, since glass absorbs wavelengths shorter than about 330 nm. • Glass prisms are preferable for the visible region of the spectrum, as the dispersion is much greater than that obtained with quartz. • For the IR region, the transparent substances usually used are NaCl (2– 15 μm), KBr (12-25μm), LiF (0.2-0.6μm), and CsBr (15-38μm). • Prisms produce a non-linear dispersion, with long wavelengths being less efficient separated than short wavelengths. • The older spectrophotometers show larger divisions btw each nm in the UV region than in the Visible region. 36 ©
  • 37. Gratings • The dispersing element in the monochromator of most modern UV, Vis, IR spectrophotometers is the diffraction grating. • It consists of a very large number of equispaced lines (200-2000 per mm) ruled on a glass blank coated with a thin film of aluminium. • Parallel lines or grooves are chemically joined on a thin layer of photoresist coated glass which produces interference of light beams. • They can be used as transmission gratings or when aluminized can be used as reflection gratings. • Rotation of grating permits appropriate wavelengths of the spectrum to emerge from the exit slit of the monochromator. 37 ©
  • 38. • The ruling of a grating can be shaped to concentrate the light in certain orders to give greater efficiency which is especially imp in IR. • A grating can be plane or concave. • Concave gratings are capable of focusing on its own spectra without the use of lenses or mirrors. • For convenience plane gratings are used which can be made to cover all spectral regions from 180 nm- 15 μm. 38 ©
  • 39. 39 ©
  • 40. Sample Compartment Ideal requirements: • It should hold the sample and should be made of substance which are transparent in the region being studied. • It should be reproducible in path length. For example. Quartz cells in UV can hold 3 ml sample with 1 cm pathlength. 40 ©
  • 41. • Samples presented for the spectrometric analysis may be in the solid, liquid or gaseous state. • For the analysis of liquids and gases in the UV-Visible region above 323 nm, cells (or cuvettes) constructed with optically flat fused glass may be used. • Measurements below 325 nm (the UV cut off value of glass), requires the use of more expensive fused silica cells, which are transparent to below 180 nm. • The standard path-length of cells for the measurements of molecular absorption or fluorescence in the UV-visible region is 10 mm. • The most common sample-containing materials in IR spectroscopy are NaCl (2.5 – 17 μm) and KBr ( 2.5 – 30 μm). 41 ©
  • 42. Detector Ideal requirement of the detectors: • Respond to the radiant energy over a broad wavelength range. • It should be sensitive to low levels of radiant power. • It should respond rapidly to the radiation. • It should produce an electrical signal that can rapidly be amplified and the signal produced is directly proportional to the power of the striking area. 42 ©
  • 43. Detectors Commonly used detectors are: • Barrier-layer cells • Phototubes • Photomultiplier tubes • Photodiodes • Thermocouples • Bolometers • Thermistors • Golay detectors 43 ©
  • 44. Barrier-layer cell: • One of the simplest detector. • Advtg. Requires no power supply but gives a current which, under suitable conditions, is directly proportional to the light intensity. • Instrumentation: It consists of a metallic plate, usually copper or iron, upon which is deposited a layer of selenium or sometimes copper oxide. 44 ©
  • 45. • An extremely thin layer of a good conducting metal, eg, silver, platinum or copper, is formed over the selenium to act as one electrode, the metallic plate acting as the other. • Ordinarily, selenium and metallic oxides and sulphides have extremely small electrical conductivities, the electrons being in energy levels at stationary state that is they are not mobile. • Light of suitable frequency, imparts sufficient energy to the electrons so that they leave the selenium and enter the transparent metal layer. • If 2 electrodes are now connected to the galvanometer, a current will flow shown by the needle of galvanometer. • If the resistance is small, the current produced is directly proportional to the intensity of the light. 45 ©
  • 46. • The current output also depends upon the wavelength of the incident light. • With higher resistance, there would be loss of linearity. • The useful working range of selenium photocells is 380- 780 nm. • Demerits: lack of sensitivity • Merits: Requires no power supply but gives a current which, under suitable conditions, is directly proportional to the light intensity. Cheapest and still used in colorimeters and flame photometers. 46 ©
  • 47. Phototubes: oElectrons are liberated when light falls on a metal surface, and if this is enclosed in an evacuated envelope and kept at a negative voltage, a current which is proportional to the incident light can be drawn from it. oThe essential feature for a sensitive surface in these cells is that the electrons should be liberated easily from the metal. oElements of high atomic volume, eg. K or Cs, are commonly used and, in order to increase the sensitivity, composite coatings such as Cs/ CsO2/ AgO2 have proved of more value than the metal alone. oThe sensitive surface is enclosed in a high vacuum and forms the cathode of the cell. 47 ©
  • 48. oApplication of a sufficiently high potential between cathode and anode ensures that all the electrons liberated by the action of light reach the anode. oA saturation photocurrent which exhibits a linear relationship with the intensity of illumination is then obtained. oBy using different metals, the cells can be made to respond to different regions of the spectrum. oIn spectrophotometers 2 cells are usually used, one being responsive to the UV and visible radiation of wavelengths upto about 620 nm, and the other to radiation of wavelengths 620- 1000nm. 48 ©
  • 49. oA modification of the above type of cell involves the inclusion of an inert gas at a low pressure to give gas-filled cells. oThe underlying principle is that the liberated electrons cause ionization of the gas with consequent increase in the photocurrent but, owing to the lack of linear response, the cells cannot be used in instruments designed for accurate intensity measurement. PHOTOMULTIPLIER tubes (PMTs) In order to obtain greater sensitivity to very weak light intensities, multiplication of the initial photoelectrons by secondary emission is employed. 49 ©
  • 50. 50 ©
  • 51. Several anodes at a gradually increasing potential are contained in 1 bulb. Electrons from the photocathode are attracted to anode 1 and liberate more electrons which travel to anode 2 because of its higher potential relative to anode 1. This process then continues to the last anode, and the result is a final photocurrent 106-108 times greater than the primary current, which still shows a linear response with increase in the intensity of illumination. PMT are ideal for measuring weak light intensities such as occur in fluorescence and in the determination of trace elements by their emission spectra. 51 ©
  • 52. The current from phototubes and PMTs never falls to zero. A small residual current called dark current is produced, due to spontaneous discharge at the high voltage of the dynodes or to the thermal emission from the cathode. PHOTODIODES In essence, the diode is charged to a pre-set potential by a continuously scanning electron beam. If radiation impinges on the diode, the charge is depleted in proportion to the intensity of the radiation. When the electron beam scans again, a current in proportion to the light intensity flows to recharge the diode to the preset voltage. 52 ©
  • 53. Photodiodes, like vacuum phototubes and PMTs, are single-channel detectors, i.e. they monitor the total intensity of light and cannot distinguish between different wavelengths. A spectrum is obtained with single-channel detectors by varying the monochromatic light passing through the sample. When used in combination with a dispersing system each diode can monitor the light intensity at a different wavelength, and the array provides an almost instantaneous spectrum. The multi-channel detector based upon linear diode arrays is of particular advantage in monitoring fast reaction kinetics and eluate (combination of mp and ana.) in HPLC. 53 ©
  • 54. Thermocouples A thermocouple consists of elements of 2 different metals joined together at one end, the other end being attached to a sensitive galvanometer. When radiant energy impinges on the junction of the metals, a thermoelectromotive force is set up which causes a current to flow.  Thermocouples are used in the IR region, and to assist in the complete absorption of the available energy the ‘’hot’’ junction or receiver is usually blackened. 54 ©
  • 55. Bolometers These make use of the increase in resistance of a metal with increase in temperature. Like thermocouples they are used in IR region. If 2 platinum foils are suitably incorporated into a wheatstone bridge, and radiation is allowed to fall on 1 foil, a change in resistance is produced, which results in current which is proportional to the incident radiation. 55 ©
  • 56. Thermistors • Its made of metal oxides. • It functions by changing resistance when heated. • It consists of 2 closely placed thermistor flakes, one of the 10 µm is an active detector, while the other acts the compensating/ reference detector. • It is made of semi-conducting material which has a high negative coefficient of resistivity, i.e. the resistance decreases with increase in temp. and this gives the intensity of the IR radiation. 56 ©
  • 57. Golay detector In this detector, the absorption of IR radiation causes expansion of an inert gas in a cell chamber. One wall of the chamber consists of a flexible mirror and the resulting distortion varies the intensity of illumination falling on a photocell from a reflected beam of light. The current from the photocell is proportional to the incident radiation. 57 ©
  • 58. Display system • The signal from the detector is normally proportional to the intensity of the light incident on the detector and after amplification may be displayed as % transmittance or absorbance. • There are 3 common systems for displaying the %T or absorbance, i.e. a) Moving coil meter b) Digital display c) Strip chart recorder 58 ©
  • 59. Single beam spectrophotometers • https://www.youtube.com/watch?v=XAp-5r3LxQo • https://www.youtube.com/watch?v=pxC6F7bK8CU 59 ©
  • 60. Double beam spectrophotometer • http://mas-iiith.vlabs.ac.in/exp1/expt1/instrument_animation.html 60 ©
  • 61. Principle of UV-Visible spectroscopy: BEER-LAMBERT’S LAW: When a beam of light is passed through a transparent cell containing a solution of an absorbing substance, reduction of the intensity of the light may occur. This is due to: a) Reflections at the inner and outer surfaces of the cell b) Scatter by particles in the solution c) Absorption of light by molecules in the solution. 61 ©
  • 62. • The reflections at the cell surfaces can be compensated by a reference cell containing the solvent only, and scattering may be eliminated by filtration of the solution. • The intensity of the light absorbed is then given by: I absorbed = I0 - IT Where I0 is the original intensity on the cell IT is the reduced intensity transmitted from the cell. 62 ©
  • 63. • The transmittance (T) is the ratio IT / I0 and the % transmittance (%T) is given by: %T = 100 IT / I0 • In 1760, lambert investigated the relationship between I0 and IT for various thickness of substance and found that the rate of decrease in the intensity of light with the thickness, b, of the medium is proportional to the intensity of incident light. • Expressed mathematically, - db / dI α I or – dI/ db = k’ I where k’ is a proportionality constant 63 ©
  • 64. -db / dI = 1 / k’ I Integrating, -b = 1/k’ lnIT + C Where IT is the intensity transmitted at thickness b. When b = 0, C = - 1/k’ ln I0 Therefore, -b = 1/ k’ ln IT – 1/k’ ln I0 LnI0 / IT = k’b 64 ©
  • 65. On conversion to a common logarithm, the expression becomes Log I0 / IT = k’b/ 2.303 The quantity log I0 / IT is called absorbance (A) and is equal to the reciprocal of the common logarithm of transmittance. A = Log 10 I0 / IT = log 10 (1/T) = -log T = 2 – log (%T) Older terms for absorbance such as extinction, optical density, and absorbancy are now obsolete. 65 ©
  • 66. • Lambert’s law is defined as: The intensity of a beam of parallel monochromatic radiation decreases exponentially as it passes through a medium of homogenous thickness. More simply it is stated that the absorbance is proportional to the thickness (pathlength) of the solution. • Beer showed in 1852 that a similar relationship exists between the absorbance and the concentration. Log I0 / IT = k’’c/ 2.303 where k’’ is a proportionality constant and c is the concentration. 66 ©
  • 67. • Beer’s law is defined as follows: The intensity of a beam of parallel monochromatic radiation decreases exponentially with the number of absorbing molecules. More simply stated that the absorbance is proportional to the concentration. A combination of the two laws yields the Beer-Lambert Law: A = Log I0 / IT = abc In which the proportionality constants k’/2.303 and k’’/2.303 are combined as a single constant called absorptivity (a). 67 ©
  • 68. Molar absorptivity • When c is in moles per liter, the constant is called molar absorptivity (formerly called as molar extinction coefficient) and has the symbol ϵ. • The equation therefore becomes, A = ϵbc The molar absorptivity at a specified wavelength of a substance in solution is the absorbance at that wavelength of a mol/l solution in a 1 cm cell. The units of ϵ are therefore 1 l/mol/cm 68 ©
  • 69. Specific absorbance Another form of the beer-lambert proportionality constant is the specific absorbance, which is the absorbance of a specified concentration in a cell of specified pathlength. The most common form is A (1%, 1cm), which is the absorbance of a 1 g/ 100 ml (1% w/v) solution in a 1 cm cell. The beer-lambert equation therefore takes the form, A = A 1cm bc 69 1% ©
  • 70. Deviations from BL Law: • Sample conditions • Instrumental parameters • Chemical effects 70 ©
  • 71. Common organic solvents with their cut-off values 71 ©
  • 72. oOne factor that influences the absorbance of a sample is the concentration (c). oThe expectation would be that, as the concentration goes up, more radiation is absorbed and the absorbance goes up. oTherefore, the absorbance is directly proportional to the concentration. oA second factor is the path length (b). oThe longer the path length, the more molecules there are in the path of the beam of radiation, therefore the absorbance goes up. oTherefore, the path length is directly proportional to the concentration 72 Concentration and pathlength ©
  • 73. 73 ©
  • 74. oFundamental requirement under BL-Law is: Every photon of light striking the detector must have equal chances of absorption. oSuppose we want to measure some high concentrations, above the usual linear range of calibration curve, without diluting the samples and without shorter path-length cells What will be the result? The absorbance would be non-linear which means the maximum absorbance value will shift from 1 to 2 because of stray light effects. 74 ©
  • 75. oIn order to reduce that if the wavelength is set to higher values the linearity would be improved that’s bcz the stray light is lessened by the reduced absorbance at the higher wavelength. oThe intensity of light transmitted from an absorbing solution (IT) will show small random fluctuations owing to small variations in the light source intensity, detector and amplifier noise etc. oConsequently, every absorbance value will have a small random error associated with it. oThe % relative error is the difference between the true conc. And that calculated from the measured absorbance (δc) expressed as a % of the true conc. (c): 75 ©
  • 76. % relative error = 100 δc/ c oThe % relative error is dependent on the magnitude of the measured absorbance and the type of detector used to measure the intensities of light. oFor modern instruments with a phototube detector, it may be shown that the relative error is at minimum when abs is 0.869. oThe optimum accuracy and precision are therefore obtained when the absorbance is around 0.9. oIn general practice, the abs values in range 0.3-1.5 are sufficiently reliable, and the combination of cell path-length and conc. of analyte should be adjusted to give an absorbance within this range. 76 ©
  • 77. Instrumental parameters Slit width It is the width (usually in mm) of the entrance and exit slits of the monochromator. The slits are rectangular apertures through which light enters inside and exists from the monochromator. Their purpose is to control the spectral resolution of the monochromator, that is, it has the ability to separate close wavelengths. 77 ©
  • 78. 78 ©
  • 79. Light is focused onto the entrance slit B, is focused by concave mirror C onto the grating D, which disperses the light according to wavelength. Concave mirror E then focuses the light on the exist slit F, forming a spectrum across the exit slit. Only the particular wavelength that falls directly on the exit slit passes through it and is detected. Adjusting the rotating angle of the grating changes the wavelength that passes through the exist slit. In a standard monochromator design, the entrance slits and exist slits have equal width. 79 ©
  • 80. The wider the slit widths, the larger the range of wavelengths that passes through the monochromator. Most research-grade instruments have user-controllable slit widths. In general, smaller (narrower) slit widths yield greater spectral resolution but cut down the amount of light that is transmitted through the monochromator. In an Absorption spectrophotometer, a monochromator is used to limit the wavelength range of light passed through the sample to that which can be absorbed by the sample. In the most common arrangement, the light source is focused onto the entrance slit and the absorbing sample is placed immediately after the exist slit, with the photodetector exactly behind it to detect the intensity of transmitted light. 80 ©
  • 81. What is the optimum slit width for absorption spectroscopy? The answer to this question depends on the purpose of the measurement. If the purpose is to record an accurate absorption spectrum, for example, for use as a reference spectrum for future measurements or for identification, then a sufficiently small slit width must be used to avoid the polychromaticity deviation from the BL-law. The requirement is that the spectral bandpass be small compared to the spectral width of the absorber. The monochromaticity or spectral purity of the light incident on the sample cell is defined by the spectral bandwidth, which is the width of the triangle (in nm) at one half of the peak intensity. 81 ©
  • 82. Difference between spectral bandwidth, spectral bandpass and slit width • The spectral bandwidth is defined as the width of the band of light at one-half the peak maximum (or full width at half maximum [FWHM]) • Spectral bandpass is the FWHM of the wavelength distribution passed by the exit slit. Resolution is related to bandpass but determines whether the separation of two peaks can be distinguished. 82 ©
  • 83. 83 ©
  • 84. In a dispersive instrument, the spectral bandpass is given by the product of the slitwidth (sw) and the linear dispersion (LD). The slit-width is user-variable in many instruments, whereas the LD is fixed by the design of the monochromator. So, the SW is adjustable, setting it to the smallest slit width will insure the smallest spectral bandpass and result in the minimum polychromaticity error. However, the signal-to-noise ratio decreases as the slit width is reduced, so it is not always practical to use the smallest slit width possible. A smallest slit width, even if it is possible on that spectrometer, will not be useful if the random signal-to-noise error exceeds the error caused by non-linearity. 84 ©
  • 85. The effect that increasing slitwidth has on measured absorbance value depends on the width of the absorption band and on whether the wavelength of measurement corresponds with a maximum or minimum absorbance. The width of the absorption band is defined as natural bandwidth, which is the width of the absorption band at one half the A max. Furthermore, as the absorbance increases due to higher conc. Or longer pathlengths, the % error increases, resulting in a negative deviation from the BL-Law. If the slit width is too narrow, the resultant reduction of the incident energy lowers the signal to noise ratio and decreases the precision of the measurement. The optimum slitwidth is therefore the widest setting that provides spectral fidelity. 85 ©
  • 86. Scanning speed • If the scan speed selected for the automatic recording of the spectrum is too fast, electronic and mechanical damping of the spectrophotometer’s signal to the recorder may prevent the recorder pen responding quickly enough to the rapid changes of absorbance. • The effects observed in progressively faster replicate scans of an absorption spectrum are that the apparent lambda max is displaced in the direction of the scan, Amax are decreased, Amin are increased and the resolution btw adjacent bands is reduced. • The optimum scan speed is normally the fastest speed that maintains the pen fidelity. 86 ©
  • 87. 87 ©
  • 88. Stray light Any radiation reaching the photodetector other than the narrow range of wavelengths normally transmitted by the monochromator. It arises from scattering and refraction inside the monochromator, due to mainly imperfections on the optical surface. If stray light comprises wavelengths which the sample does not absorb, it will fall on the photocell during the measurement of the intensity of both the incident light (Io) and unabsorbed light (IT). Thus, the observed absorbances is given by: Aobs = log [Io+ SL/ IT + SL] 88 ©
  • 89. 89  The effect of stray light is particularly evident at high absorbances, i.e. when IT is low, where deviation from the BL-Law may be observed.  This figure shows the effect of increasing levels of stray light on a Beer’s law plot. ©
  • 90. It should be noted that the spectrophotometer cannot measure absorbances greater than that corresponding with the level of stray light. For example, if the unabsorbed stray light is equivalent to 1% of the intensity of light at a particular wavelength, the limiting value of Aobs is 2 (approximately). 90 ©
  • 91. The effect of stray light may also be seen at wavelengths near the extremes of the usual wavelength range of light sources, where the available energy is low. For example, the intensity of light from a Deuterium lamp below 220 nm decreases rapidly with decreasing wavelength. Unabsorbed stray light of higher wavelengths may reduced the absorbance sufficiently for a spurious maximum which are common below 220 nm and may be detected by marked deviations in Beer’s law when solutions of different conc. are examined. Alternatively, stray light at a particular wavelength can be detected by placing the solution of a substance that is known to absorb completely at that wavelength. 91 ©
  • 92. Observed absorbances other than infinite absorbance (%T = 0) confirms the presence of stray light. Chemical effects Deviations from BL-Law may occur if the substance undergoes chemical changes (e.g. dissociation, association, polymerization, complex formation) as a result of the variation of conc. For example, a solution of benzoic acid high conc. In a simple unbuffered aqueous solution has a low pH and contains a higher proportion of the unionized form than a solution of low conc. 92 ©
  • 93. • The ionized and unionized forms of benzoic acid have different absorption characteristics: λmax = 273 nm λmax = 268 nm ε273 = 970 ε268 = 560 Therefore, increasing the conc. of benzoic acid produces higher absorpitivity values at 273 nm with positive deviation from BL, and lower absorpitivity values at 268 nm with negative deviation from beer’s law. 93 C6H5COOHC6H5COOH ©
  • 94. References • Beckett and Stenlake, 5th Ed., CBS publishers • YR Sharma, Introduction to spectroscopy • Pavia, Introduction to spectroscopy • https://commons.wikimedia.org/wiki/File:Bohr_atom_animation.gif • https://www.priyamstudycentre.com/2019/02/hydrogen- spectrum.html • https://www.edinst.com/blog/jablonski-diagram/ 94 ©
  • 95. 95 ©