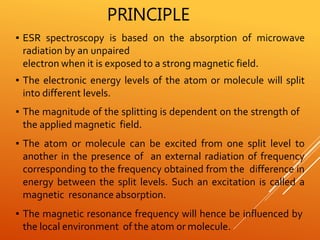
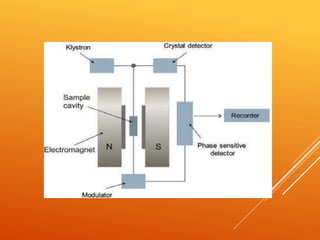
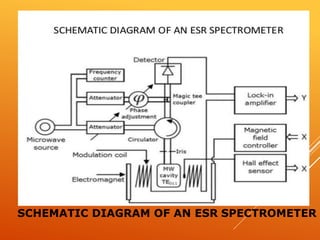
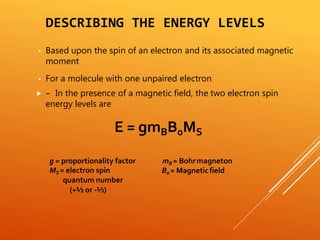
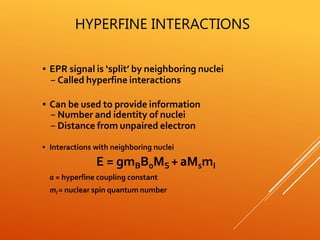
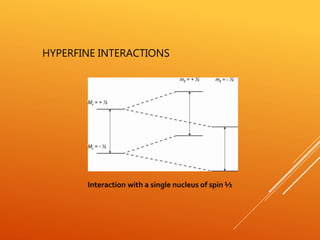
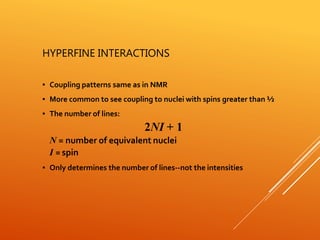
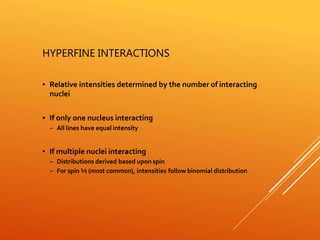
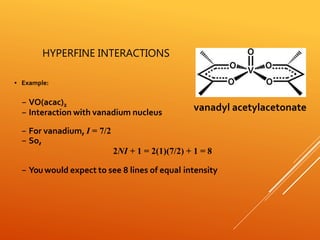
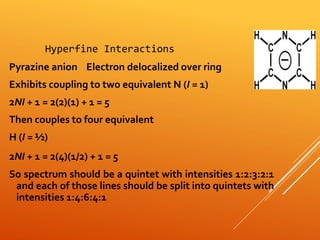
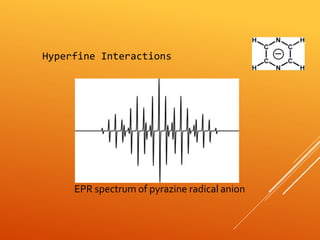
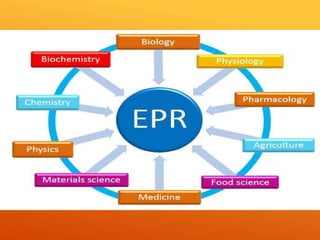
Electron spin Resonance
Spectroscopy
Sunil Patil
Co-founder & Technical Advisor
InoRim Lifesciences LLP
All Electron carry a charge. In some electron this charge spins
on the electron axis and this circulation of e charge generates a
magnetic dipole along the axies.
these particle also have the properties to spin on their own axis
and each of them possesses angular momentum1/2(h/2π) in
accordance with the quantum theory. The net resultant of the
angular momentum of all nuclear particles is called electron
spin.
For a electron having a spin quantum number I, these are(2I
+1) spin states.
SPIN QUANTUM OF VARIOUSNUCLEI
Number of
protons
Even
Number of
neutrons
Even
Spin
quantum
number. I
0
Example
12C, 16O, 32S
Odd/
Even Even/
Odd 1/2,3/2,5/2
1H, 19F, 31P,
11B, 79Br3& 5
Cl,
13C, 127I,
odd odd 1 2H, 14N
6
ESR
SPECTROSCOPY
Electron Spin ResonanceSpectroscopy
@lso called as
EPR Spectroscopy
Electron Paramagnetic Resonance Spectroscopy
PRINCIPLE
▪ ESR spectroscopy is based on the absorption of microwave
radiation by an unpaired
electron when it is exposed to a strong magnetic field.
▪ The electronic energy levels of the atom or molecule will split
into different levels.
▪ The magnitude of the splitting is dependent on the strength of
the applied magnetic field.
▪ The atom or molecule can be excited from one split level to
another in the presence of an external radiation of frequency
corresponding to the frequency obtained from the difference in
energy between the split levels. Such an excitation is called a
magnetic resonance absorption.
▪ The magnetic resonance frequency will hence be influenced by
the local environment of the atom or molecule.
• Klystron tube acts as the source of radiation.
• The frequency of the monochromatic
radiation is determined by the voltage
applied to klystron.
• It is kept a fixed frequency by an
automatic control circuit and provides
a power output of about 300 milli watts.
Klystron
The wave meter is put in between the oscillator
and attenuator to know the frequency of
microwaves produced by klystron oscillator.
The wave meter is usually calibrated in
frequency unit (megahertz) instead of
wavelength. Wave guide is a hollow,
rectangular brass tube. It is used to convey the
wave radiation to the sample and crystal.
The power propagated down the wave
guide may be continuously decreased by
inserting a piece of resistive material into
the wave guide.
The piece is called variable attenuator and
used in varying the power of the sample
from the full power of klystron to one
attenuated by a force 100 or more.
It is a non-reciprocal device which minimizes vibrations
in the frequency of microwaves produced by klystron
oscillator.
Isolators are used to prevent the reflection of
microwave power back into the radiation source.
It is a strip of ferrite material which allows micro
waves in one direction only.
It also is being stabilizing the frequency of the
klystron.
The heart of the ESR spectrometer is the resonant sample
cavity.
In most of the ESR spectrometers, dual sample cavities are
generally used.
This is done for simultaneous observation of a sample and a
reference material.
Since magnetic field interacts with the sample to cause spin
resonance the sample is placed where the intensity of magnetic
field is greatest.
A measure of quality of the cavity is ‘Q factor’ which is defined
as The sensitivity of the spectrometer is directly proportional to
this value of Q.
The various components of the micro wave
assembly to be coupled together by making use of
irises or slots of various sizes.
A SILICON CRYSTAL DETECTORS, WHICH CONVERTS
THE RADIATION IN D.C., HAS WIDELY BEEN USED AS
A DETECTOR OF MICROWAVE RADIATION.
Microwave Bridge such as magic T and hybrid
ring variety are most common.
The resonant cavity is placed between the poles
pieces of an electromagnet.
An electro magnet capable of producing magnetic
field of at least 5000 gauss is required for ESR.
The field should be stable and uniform over the
sample volume.
The stability of field is achieved by energizing the
magnet with a highly regulated power supply.
The ESR spectrum is recorded by slowly varying the
magnetic field through the resonance condense by
sweeping the current supplied to the magnet by the
power supply.
This sweep is usually accomplished by with a
variable speed motor drive.
Both the magnet as well as the power supply may
require water cooling.
 The modulation of the signal at a frequency
consistent with good signal noise ratio in the crystal
detector is accomplished by a small alternating
variation of the magnetic field.
 The variation is produced by supplying an A.C.
signal to modulation coil oriented with respect the
sample in the same direction as the magnetic field.
If the modulation is of low frequency (400
cycles/sec or less), the coils can be mounted
outside the cavity and even on the magnet pole
pieces.
For higher modulation frequencies, modulation
coils must be mounted inside the resonant cavity
or cavities constructed of a non-metallic
material
e.g., Quartz with a tin silvered plating, because
metallic penetration is not very effective in case
of higher modulation frequencies.
 In order to adjust the spectrometer and to observe
the signal, a cathode ray oscilloscope has been
employed. A strip chart or X-Y recorder is used for
recording the signal.
 EPR spectra are usually displayed in derivative
form to improve the signal-to-noise ratio.
SCHEMATIC DIAGRAM OF AN ESR SPECTROMETER
▪ The sample is placed in a resonant cavity which admits
microwaves through an iris.
▪ The cavity is located in the middle of an electromagnet
and helps to amplify the weak signals from the sample.
▪ Numerous types of solid-state diodes are sensitive to
microwave energy
▪ Absorption lines are detected when the separation of the
energy levels is equal to the energy of the incident
microwave.
WHAT CAUSES THE ENERGY LEVELS?
Resulting energy levels of an electron in a magnetic field
DESCRIBING THE ENERGY LEVELS
▪ Based upon the spin of an electron and its associated magnetic
moment
▪ For a molecule with one unpaired electron
 – In the presence of a magnetic field, the two electron spin
energy levels are
E = gmBB0MS
mB = Bohrmagneton
B0 = Magneticfield
g = proportionality factor
MS = electron spin
quantum number
(+½ or -½)
HYPERFINE INTERACTIONS
▪ EPR signal is ‘split’ by neighboring nuclei
– Called hyperfine interactions
▪ Can be used to provide information
– Number and identity of nuclei
– Distance from unpaired electron
▪ Interactions with neighboring nuclei
E = gmBB0MS +aMsmI
a = hyperfine coupling constant
mI = nuclear spin quantum number
HYPERFINE INTERACTIONS
Interaction with a single nucleus of spin ½
HYPERFINE INTERACTIONS
▪ Coupling patterns same as in NMR
▪ More common to see coupling to nuclei with spins greater than ½
▪ The number of lines:
2NI + 1
N = number of equivalent nuclei
I = spin
▪ Only determines the number of lines--not the intensities
HYPERFINE INTERACTIONS
▪ Relative intensities determined by the number of interacting
nuclei
▪ If only one nucleus interacting
– All lines have equal intensity
▪ If multiple nuclei interacting
– Distributions derived based upon spin
– For spin ½ (most common), intensities follow binomial distribution
HYPERFINE INTERACTIONS
▪ Example:
– VO(acac)2
– Interaction with vanadium nucleus
– For vanadium, I = 7/2
– So,
2NI + 1 = 2(1)(7/2) + 1 = 8
– Youwould expect to see 8 lines of equal intensity
vanadyl acetylacetonate
HYPERFINE INTERACTIONS
EPR spectrum of vanadyl acetylacetonate
Hyperfine Interactions
Pyrazine anion Electron delocalized over ring
Exhibits coupling to two equivalent N (I = 1)
2NI + 1 = 2(2)(1) + 1 = 5
Then couples to four equivalent
H (I = ½)
2NI + 1 = 2(4)(1/2) + 1 = 5
So spectrum should be a quintet with intensities 1:2:3:2:1
and each of those lines should be split into quintets with
intensities 1:4:6:4:1
Hyperfine Interactions
EPR spectrum of pyrazine radical anion
• Electron Spin Resonance is a powerful
non-destructive & non-intrusive analytical method.
• ESR yields meaningful structural information even
from ongoing chemical or physical processes,
without influencing the process itself.
• It is the ideal technique to complement other
analytical methods in a wide range of application
areas.
 Free Radicals
 Odd-electron Molecules
 Transition Metal Complexes
 Molecular Motion
 Rare Earth Ions
 Crystal / Ligand Fields
 Electron Transport
 Reaction Kinetics
etc.. Can be detected byESR.
1. Clearly mention state the model of ESR Spectormeter for your sample analysis.
2. Analysis charges would vary depending on model selection. Relevent charges are
given under each model
3. Clearly state the type of analysis required. Powder/Solution and also RT/77K For
solution sample suggest name of solvent.
4. Experiments can be carried out at ambient temperature, liquid nitrogen temperature
and most of the temperatures between liquid nitrogen temperature and 200o C.
5. Experiments can be carried out with samples in liquid, solid or gaseous form, which
includes single crystals, metal alloys, liquid crystals, organic radicals, polymers, glasses,
powders, triplets, polyradicals, conduction electrons, drugs, rare-earths, enzymes,
proteins and gases.
6. Provide minimum 25-50 mg of solid sample in powder form.

Electron spin resonance spectroscopy

  • 1.
    Electron spin Resonance Spectroscopy SunilPatil Co-founder & Technical Advisor InoRim Lifesciences LLP
  • 2.
    All Electron carrya charge. In some electron this charge spins on the electron axis and this circulation of e charge generates a magnetic dipole along the axies. these particle also have the properties to spin on their own axis and each of them possesses angular momentum1/2(h/2π) in accordance with the quantum theory. The net resultant of the angular momentum of all nuclear particles is called electron spin. For a electron having a spin quantum number I, these are(2I +1) spin states.
  • 3.
    SPIN QUANTUM OFVARIOUSNUCLEI Number of protons Even Number of neutrons Even Spin quantum number. I 0 Example 12C, 16O, 32S Odd/ Even Even/ Odd 1/2,3/2,5/2 1H, 19F, 31P, 11B, 79Br3& 5 Cl, 13C, 127I, odd odd 1 2H, 14N 6
  • 4.
    ESR SPECTROSCOPY Electron Spin ResonanceSpectroscopy @lsocalled as EPR Spectroscopy Electron Paramagnetic Resonance Spectroscopy
  • 5.
    PRINCIPLE ▪ ESR spectroscopyis based on the absorption of microwave radiation by an unpaired electron when it is exposed to a strong magnetic field. ▪ The electronic energy levels of the atom or molecule will split into different levels. ▪ The magnitude of the splitting is dependent on the strength of the applied magnetic field. ▪ The atom or molecule can be excited from one split level to another in the presence of an external radiation of frequency corresponding to the frequency obtained from the difference in energy between the split levels. Such an excitation is called a magnetic resonance absorption. ▪ The magnetic resonance frequency will hence be influenced by the local environment of the atom or molecule.
  • 8.
    • Klystron tubeacts as the source of radiation. • The frequency of the monochromatic radiation is determined by the voltage applied to klystron. • It is kept a fixed frequency by an automatic control circuit and provides a power output of about 300 milli watts. Klystron
  • 9.
    The wave meteris put in between the oscillator and attenuator to know the frequency of microwaves produced by klystron oscillator. The wave meter is usually calibrated in frequency unit (megahertz) instead of wavelength. Wave guide is a hollow, rectangular brass tube. It is used to convey the wave radiation to the sample and crystal.
  • 10.
    The power propagateddown the wave guide may be continuously decreased by inserting a piece of resistive material into the wave guide. The piece is called variable attenuator and used in varying the power of the sample from the full power of klystron to one attenuated by a force 100 or more.
  • 12.
    It is anon-reciprocal device which minimizes vibrations in the frequency of microwaves produced by klystron oscillator. Isolators are used to prevent the reflection of microwave power back into the radiation source. It is a strip of ferrite material which allows micro waves in one direction only. It also is being stabilizing the frequency of the klystron.
  • 14.
    The heart ofthe ESR spectrometer is the resonant sample cavity. In most of the ESR spectrometers, dual sample cavities are generally used. This is done for simultaneous observation of a sample and a reference material. Since magnetic field interacts with the sample to cause spin resonance the sample is placed where the intensity of magnetic field is greatest. A measure of quality of the cavity is ‘Q factor’ which is defined as The sensitivity of the spectrometer is directly proportional to this value of Q.
  • 16.
    The various componentsof the micro wave assembly to be coupled together by making use of irises or slots of various sizes.
  • 17.
    A SILICON CRYSTALDETECTORS, WHICH CONVERTS THE RADIATION IN D.C., HAS WIDELY BEEN USED AS A DETECTOR OF MICROWAVE RADIATION. Microwave Bridge such as magic T and hybrid ring variety are most common.
  • 19.
    The resonant cavityis placed between the poles pieces of an electromagnet. An electro magnet capable of producing magnetic field of at least 5000 gauss is required for ESR. The field should be stable and uniform over the sample volume. The stability of field is achieved by energizing the magnet with a highly regulated power supply.
  • 20.
    The ESR spectrumis recorded by slowly varying the magnetic field through the resonance condense by sweeping the current supplied to the magnet by the power supply. This sweep is usually accomplished by with a variable speed motor drive. Both the magnet as well as the power supply may require water cooling.
  • 21.
     The modulationof the signal at a frequency consistent with good signal noise ratio in the crystal detector is accomplished by a small alternating variation of the magnetic field.  The variation is produced by supplying an A.C. signal to modulation coil oriented with respect the sample in the same direction as the magnetic field.
  • 22.
    If the modulationis of low frequency (400 cycles/sec or less), the coils can be mounted outside the cavity and even on the magnet pole pieces. For higher modulation frequencies, modulation coils must be mounted inside the resonant cavity or cavities constructed of a non-metallic material e.g., Quartz with a tin silvered plating, because metallic penetration is not very effective in case of higher modulation frequencies.
  • 23.
     In orderto adjust the spectrometer and to observe the signal, a cathode ray oscilloscope has been employed. A strip chart or X-Y recorder is used for recording the signal.  EPR spectra are usually displayed in derivative form to improve the signal-to-noise ratio.
  • 25.
    SCHEMATIC DIAGRAM OFAN ESR SPECTROMETER
  • 26.
    ▪ The sampleis placed in a resonant cavity which admits microwaves through an iris. ▪ The cavity is located in the middle of an electromagnet and helps to amplify the weak signals from the sample. ▪ Numerous types of solid-state diodes are sensitive to microwave energy ▪ Absorption lines are detected when the separation of the energy levels is equal to the energy of the incident microwave.
  • 27.
    WHAT CAUSES THEENERGY LEVELS? Resulting energy levels of an electron in a magnetic field
  • 28.
    DESCRIBING THE ENERGYLEVELS ▪ Based upon the spin of an electron and its associated magnetic moment ▪ For a molecule with one unpaired electron  – In the presence of a magnetic field, the two electron spin energy levels are E = gmBB0MS mB = Bohrmagneton B0 = Magneticfield g = proportionality factor MS = electron spin quantum number (+½ or -½)
  • 29.
    HYPERFINE INTERACTIONS ▪ EPRsignal is ‘split’ by neighboring nuclei – Called hyperfine interactions ▪ Can be used to provide information – Number and identity of nuclei – Distance from unpaired electron ▪ Interactions with neighboring nuclei E = gmBB0MS +aMsmI a = hyperfine coupling constant mI = nuclear spin quantum number
  • 30.
    HYPERFINE INTERACTIONS Interaction witha single nucleus of spin ½
  • 31.
    HYPERFINE INTERACTIONS ▪ Couplingpatterns same as in NMR ▪ More common to see coupling to nuclei with spins greater than ½ ▪ The number of lines: 2NI + 1 N = number of equivalent nuclei I = spin ▪ Only determines the number of lines--not the intensities
  • 32.
    HYPERFINE INTERACTIONS ▪ Relativeintensities determined by the number of interacting nuclei ▪ If only one nucleus interacting – All lines have equal intensity ▪ If multiple nuclei interacting – Distributions derived based upon spin – For spin ½ (most common), intensities follow binomial distribution
  • 33.
    HYPERFINE INTERACTIONS ▪ Example: –VO(acac)2 – Interaction with vanadium nucleus – For vanadium, I = 7/2 – So, 2NI + 1 = 2(1)(7/2) + 1 = 8 – Youwould expect to see 8 lines of equal intensity vanadyl acetylacetonate
  • 34.
    HYPERFINE INTERACTIONS EPR spectrumof vanadyl acetylacetonate
  • 35.
    Hyperfine Interactions Pyrazine anionElectron delocalized over ring Exhibits coupling to two equivalent N (I = 1) 2NI + 1 = 2(2)(1) + 1 = 5 Then couples to four equivalent H (I = ½) 2NI + 1 = 2(4)(1/2) + 1 = 5 So spectrum should be a quintet with intensities 1:2:3:2:1 and each of those lines should be split into quintets with intensities 1:4:6:4:1
  • 36.
    Hyperfine Interactions EPR spectrumof pyrazine radical anion
  • 39.
    • Electron SpinResonance is a powerful non-destructive & non-intrusive analytical method. • ESR yields meaningful structural information even from ongoing chemical or physical processes, without influencing the process itself. • It is the ideal technique to complement other analytical methods in a wide range of application areas.
  • 40.
     Free Radicals Odd-electron Molecules  Transition Metal Complexes  Molecular Motion  Rare Earth Ions  Crystal / Ligand Fields  Electron Transport  Reaction Kinetics etc.. Can be detected byESR.
  • 42.
    1. Clearly mentionstate the model of ESR Spectormeter for your sample analysis. 2. Analysis charges would vary depending on model selection. Relevent charges are given under each model 3. Clearly state the type of analysis required. Powder/Solution and also RT/77K For solution sample suggest name of solvent. 4. Experiments can be carried out at ambient temperature, liquid nitrogen temperature and most of the temperatures between liquid nitrogen temperature and 200o C. 5. Experiments can be carried out with samples in liquid, solid or gaseous form, which includes single crystals, metal alloys, liquid crystals, organic radicals, polymers, glasses, powders, triplets, polyradicals, conduction electrons, drugs, rare-earths, enzymes, proteins and gases. 6. Provide minimum 25-50 mg of solid sample in powder form.