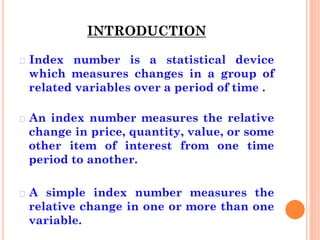
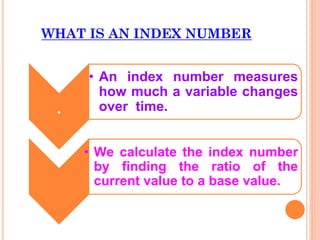
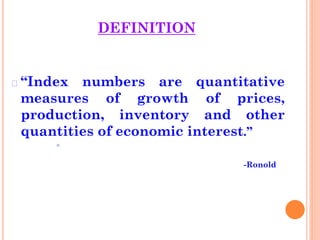
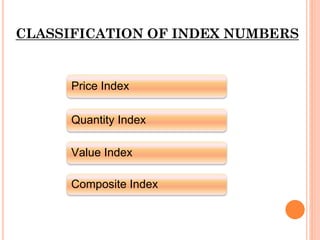
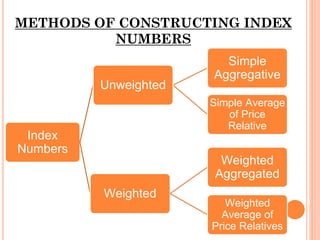
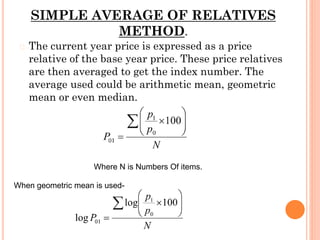
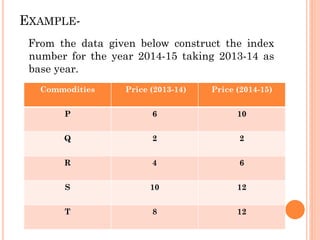
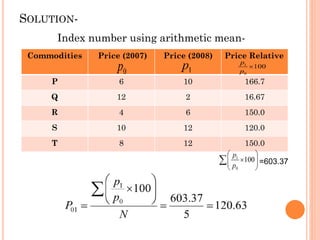
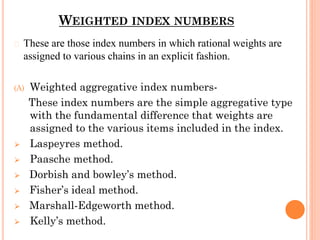
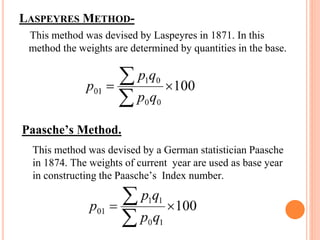
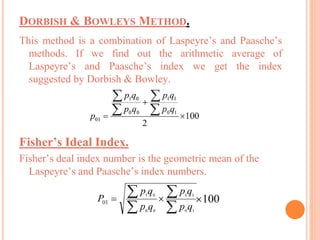
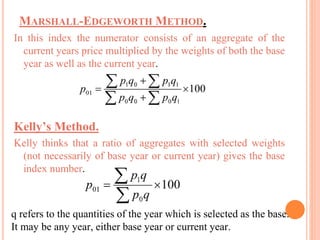
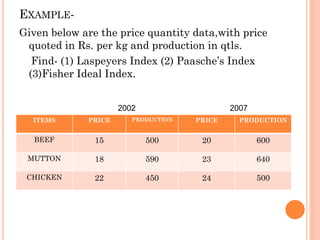
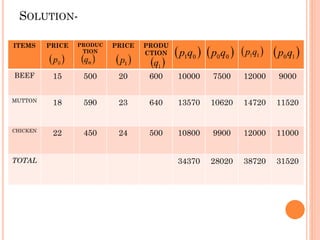
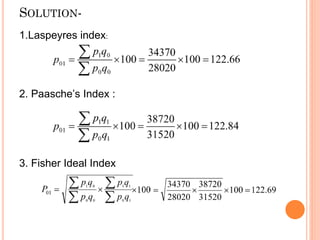
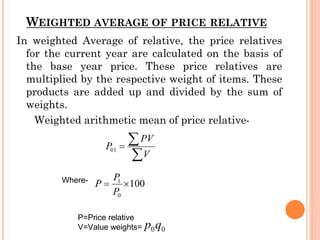
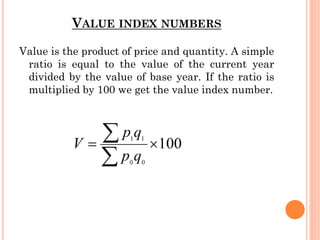
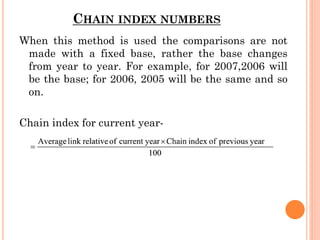
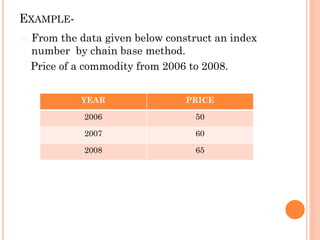
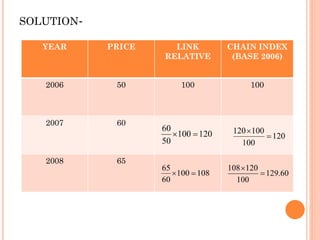
INDEX
NUMBERS
CONTENTS
❖ Introduction
❖ Definition
❖ Characteristics
❖ Uses
❖ Problems
❖ Classification
❖ Methods
❖ Value index numbers
❖ Chain index numbers.
INTRODUCTION
� Index number is a statistical device
which measures changes in a group of
related variables over a period of time .
� An index number measures the relative
change in price, quantity, value, or some
other item of interest from one time
period to another.
� A simple index number measures the
relative change in one or more than one
variable.
WHAT IS AN INDEX NUMBER
.
• An index number measures
how much a variable changes
over time.
• We calculate the index number
by finding the ratio of the
current value to a base value.
DEFINITION
� “Index numbers are quantitative
measures of growth of prices,
production, inventory and other
quantities of economic interest.”
⚫
-Ronold
CHARACTERISTICS OF INDEX NUMBERS
❖ Index numbers are specialised averages.
❖ Index numbers measure the change in the level
of a phenomenon.
❖ Index numbers measure the effect of changes
over a period of time.
USES OF INDEX NUMBERS
o To frame suitable policies.
o They reveal trends and tendencies.
o Index numbers are very useful in deflating.
PROBLEMS RELATED TO INDEX
NUMBERS
� Choice of the base period.
� Choice of an average.
� Choice of index.
� Selection of commodities.
� Data collection.
CLASSIFICATION OF INDEX NUMBERS
Price Index
Quantity Index
Value Index
Composite Index
METHODS OF CONSTRUCTING INDEX
NUMBERS
Index
Numbers
Simple
Aggregative
Simple Average
of Price
Relative
Unweighted
Weighted
Weighted
Aggregated
Weighted
Average of
Price Relatives
SIMPLE AGGREGATIVE METHOD
It consists in expressing the aggregate price of all
commodities in the current year as a percentage of the
aggregate price in the base year.
P01= Index number of the current year.
= Total of the current year’s price of all commodities.
= Total of the base year’s price of all commodities.
EXAMPLE:-
FROM THE DATA GIVEN BELOW CONSTRUCT THE
INDEX NUMBER FOR THE YEAR 2007 ON THE BASE
YEAR 2008 IN RAJASTHAN STATE.
COMMODITIES UNITS
PRICE (Rs)
2007
PRICE (Rs)
2008
Sugar Quintal 2200 3200
Milk Quintal 18 20
Oil Litre 68 71
Wheat Quintal 900 1000
Clothing Meter 50 60
SOLUTION:-
COMMODITIES UNITS
PRICE (Rs)
2007
PRICE (Rs)
2008
Sugar Quintal 2200 3200
Milk Quintal 18 20
Oil Litre 68 71
Wheat Quintal 900 1000
Clothing Meter 50 60
Index Number for 2008-
It means the prize in 2008 were 34.45% higher than the previous year.
SIMPLE AVERAGE OF RELATIVES
METHOD.
� The current year price is expressed as a price
relative of the base year price. These price relatives
are then averaged to get the index number. The
average used could be arithmetic mean, geometric
mean or even median.
Where N is Numbers Of items.
When geometric mean is used-
EXAMPLE-
From the data given below construct the index
number for the year 2014-15 taking 2013-14 as
base year.
Commodities Price (2013-14) Price (2014-15)
P 6 10
Q 2 2
R 4 6
S 10 12
T 8 12
SOLUTION-
Index number using arithmetic mean-
Commodities Price (2007) Price (2008) Price Relative
P 6 10 166.7
Q 12 2 16.67
R 4 6 150.0
S 10 12 120.0
T 8 12 150.0
=603.37
WEIGHTED INDEX NUMBERS
� These are those index numbers in which rational weights are
assigned to various chains in an explicit fashion.
(A) Weighted aggregative index numbers-
These index numbers are the simple aggregative type
with the fundamental difference that weights are
assigned to the various items included in the index.
⮚ Laspeyres method.
⮚ Paasche method.
⮚ Dorbish and bowley’s method.
⮚ Fisher’s ideal method.
⮚ Marshall-Edgeworth method.
⮚ Kelly’s method.
LASPEYRES METHOD-
This method was devised by Laspeyres in 1871. In this
method the weights are determined by quantities in the base.
Paasche’s Method.
This method was devised by a German statistician Paasche
in 1874. The weights of current year are used as base year
in constructing the Paasche’s Index number.
DORBISH & BOWLEYS METHOD.
This method is a combination of Laspeyre’s and Paasche’s
methods. If we find out the arithmetic average of
Laspeyre’s and Paasche’s index we get the index
suggested by Dorbish & Bowley.
Fisher’s Ideal Index.
Fisher’s deal index number is the geometric mean of the
Laspeyre’s and Paasche’s index numbers.
MARSHALL-EDGEWORTH METHOD.
In this index the numerator consists of an aggregate of the
current years price multiplied by the weights of both the base
year as well as the current year.
Kelly’s Method.
Kelly thinks that a ratio of aggregates with selected weights
(not necessarily of base year or current year) gives the base
index number.
q refers to the quantities of the year which is selected as the base.
It may be any year, either base year or current year.
EXAMPLE-
Given below are the price quantity data,with price
quoted in Rs. per kg and production in qtls.
Find- (1) Laspeyers Index (2) Paasche’s Index
(3)Fisher Ideal Index.
ITEMS PRICE PRODUCTION PRICE PRODUCTION
BEEF 15 500 20 600
MUTTON 18 590 23 640
CHICKEN 22 450 24 500
2002 2007
SOLUTION-
ITEMS PRICE PRODUC
TION
PRICE PRODU
CTION
BEEF 15 500 20 600 10000 7500 12000 9000
MUTTON
18 590 23 640 13570 10620 14720 11520
CHICKEN
22 450 24 500 10800 9900 12000 11000
TOTAL 34370 28020 38720 31520
SOLUTION-
2. Paasche’s Index :
3. Fisher Ideal Index
1.Laspeyres index:
WEIGHTED AVERAGE OF PRICE RELATIVE
In weighted Average of relative, the price relatives
for the current year are calculated on the basis of
the base year price. These price relatives are
multiplied by the respective weight of items. These
products are added up and divided by the sum of
weights.
Weighted arithmetic mean of price relative-
Where-
P=Price relative
V=Value weights=
VALUE INDEX NUMBERS
Value is the product of price and quantity. A simple
ratio is equal to the value of the current year
divided by the value of base year. If the ratio is
multiplied by 100 we get the value index number.
CHAIN INDEX NUMBERS
When this method is used the comparisons are not
made with a fixed base, rather the base changes
from year to year. For example, for 2007,2006 will
be the base; for 2006, 2005 will be the same and so
on.
Chain index for current year-
EXAMPLE-
� From the data given below construct an index
number by chain base method.
Price of a commodity from 2006 to 2008.
YEAR PRICE
2006 50
2007 60
2008 65
SOLUTION-
YEAR PRICE LINK
RELATIVE
CHAIN INDEX
(BASE 2006)
2006 50 100 100
2007 60
2008 65
REFERENCES
1. Statistics for management.
Richard i. Levin & David S. Rubin.
2. Statistics for Business and economics.
R.P.Hooda.
3. Business Statistics.
B.M.Agarwal.
4. Business statistics.
S.P.Gupta.
Index Numbers.pptx

Index Numbers.pptx

  • 1.
  • 2.
    CONTENTS ❖ Introduction ❖ Definition ❖Characteristics ❖ Uses ❖ Problems ❖ Classification ❖ Methods ❖ Value index numbers ❖ Chain index numbers.
  • 3.
    INTRODUCTION � Index numberis a statistical device which measures changes in a group of related variables over a period of time . � An index number measures the relative change in price, quantity, value, or some other item of interest from one time period to another. � A simple index number measures the relative change in one or more than one variable.
  • 4.
    WHAT IS ANINDEX NUMBER . • An index number measures how much a variable changes over time. • We calculate the index number by finding the ratio of the current value to a base value.
  • 5.
    DEFINITION � “Index numbersare quantitative measures of growth of prices, production, inventory and other quantities of economic interest.” ⚫ -Ronold
  • 6.
    CHARACTERISTICS OF INDEXNUMBERS ❖ Index numbers are specialised averages. ❖ Index numbers measure the change in the level of a phenomenon. ❖ Index numbers measure the effect of changes over a period of time.
  • 7.
    USES OF INDEXNUMBERS o To frame suitable policies. o They reveal trends and tendencies. o Index numbers are very useful in deflating.
  • 8.
    PROBLEMS RELATED TOINDEX NUMBERS � Choice of the base period. � Choice of an average. � Choice of index. � Selection of commodities. � Data collection.
  • 9.
    CLASSIFICATION OF INDEXNUMBERS Price Index Quantity Index Value Index Composite Index
  • 10.
    METHODS OF CONSTRUCTINGINDEX NUMBERS Index Numbers Simple Aggregative Simple Average of Price Relative Unweighted Weighted Weighted Aggregated Weighted Average of Price Relatives
  • 11.
    SIMPLE AGGREGATIVE METHOD Itconsists in expressing the aggregate price of all commodities in the current year as a percentage of the aggregate price in the base year. P01= Index number of the current year. = Total of the current year’s price of all commodities. = Total of the base year’s price of all commodities.
  • 12.
    EXAMPLE:- FROM THE DATAGIVEN BELOW CONSTRUCT THE INDEX NUMBER FOR THE YEAR 2007 ON THE BASE YEAR 2008 IN RAJASTHAN STATE. COMMODITIES UNITS PRICE (Rs) 2007 PRICE (Rs) 2008 Sugar Quintal 2200 3200 Milk Quintal 18 20 Oil Litre 68 71 Wheat Quintal 900 1000 Clothing Meter 50 60
  • 13.
    SOLUTION:- COMMODITIES UNITS PRICE (Rs) 2007 PRICE(Rs) 2008 Sugar Quintal 2200 3200 Milk Quintal 18 20 Oil Litre 68 71 Wheat Quintal 900 1000 Clothing Meter 50 60 Index Number for 2008- It means the prize in 2008 were 34.45% higher than the previous year.
  • 14.
    SIMPLE AVERAGE OFRELATIVES METHOD. � The current year price is expressed as a price relative of the base year price. These price relatives are then averaged to get the index number. The average used could be arithmetic mean, geometric mean or even median. Where N is Numbers Of items. When geometric mean is used-
  • 15.
    EXAMPLE- From the datagiven below construct the index number for the year 2014-15 taking 2013-14 as base year. Commodities Price (2013-14) Price (2014-15) P 6 10 Q 2 2 R 4 6 S 10 12 T 8 12
  • 16.
    SOLUTION- Index number usingarithmetic mean- Commodities Price (2007) Price (2008) Price Relative P 6 10 166.7 Q 12 2 16.67 R 4 6 150.0 S 10 12 120.0 T 8 12 150.0 =603.37
  • 17.
    WEIGHTED INDEX NUMBERS �These are those index numbers in which rational weights are assigned to various chains in an explicit fashion. (A) Weighted aggregative index numbers- These index numbers are the simple aggregative type with the fundamental difference that weights are assigned to the various items included in the index. ⮚ Laspeyres method. ⮚ Paasche method. ⮚ Dorbish and bowley’s method. ⮚ Fisher’s ideal method. ⮚ Marshall-Edgeworth method. ⮚ Kelly’s method.
  • 18.
    LASPEYRES METHOD- This methodwas devised by Laspeyres in 1871. In this method the weights are determined by quantities in the base. Paasche’s Method. This method was devised by a German statistician Paasche in 1874. The weights of current year are used as base year in constructing the Paasche’s Index number.
  • 19.
    DORBISH & BOWLEYSMETHOD. This method is a combination of Laspeyre’s and Paasche’s methods. If we find out the arithmetic average of Laspeyre’s and Paasche’s index we get the index suggested by Dorbish & Bowley. Fisher’s Ideal Index. Fisher’s deal index number is the geometric mean of the Laspeyre’s and Paasche’s index numbers.
  • 20.
    MARSHALL-EDGEWORTH METHOD. In thisindex the numerator consists of an aggregate of the current years price multiplied by the weights of both the base year as well as the current year. Kelly’s Method. Kelly thinks that a ratio of aggregates with selected weights (not necessarily of base year or current year) gives the base index number. q refers to the quantities of the year which is selected as the base. It may be any year, either base year or current year.
  • 21.
    EXAMPLE- Given below arethe price quantity data,with price quoted in Rs. per kg and production in qtls. Find- (1) Laspeyers Index (2) Paasche’s Index (3)Fisher Ideal Index. ITEMS PRICE PRODUCTION PRICE PRODUCTION BEEF 15 500 20 600 MUTTON 18 590 23 640 CHICKEN 22 450 24 500 2002 2007
  • 22.
    SOLUTION- ITEMS PRICE PRODUC TION PRICEPRODU CTION BEEF 15 500 20 600 10000 7500 12000 9000 MUTTON 18 590 23 640 13570 10620 14720 11520 CHICKEN 22 450 24 500 10800 9900 12000 11000 TOTAL 34370 28020 38720 31520
  • 23.
    SOLUTION- 2. Paasche’s Index: 3. Fisher Ideal Index 1.Laspeyres index:
  • 24.
    WEIGHTED AVERAGE OFPRICE RELATIVE In weighted Average of relative, the price relatives for the current year are calculated on the basis of the base year price. These price relatives are multiplied by the respective weight of items. These products are added up and divided by the sum of weights. Weighted arithmetic mean of price relative- Where- P=Price relative V=Value weights=
  • 25.
    VALUE INDEX NUMBERS Valueis the product of price and quantity. A simple ratio is equal to the value of the current year divided by the value of base year. If the ratio is multiplied by 100 we get the value index number.
  • 26.
    CHAIN INDEX NUMBERS Whenthis method is used the comparisons are not made with a fixed base, rather the base changes from year to year. For example, for 2007,2006 will be the base; for 2006, 2005 will be the same and so on. Chain index for current year-
  • 27.
    EXAMPLE- � From thedata given below construct an index number by chain base method. Price of a commodity from 2006 to 2008. YEAR PRICE 2006 50 2007 60 2008 65
  • 28.
    SOLUTION- YEAR PRICE LINK RELATIVE CHAININDEX (BASE 2006) 2006 50 100 100 2007 60 2008 65
  • 29.
    REFERENCES 1. Statistics formanagement. Richard i. Levin & David S. Rubin. 2. Statistics for Business and economics. R.P.Hooda. 3. Business Statistics. B.M.Agarwal. 4. Business statistics. S.P.Gupta.