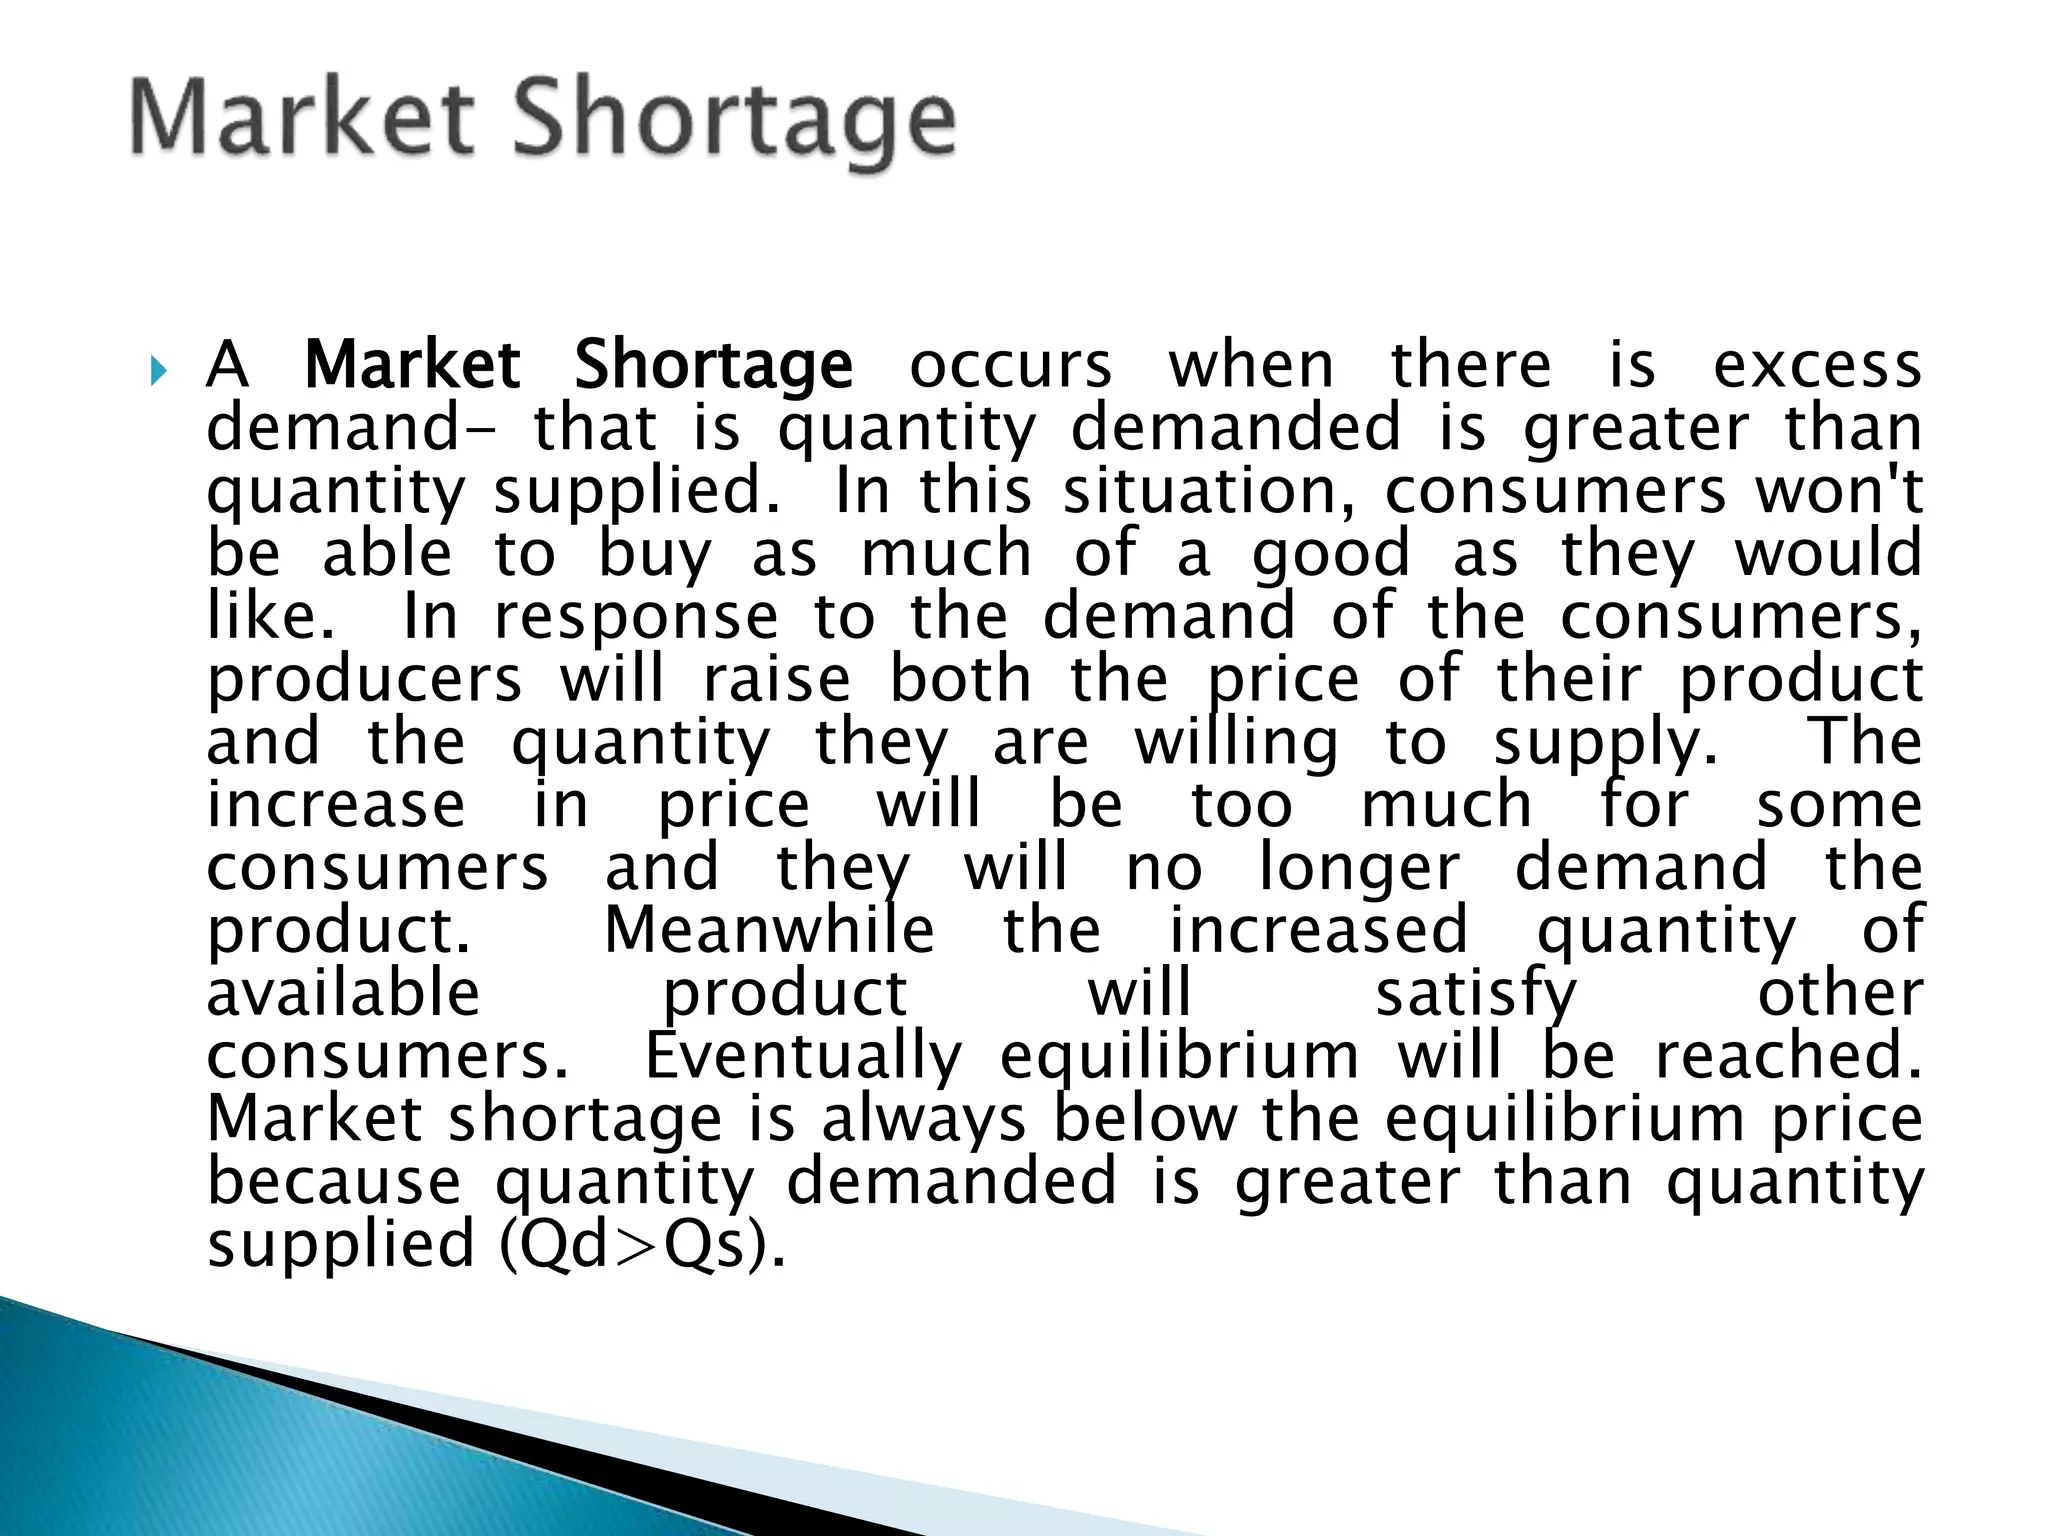
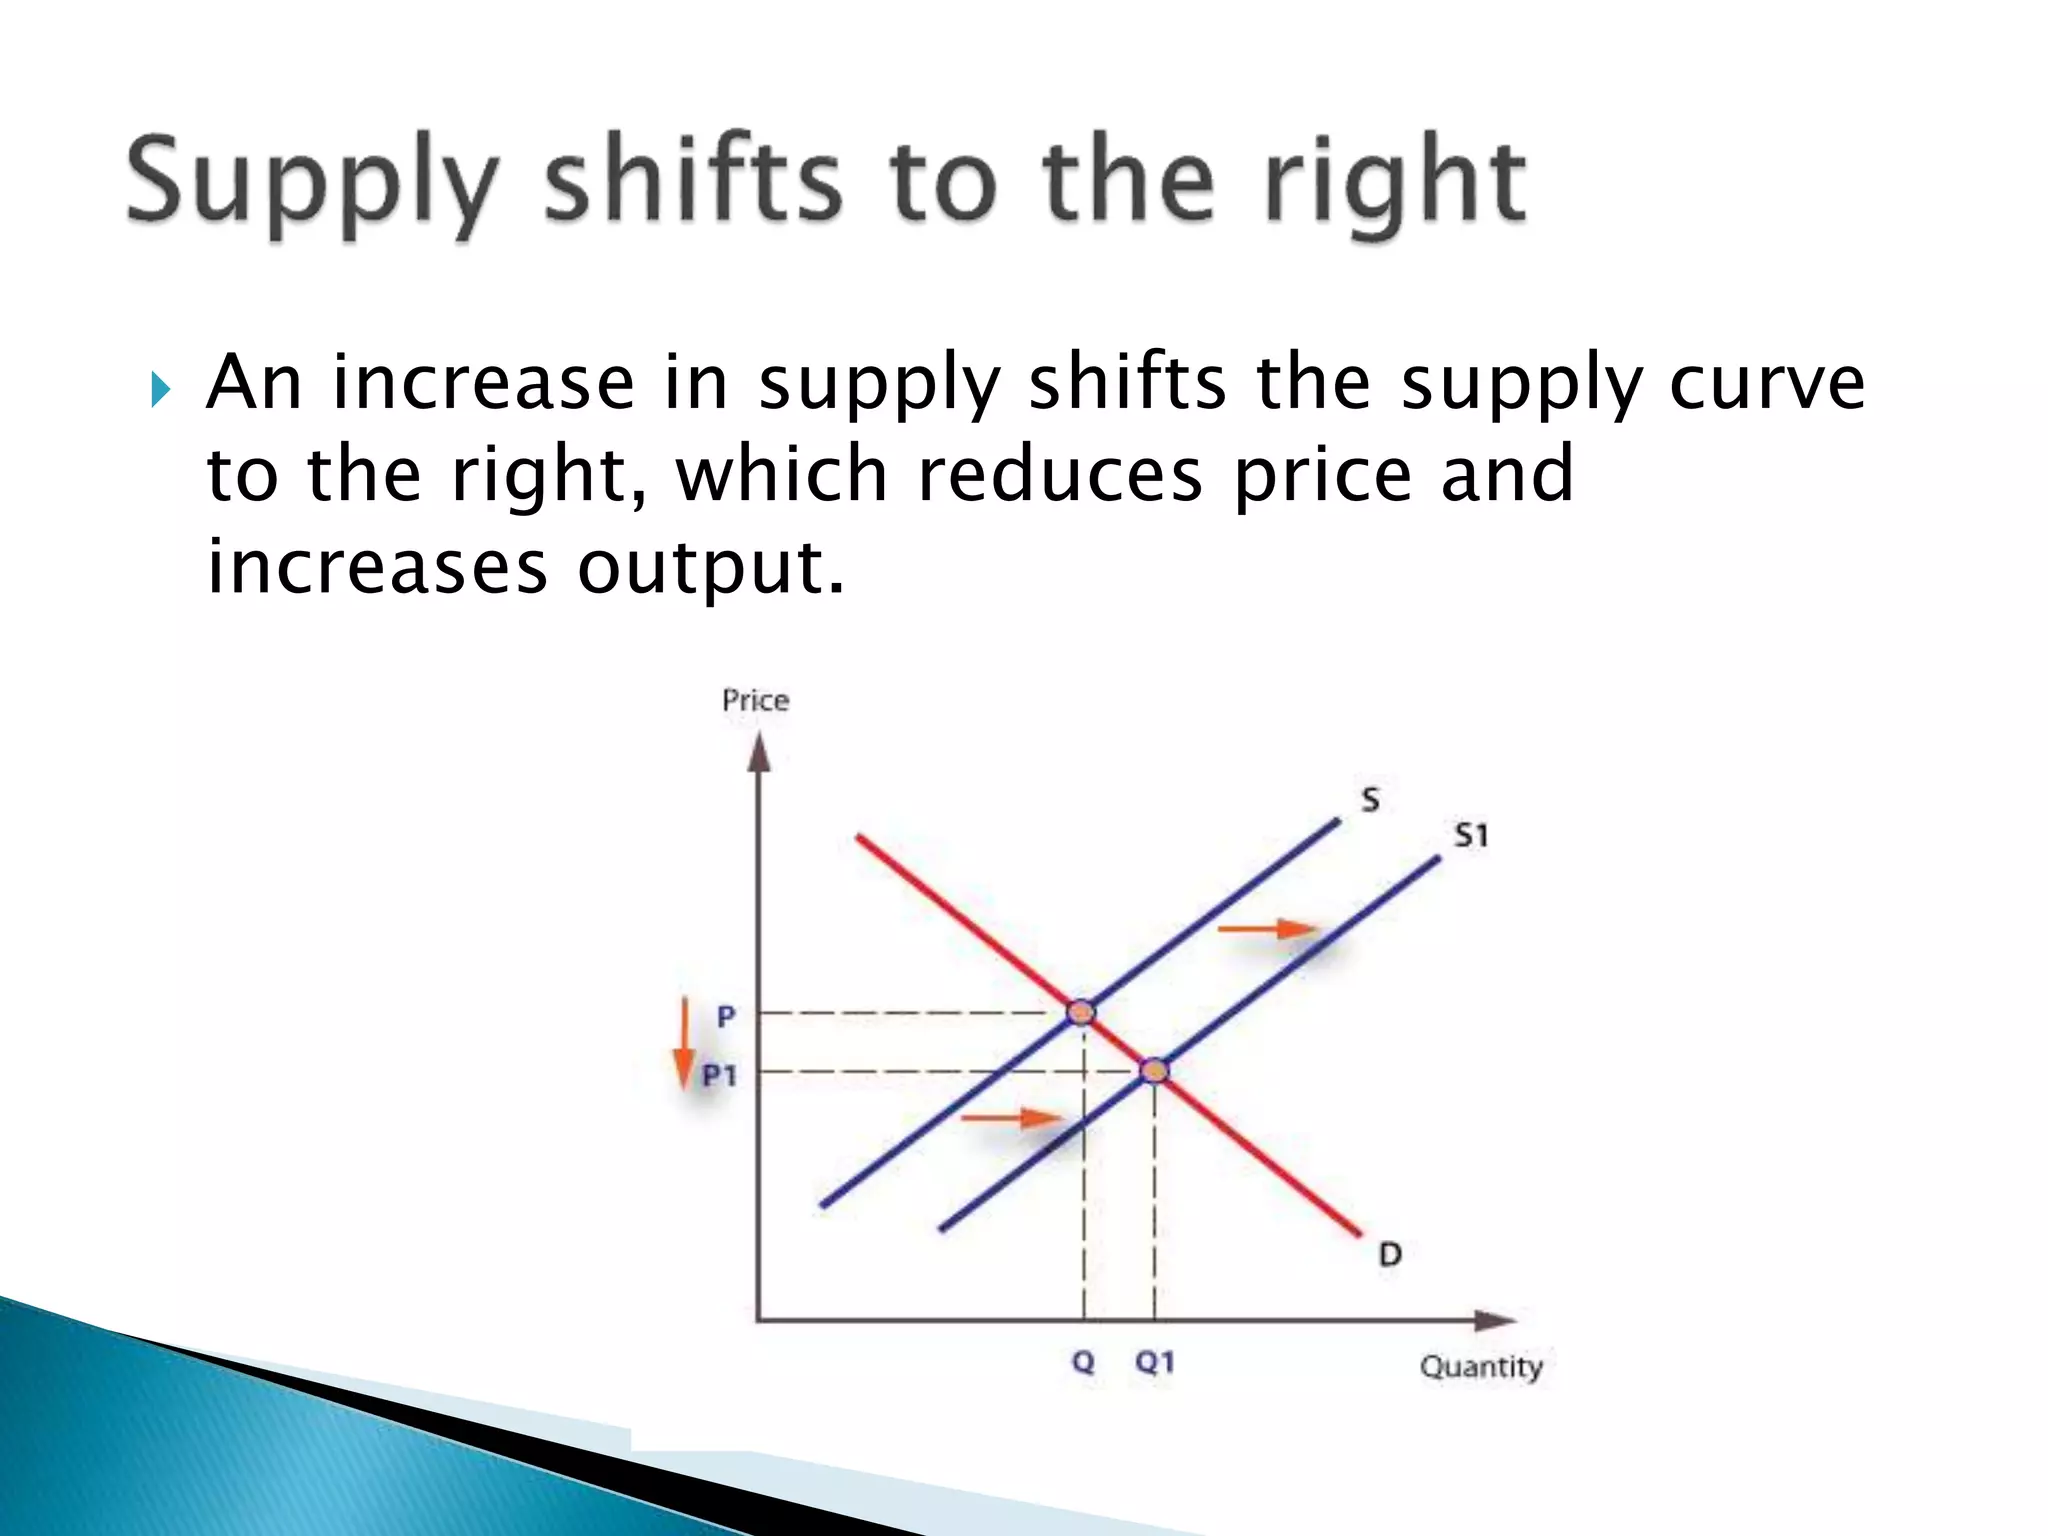
It shows the relationship between consumer demand for goods and services and their prices. Demand theory forms the basis for the demand curve, which relates consumer desire to the amount of goods available.
Its is the power point presentation on the topic demand. it includes various topics like definition of demand, factors affecting demand, law of demand, demand function, expansion-contraction,increase-decrease, price elasticity, income elasticity and cross elasticity. And it is most useful to the students who want to learn the concept of demand.
Macro Economics
For downloading this contact- bikashkumar.bk100@gmail.com
Prepared by Students of University of Rajshahi
Md. Roxy Hossain
Md. Rehan
Md. Refat Al Asmawl
Jil Jawshon Jababir
Md. Hamim Sarwar
Shifts In Demand And Supply And Market EquilibriumShikhar Bafna
1. APPLICATION OF DEMAND AND SUPPLY
2. MARKET EQUILIBRIUM
3. SHIFT IN DEMAND AND SUPPLY
+ABSTRACT OF TOPICS TO BE COVERED:
1. PRICE DETERMINATION UNDER PERFECT COMPETITION
2. EQULIBRIUM PRICE (PERFECT COMPETITION)
WITH THE HELP OF MARKET EQUILIBRIUM, MARKET DEMAND, MARKET SUPPLY AND THE EQUILIBRIUM BETWEEN DEMAND AND SUPPLY AND EFFECTS OF GOVERNMENT INTERVENTION ON MARKET PRICE.
3. EFFECTS OF SHIFT IN DEMAND AND SUPPLY ON EQUILIBRIUM PRICE AND QUANTITY
A.RIGHTWARD AND LEFTWARD SHIFT IN DEMAND
B.RIGHTWARD AND LEFTWARD SHIFT IN SUPPLY
C.SIMULTANEOUS RIGHTWARD AND LEFTWARD SHIFT IN BOTH DEMAND AND SUPPLY
WITH THE HELP OF GRAPHS FOR EACH CASE.
4. CAUSES OF SHIFT IN DEMAND CURVES
5. CAUSES OF SHIFT IN SUPPLY CURVES
It shows the meaning of aggregate demand and aggregate supply. Why aggregate demand curve downward slopping? Show the Short run and Long run Aggregate demand aggregate supply.
The secret way to sell pi coins effortlessly.DOT TECH
Well as we all know pi isn't launched yet. But you can still sell your pi coins effortlessly because some whales in China are interested in holding massive pi coins. And they are willing to pay good money for it. If you are interested in selling I will leave a contact for you. Just telegram this number below. I sold about 3000 pi coins to him and he paid me immediately.
Telegram: @Pi_vendor_247
Financial Assets: Debit vs Equity Securities.pptxWrito-Finance
financial assets represent claim for future benefit or cash. Financial assets are formed by establishing contracts between participants. These financial assets are used for collection of huge amounts of money for business purposes.
Two major Types: Debt Securities and Equity Securities.
Debt Securities are Also known as fixed-income securities or instruments. The type of assets is formed by establishing contracts between investor and issuer of the asset.
• The first type of Debit securities is BONDS. Bonds are issued by corporations and government (both local and national government).
• The second important type of Debit security is NOTES. Apart from similarities associated with notes and bonds, notes have shorter term maturity.
• The 3rd important type of Debit security is TRESURY BILLS. These securities have short-term ranging from three months, six months, and one year. Issuer of such securities are governments.
• Above discussed debit securities are mostly issued by governments and corporations. CERTIFICATE OF DEPOSITS CDs are issued by Banks and Financial Institutions. Risk factor associated with CDs gets reduced when issued by reputable institutions or Banks.
Following are the risk attached with debt securities: Credit risk, interest rate risk and currency risk
There are no fixed maturity dates in such securities, and asset’s value is determined by company’s performance. There are two major types of equity securities: common stock and preferred stock.
Common Stock: These are simple equity securities and bear no complexities which the preferred stock bears. Holders of such securities or instrument have the voting rights when it comes to select the company’s board of director or the business decisions to be made.
Preferred Stock: Preferred stocks are sometime referred to as hybrid securities, because it contains elements of both debit security and equity security. Preferred stock confers ownership rights to security holder that is why it is equity instrument
<a href="https://www.writofinance.com/equity-securities-features-types-risk/" >Equity securities </a> as a whole is used for capital funding for companies. Companies have multiple expenses to cover. Potential growth of company is required in competitive market. So, these securities are used for capital generation, and then uses it for company’s growth.
Concluding remarks
Both are employed in business. Businesses are often established through debit securities, then what is the need for equity securities. Companies have to cover multiple expenses and expansion of business. They can also use equity instruments for repayment of debits. So, there are multiple uses for securities. As an investor, you need tools for analysis. Investment decisions are made by carefully analyzing the market. For better analysis of the stock market, investors often employ financial analysis of companies.
Falcon stands out as a top-tier P2P Invoice Discounting platform in India, bridging esteemed blue-chip companies and eager investors. Our goal is to transform the investment landscape in India by establishing a comprehensive destination for borrowers and investors with diverse profiles and needs, all while minimizing risk. What sets Falcon apart is the elimination of intermediaries such as commercial banks and depository institutions, allowing investors to enjoy higher yields.
What price will pi network be listed on exchangesDOT TECH
The rate at which pi will be listed is practically unknown. But due to speculations surrounding it the predicted rate is tends to be from 30$ — 50$.
So if you are interested in selling your pi network coins at a high rate tho. Or you can't wait till the mainnet launch in 2026. You can easily trade your pi coins with a merchant.
A merchant is someone who buys pi coins from miners and resell them to Investors looking forward to hold massive quantities till mainnet launch.
I will leave the telegram contact of my personal pi vendor to trade with.
@Pi_vendor_247
Turin Startup Ecosystem 2024 - Ricerca sulle Startup e il Sistema dell'Innov...Quotidiano Piemontese
Turin Startup Ecosystem 2024
Una ricerca de il Club degli Investitori, in collaborazione con ToTeM Torino Tech Map e con il supporto della ESCP Business School e di Growth Capital
Exploring Abhay Bhutada’s Views After Poonawalla Fincorp’s Collaboration With...beulahfernandes8
The financial landscape in India has witnessed a significant development with the recent collaboration between Poonawalla Fincorp and IndusInd Bank.
The launch of the co-branded credit card, the IndusInd Bank Poonawalla Fincorp eLITE RuPay Platinum Credit Card, marks a major milestone for both entities.
This strategic move aims to redefine and elevate the banking experience for customers.
How to get verified on Coinbase Account?_.docxBuy bitget
t's important to note that buying verified Coinbase accounts is not recommended and may violate Coinbase's terms of service. Instead of searching to "buy verified Coinbase accounts," follow the proper steps to verify your own account to ensure compliance and security.
The European Unemployment Puzzle: implications from population agingGRAPE
We study the link between the evolving age structure of the working population and unemployment. We build a large new Keynesian OLG model with a realistic age structure, labor market frictions, sticky prices, and aggregate shocks. Once calibrated to the European economy, we quantify the extent to which demographic changes over the last three decades have contributed to the decline of the unemployment rate. Our findings yield important implications for the future evolution of unemployment given the anticipated further aging of the working population in Europe. We also quantify the implications for optimal monetary policy: lowering inflation volatility becomes less costly in terms of GDP and unemployment volatility, which hints that optimal monetary policy may be more hawkish in an aging society. Finally, our results also propose a partial reversal of the European-US unemployment puzzle due to the fact that the share of young workers is expected to remain robust in the US.
Currently pi network is not tradable on binance or any other exchange because we are still in the enclosed mainnet.
Right now the only way to sell pi coins is by trading with a verified merchant.
What is a pi merchant?
A pi merchant is someone verified by pi network team and allowed to barter pi coins for goods and services.
Since pi network is not doing any pre-sale The only way exchanges like binance/huobi or crypto whales can get pi is by buying from miners. And a merchant stands in between the exchanges and the miners.
I will leave the telegram contact of my personal pi merchant. I and my friends has traded more than 6000pi coins successfully
Tele-gram
@Pi_vendor_247
how can i use my minded pi coins I need some funds.DOT TECH
If you are interested in selling your pi coins, i have a verified pi merchant, who buys pi coins and resell them to exchanges looking forward to hold till mainnet launch.
Because the core team has announced that pi network will not be doing any pre-sale. The only way exchanges like huobi, bitmart and hotbit can get pi is by buying from miners.
Now a merchant stands in between these exchanges and the miners. As a link to make transactions smooth. Because right now in the enclosed mainnet you can't sell pi coins your self. You need the help of a merchant,
i will leave the telegram contact of my personal pi merchant below. 👇 I and my friends has traded more than 3000pi coins with him successfully.
@Pi_vendor_247
US Economic Outlook - Being Decided - M Capital Group August 2021.pdfpchutichetpong
The U.S. economy is continuing its impressive recovery from the COVID-19 pandemic and not slowing down despite re-occurring bumps. The U.S. savings rate reached its highest ever recorded level at 34% in April 2020 and Americans seem ready to spend. The sectors that had been hurt the most by the pandemic specifically reduced consumer spending, like retail, leisure, hospitality, and travel, are now experiencing massive growth in revenue and job openings.
Could this growth lead to a “Roaring Twenties”? As quickly as the U.S. economy contracted, experiencing a 9.1% drop in economic output relative to the business cycle in Q2 2020, the largest in recorded history, it has rebounded beyond expectations. This surprising growth seems to be fueled by the U.S. government’s aggressive fiscal and monetary policies, and an increase in consumer spending as mobility restrictions are lifted. Unemployment rates between June 2020 and June 2021 decreased by 5.2%, while the demand for labor is increasing, coupled with increasing wages to incentivize Americans to rejoin the labor force. Schools and businesses are expected to fully reopen soon. In parallel, vaccination rates across the country and the world continue to rise, with full vaccination rates of 50% and 14.8% respectively.
However, it is not completely smooth sailing from here. According to M Capital Group, the main risks that threaten the continued growth of the U.S. economy are inflation, unsettled trade relations, and another wave of Covid-19 mutations that could shut down the world again. Have we learned from the past year of COVID-19 and adapted our economy accordingly?
“In order for the U.S. economy to continue growing, whether there is another wave or not, the U.S. needs to focus on diversifying supply chains, supporting business investment, and maintaining consumer spending,” says Grace Feeley, a research analyst at M Capital Group.
While the economic indicators are positive, the risks are coming closer to manifesting and threatening such growth. The new variants spreading throughout the world, Delta, Lambda, and Gamma, are vaccine-resistant and muddy the predictions made about the economy and health of the country. These variants bring back the feeling of uncertainty that has wreaked havoc not only on the stock market but the mindset of people around the world. MCG provides unique insight on how to mitigate these risks to possibly ensure a bright economic future.
how to swap pi coins to foreign currency withdrawable.DOT TECH
As of my last update, Pi is still in the testing phase and is not tradable on any exchanges.
However, Pi Network has announced plans to launch its Testnet and Mainnet in the future, which may include listing Pi on exchanges.
The current method for selling pi coins involves exchanging them with a pi vendor who purchases pi coins for investment reasons.
If you want to sell your pi coins, reach out to a pi vendor and sell them to anyone looking to sell pi coins from any country around the globe.
Below is the contact information for my personal pi vendor.
Telegram: @Pi_vendor_247
what is the future of Pi Network currency.DOT TECH
The future of the Pi cryptocurrency is uncertain, and its success will depend on several factors. Pi is a relatively new cryptocurrency that aims to be user-friendly and accessible to a wide audience. Here are a few key considerations for its future:
Message: @Pi_vendor_247 on telegram if u want to sell PI COINS.
1. Mainnet Launch: As of my last knowledge update in January 2022, Pi was still in the testnet phase. Its success will depend on a successful transition to a mainnet, where actual transactions can take place.
2. User Adoption: Pi's success will be closely tied to user adoption. The more users who join the network and actively participate, the stronger the ecosystem can become.
3. Utility and Use Cases: For a cryptocurrency to thrive, it must offer utility and practical use cases. The Pi team has talked about various applications, including peer-to-peer transactions, smart contracts, and more. The development and implementation of these features will be essential.
4. Regulatory Environment: The regulatory environment for cryptocurrencies is evolving globally. How Pi navigates and complies with regulations in various jurisdictions will significantly impact its future.
5. Technology Development: The Pi network must continue to develop and improve its technology, security, and scalability to compete with established cryptocurrencies.
6. Community Engagement: The Pi community plays a critical role in its future. Engaged users can help build trust and grow the network.
7. Monetization and Sustainability: The Pi team's monetization strategy, such as fees, partnerships, or other revenue sources, will affect its long-term sustainability.
It's essential to approach Pi or any new cryptocurrency with caution and conduct due diligence. Cryptocurrency investments involve risks, and potential rewards can be uncertain. The success and future of Pi will depend on the collective efforts of its team, community, and the broader cryptocurrency market dynamics. It's advisable to stay updated on Pi's development and follow any updates from the official Pi Network website or announcements from the team.
2. Supply means the quantities of goods and
services made available for sale at a fixed
price in a fixed period of time. This fixed
period of time depends upon the nature of
goods and may be a day, a week, a month, a
year and more. Fixed price indicates the cost
of production and a normal profit.
In economics, free goods are not included in
supply. The availability of goods will be
known as supply only when income is earned
from sale.
3. On the other hand, if the goods are produced
and are kept for self-use, then also it may not
be called supply. Therefore, the lists of goods
which are brought to the market for sale at
different prices are known as the supply.
4. There is direct relationship between the price
of a commodity and its quantity offered for
sale over a specified period of time.
When the price of a goods rises, quantity
supplied increases and as price falls, the
quantity supplied of goods and services
decreases. This relationship between price
and the quantities which suppliers are
prepared to offer for sale is called the law of
supply. (Ceteris paribus)
6. In the figure price is plotted on the vertical
axis OY and the quantity supplied on the
horizontal axis OX. The four points d, c, b,
and a show each price quantity combination.
The supply curve S S’/ slopes upward from
left to right indicating that less quantity is
offered for sale at lower price and more at
higher prices by the sellers not supply curve
is usually positively sloped.
7. 1. Individual supply schedule
2. Market supply schedule
Individual Supply schedule:
An individual supply schedule represents the
price quantity combination for a single seller.
Market supply schedule:
The market supply schedule represents the
price-quantity combinations for all sellers of a
particular good. The market supply curve is the
horizontal summation of all individual supply
curves.
8. Shifts in supply curve means changes in
supply. While explaining the law of supply, we
have stated that that other things remaining
the same (ceteris paribus) the amount of the
commodity offered for sale increases with the
rise in price and decreases with a fall in price.
When there is an increase in supply due to
one or more than one non-price factor (which
was held constant) such as production
techniques, resource prices, changes in the
price of other commodities, etc., there is a
rise in supply.
9. The entire supply curve shifts to the right of
original supply curve indicating that more
quantity is offered for sale at the same price per
time period. If due to one or a combination of
non-price factors, less quantity is brought into
the market for sale at each price, the supply is
said to have fallen. In case of fall in supply, the
supply curve shifts to the left of the original
supply curve. The rise and fall of supply curve
(shifts in supply curve) is explained with the help
of an imaginary schedule and a diagram.
10. Price per shirt
(Dollars )
Original quantity
Supplied per
Week
Rise in supply Fall in supply
50 200 320 140
40 160 200 100
30 100 150 70
20 39 100 15
11.
12. Changes in factor price. The rise of fall in supply may take
place due to changes in the cost of production of a
commodity. If the prices of various factor of production
used in the production of a particular commodity increase
of it total cost of production. There will be reduction in the
supply of that commodity at each price because the
amount demanded decreases with a rise in price.
Conversely, if the prices of the various factors of
production fall down, it will result in lowering the cost of
production and so an increase in the supply on varying
prices.
Changes in technique. The supply of a commodity may also
be affected by progress in technique. If an improvement in
technique takes place in a particular industry, it will help in
reducing its cost of production. This will result in greater
production and so an increase in the supply of the
commodity. The supply curve will shifts to the right of the
original supply curve.
13. Improvement in the means of transport. The supply
of the commodity may also increase due to
improvement in the means of communication and
transport. If the means of transport is cheap and fast,
then supply of the commodity can be increased at a
short notice at lower price.
Climatic changes in case of agricultural products. The
supply of agricultural products is directly affected by
the weather conditions and the use of the better
methods of production. If rain is timely plentiful well-
distributed; and improve methods of cultivation are
employed then other things remaining the same,
there will be bumper crops. It would then be possible
to increase the supply of the agriculture products.
14. Political changes. The increase or decrease in supply may
also place due to political disturbances in a country. If
country wages wars against another country or some kind
of political disturbances take place just as we had at the
time of partition, then the channels of production are
disorganized. It results in the decrease of certain goods
the supply curve shifts to the left of originals curve.
Taxation policy. If a government levies heavy taxes on the
import of particular commodities, then the supply of these
commodities is reduced at each price. The supply curve
shifts to the left .conversely if the taxes on output in the
country are low and government encourages the import of
foreign commodities, then the supply can be increased
easily. The supply curve shifts to the right of originals
supply curve.
15. The subsidies. Monetary assistance granted
by a government to a person or group in
support of an enterprise regarded as being in
the public interest. They normally take form
of payments to producers. Usually in the case
of agricultural products like coffee.
Goals of firms. If the firms expect higher
profits in the future, they will take the risk
and produce goods on large scale resulting in
larger supply of the commodities. The supply
curve shifts to the right.
16. Meaning
Market equilibrium is a market state where
the supply in the market is equal to the
demand in the market (supply = demand). At
this point, there is no tendency for prices to
change. The equilibrium price is the price of a
good or service when the supply of it is equal
to the demand for it in the market. It is
denoted by E.
17. Price of Soft Drink in US $ Quantity Demanded of Soft
drinks
Quantity Supplied of Soft
drinks
2 40 0
4 30 10
6 20 20
8 10 30
10 0 40
18.
19. In above figure 1 you will find that the supply
and demand curves are intersecting to each
other at Price = $6, and Quantity = 20. In this
market, the equilibrium price is $6 per unit,
and equilibrium quantity is 20 units. At this
price level, market is in equilibrium. Quantity
supplied is equal to quantity demanded ( Qs =
Qd).
20. A Market Surplus occurs when there is excess supply-
that is quantity supplied is greater than quantity
demanded. In this situation, some producers won't
be able to sell all their goods. This will induce them
to lower their price to make their product more
appealing. In order to stay competitive many firms
will lower their prices thus lowering the market price
for the product. In response to the lower price,
consumers will increase their quantity demanded,
moving the market toward an equilibrium price and
quantity. In this situation, excess supply has exerted
downward pressure on the price of the product.
Market surplus is always above the equilibrium price
because quantity supplied is greater than quantity
demanded (Qs>Qd).
21.
22. Suppose price is P1 in the graph below, only Q1
will be sold because this is all that buyers will
purchase, even though sellers are willing to sell
more, Q2. The difference Q2 - Q1 is called a
surplus. In this situation the buyers are in
equilibrium because they can buy all they want to
buy at the going price. However, the sellers are
not in equilibrium and will compete among
themselves to get rid of the surplus. Some sellers
will be willing to offer their product at a lower
price. Buyers are always willing to move down the
demand curve, so there is a tendency to move
downward toward market equilibrium in the
graph.
23. A Market Shortage occurs when there is excess
demand- that is quantity demanded is greater than
quantity supplied. In this situation, consumers won't
be able to buy as much of a good as they would
like. In response to the demand of the consumers,
producers will raise both the price of their product
and the quantity they are willing to supply. The
increase in price will be too much for some
consumers and they will no longer demand the
product. Meanwhile the increased quantity of
available product will satisfy other
consumers. Eventually equilibrium will be reached.
Market shortage is always below the equilibrium price
because quantity demanded is greater than quantity
supplied (Qd>Qs).
24.
25. Suppose price is P1 in the graph below, only Q1
will be sold even though buyers would like to buy
Q2. The difference Q2 - Q1 represents a
shortage. The sellers are in equilibrium in this
situation because they can sell everything they
want to sell at this price, but buyers are not.
Some buyers who cannot obtain the product are
willing to offer more, and sellers are always
willing to accept a higher price. Therefore, the
actions of the buyers, as they compete with each
other to obtain the amount that is available, drive
the price upward in this model toward market
equilibrium.
26. Equilibrium price and quantity are determined
by the intersection of supply and demand. A
change in supply, or demand, or both, will
necessarily change the equilibrium price,
quantity or both. It is highly unlikely that the
change in supply and demand perfectly offset
one another so that equilibrium remains the
same.
27. This example is based on the assumption of
Ceteris Paribus(all things are remaining
constant).
PRICE (RWF) QD QD1 QUANTITY
SUPPLIED
700 0 200 1000
600 100 300 900
500 200 400 800
400 300 500 700
300 400 600 600
200 500 700 500
100 600 800 400
28. There are four basic causes of a change in equilibrium price
and quantity:
Demand shifts to the right : An increase in demand shifts
the demand curve to the right, and raises equilibrium price
and equilibrium output.
29. An decrease in demand shifts the demand
curve to the left, and reduce equilibrium price
and equilibrium output.
30. An increase in supply shifts the supply curve
to the right, which reduces price and
increases output.
31. A decrease in supply shifts the supply curve
to the left, which raises price but reduces
output.