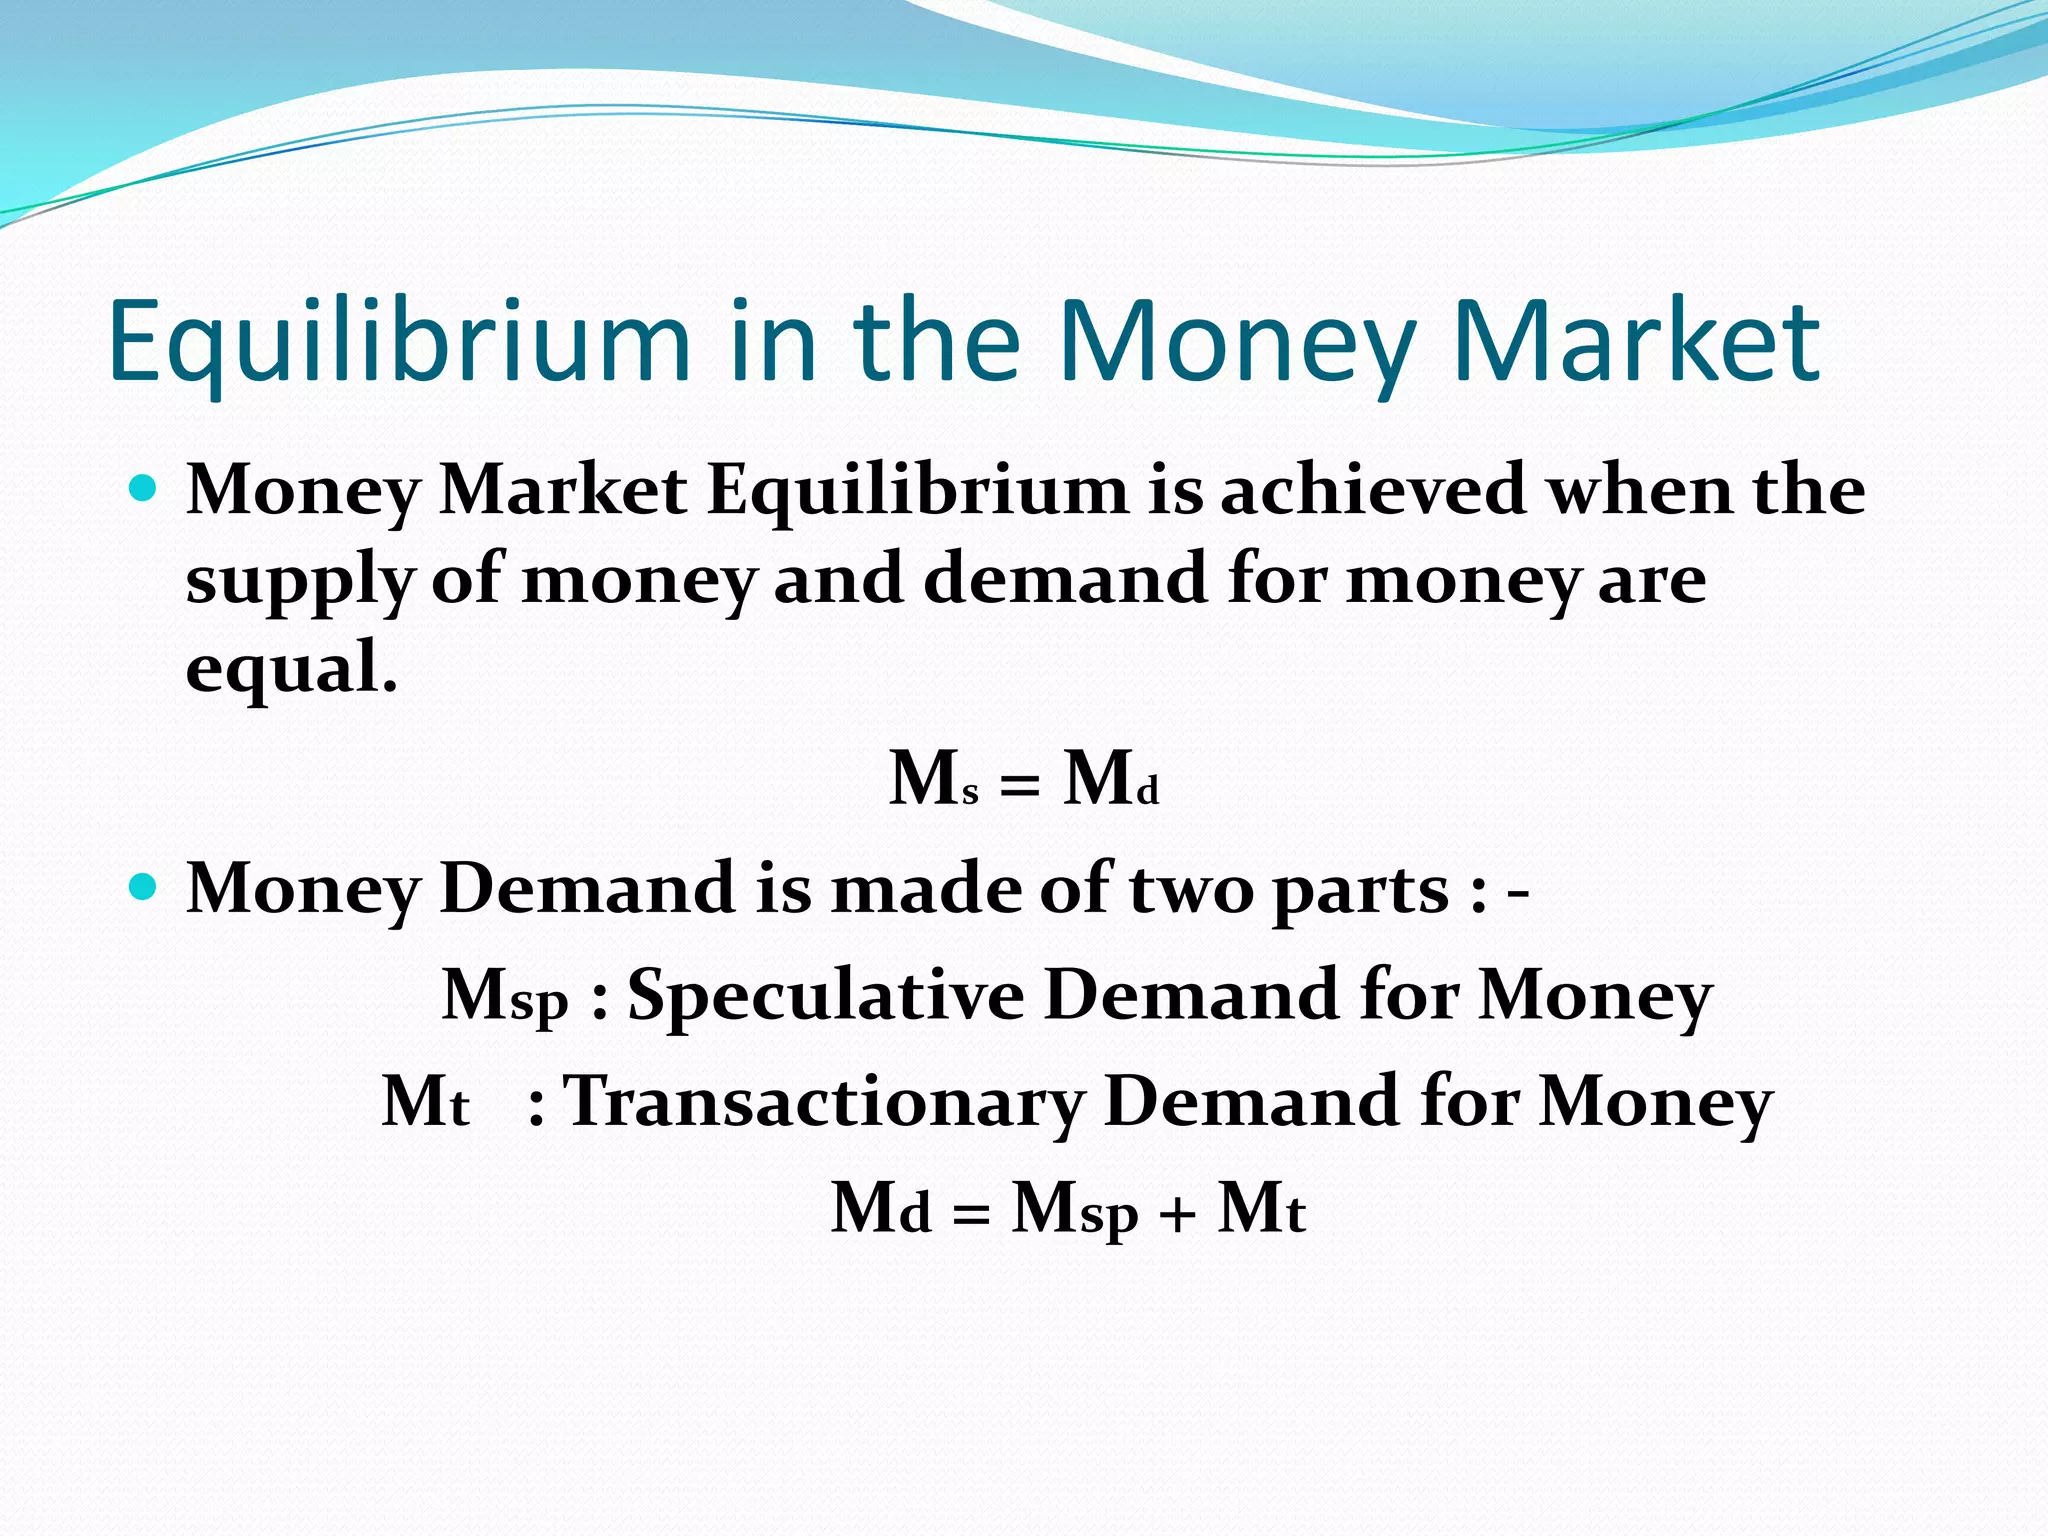
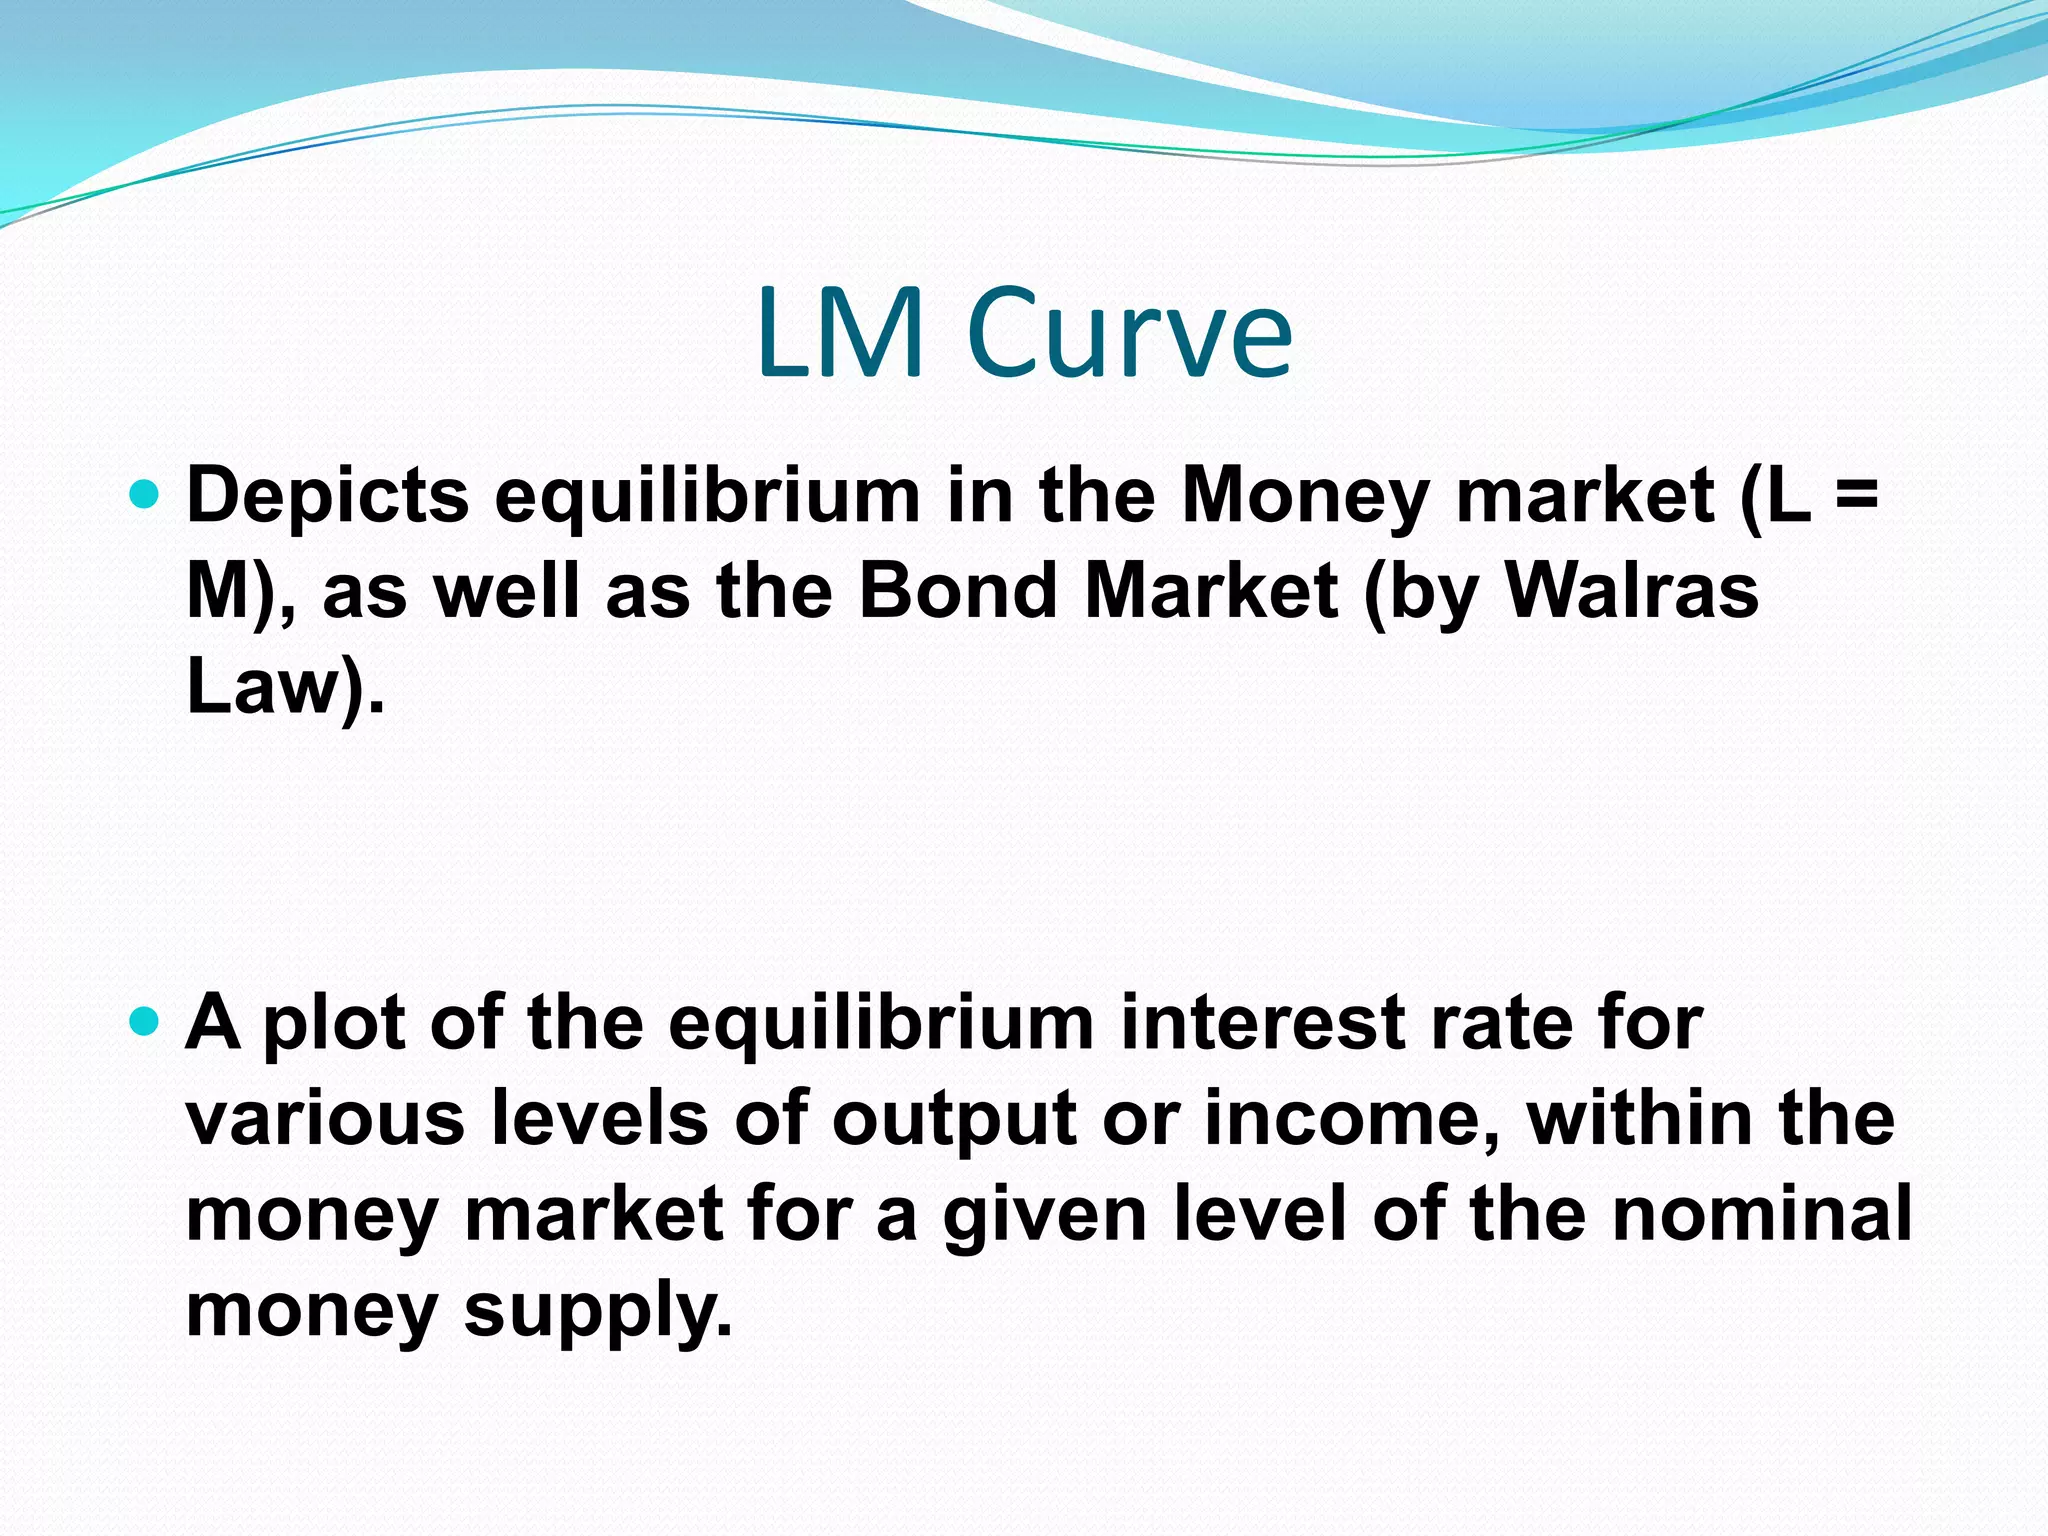
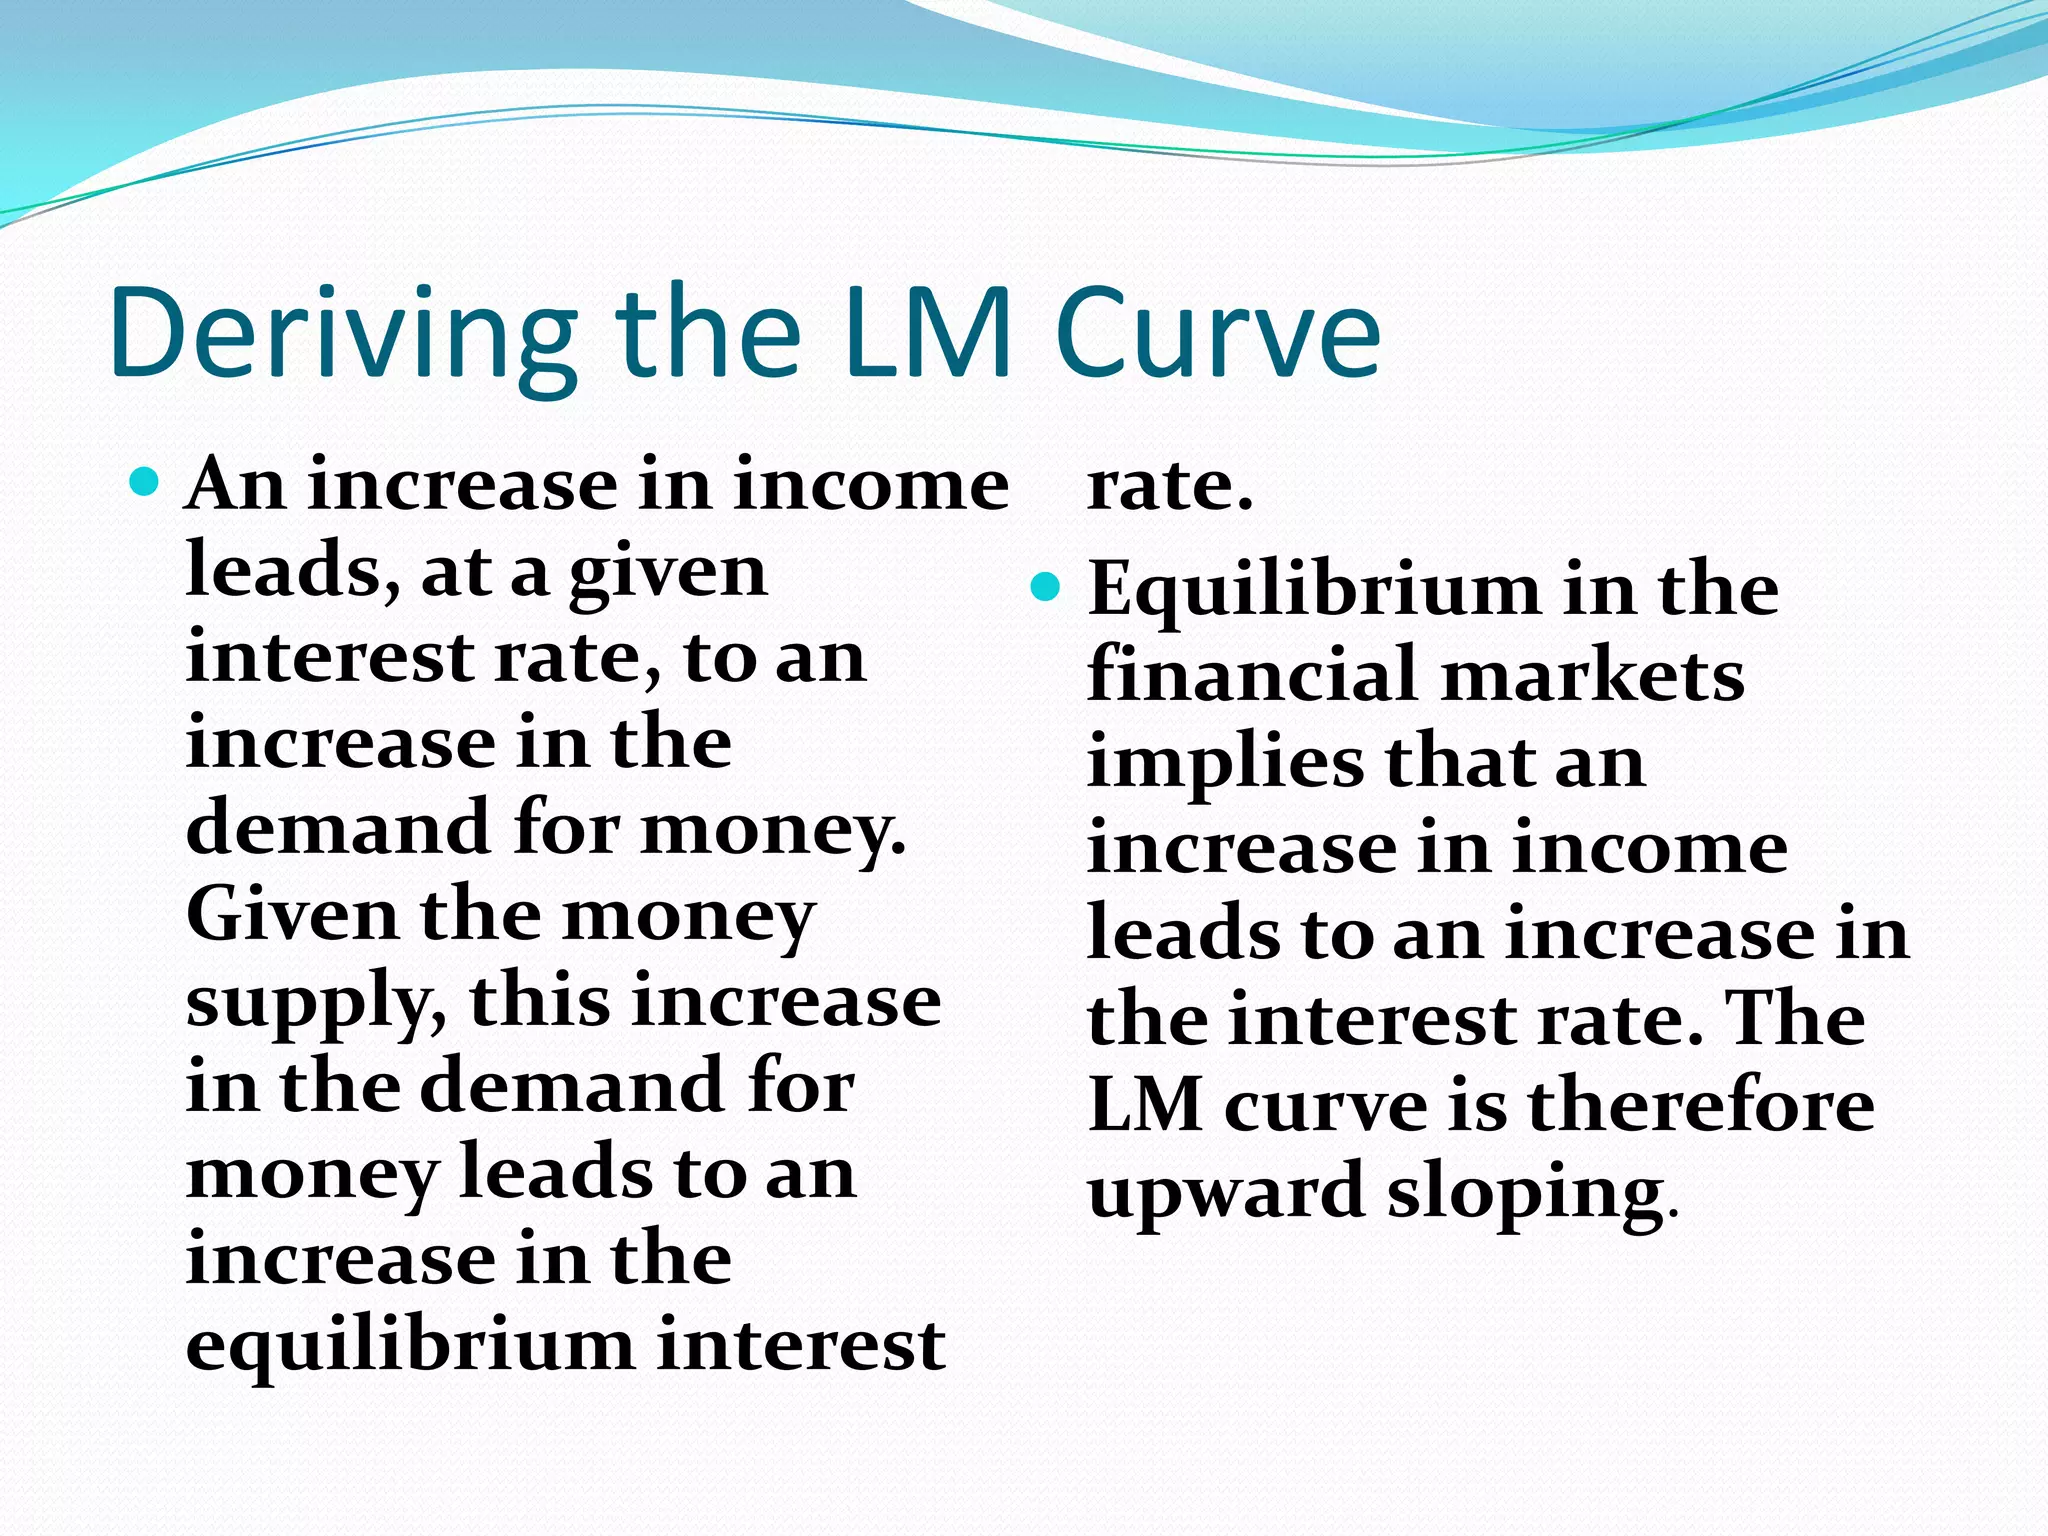
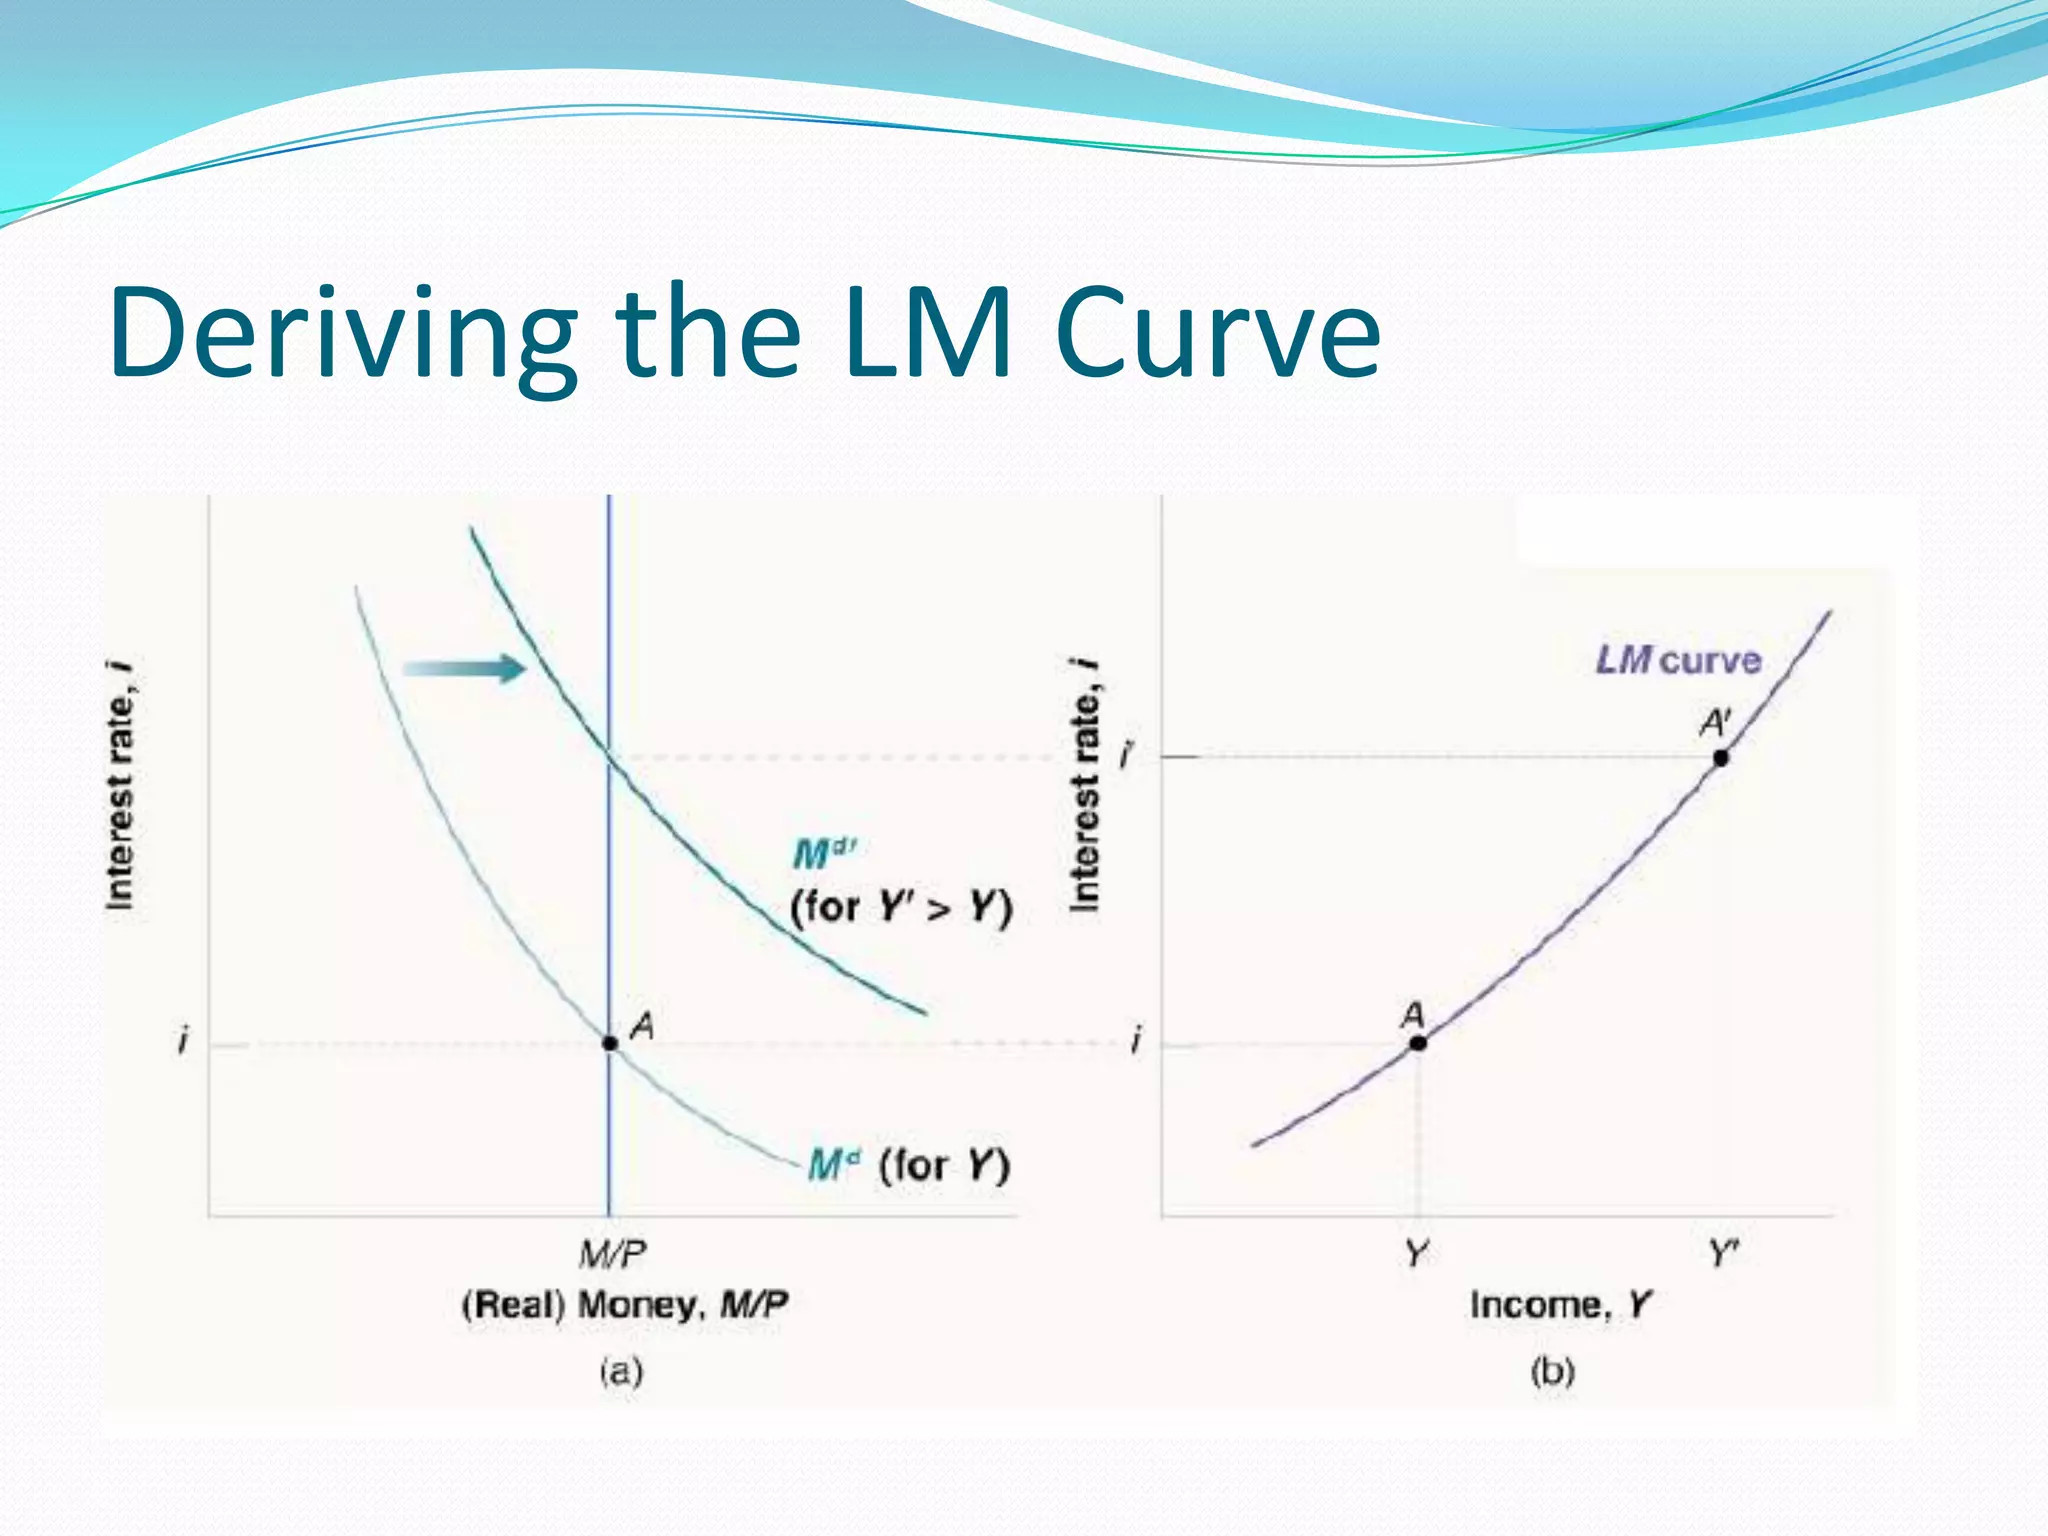
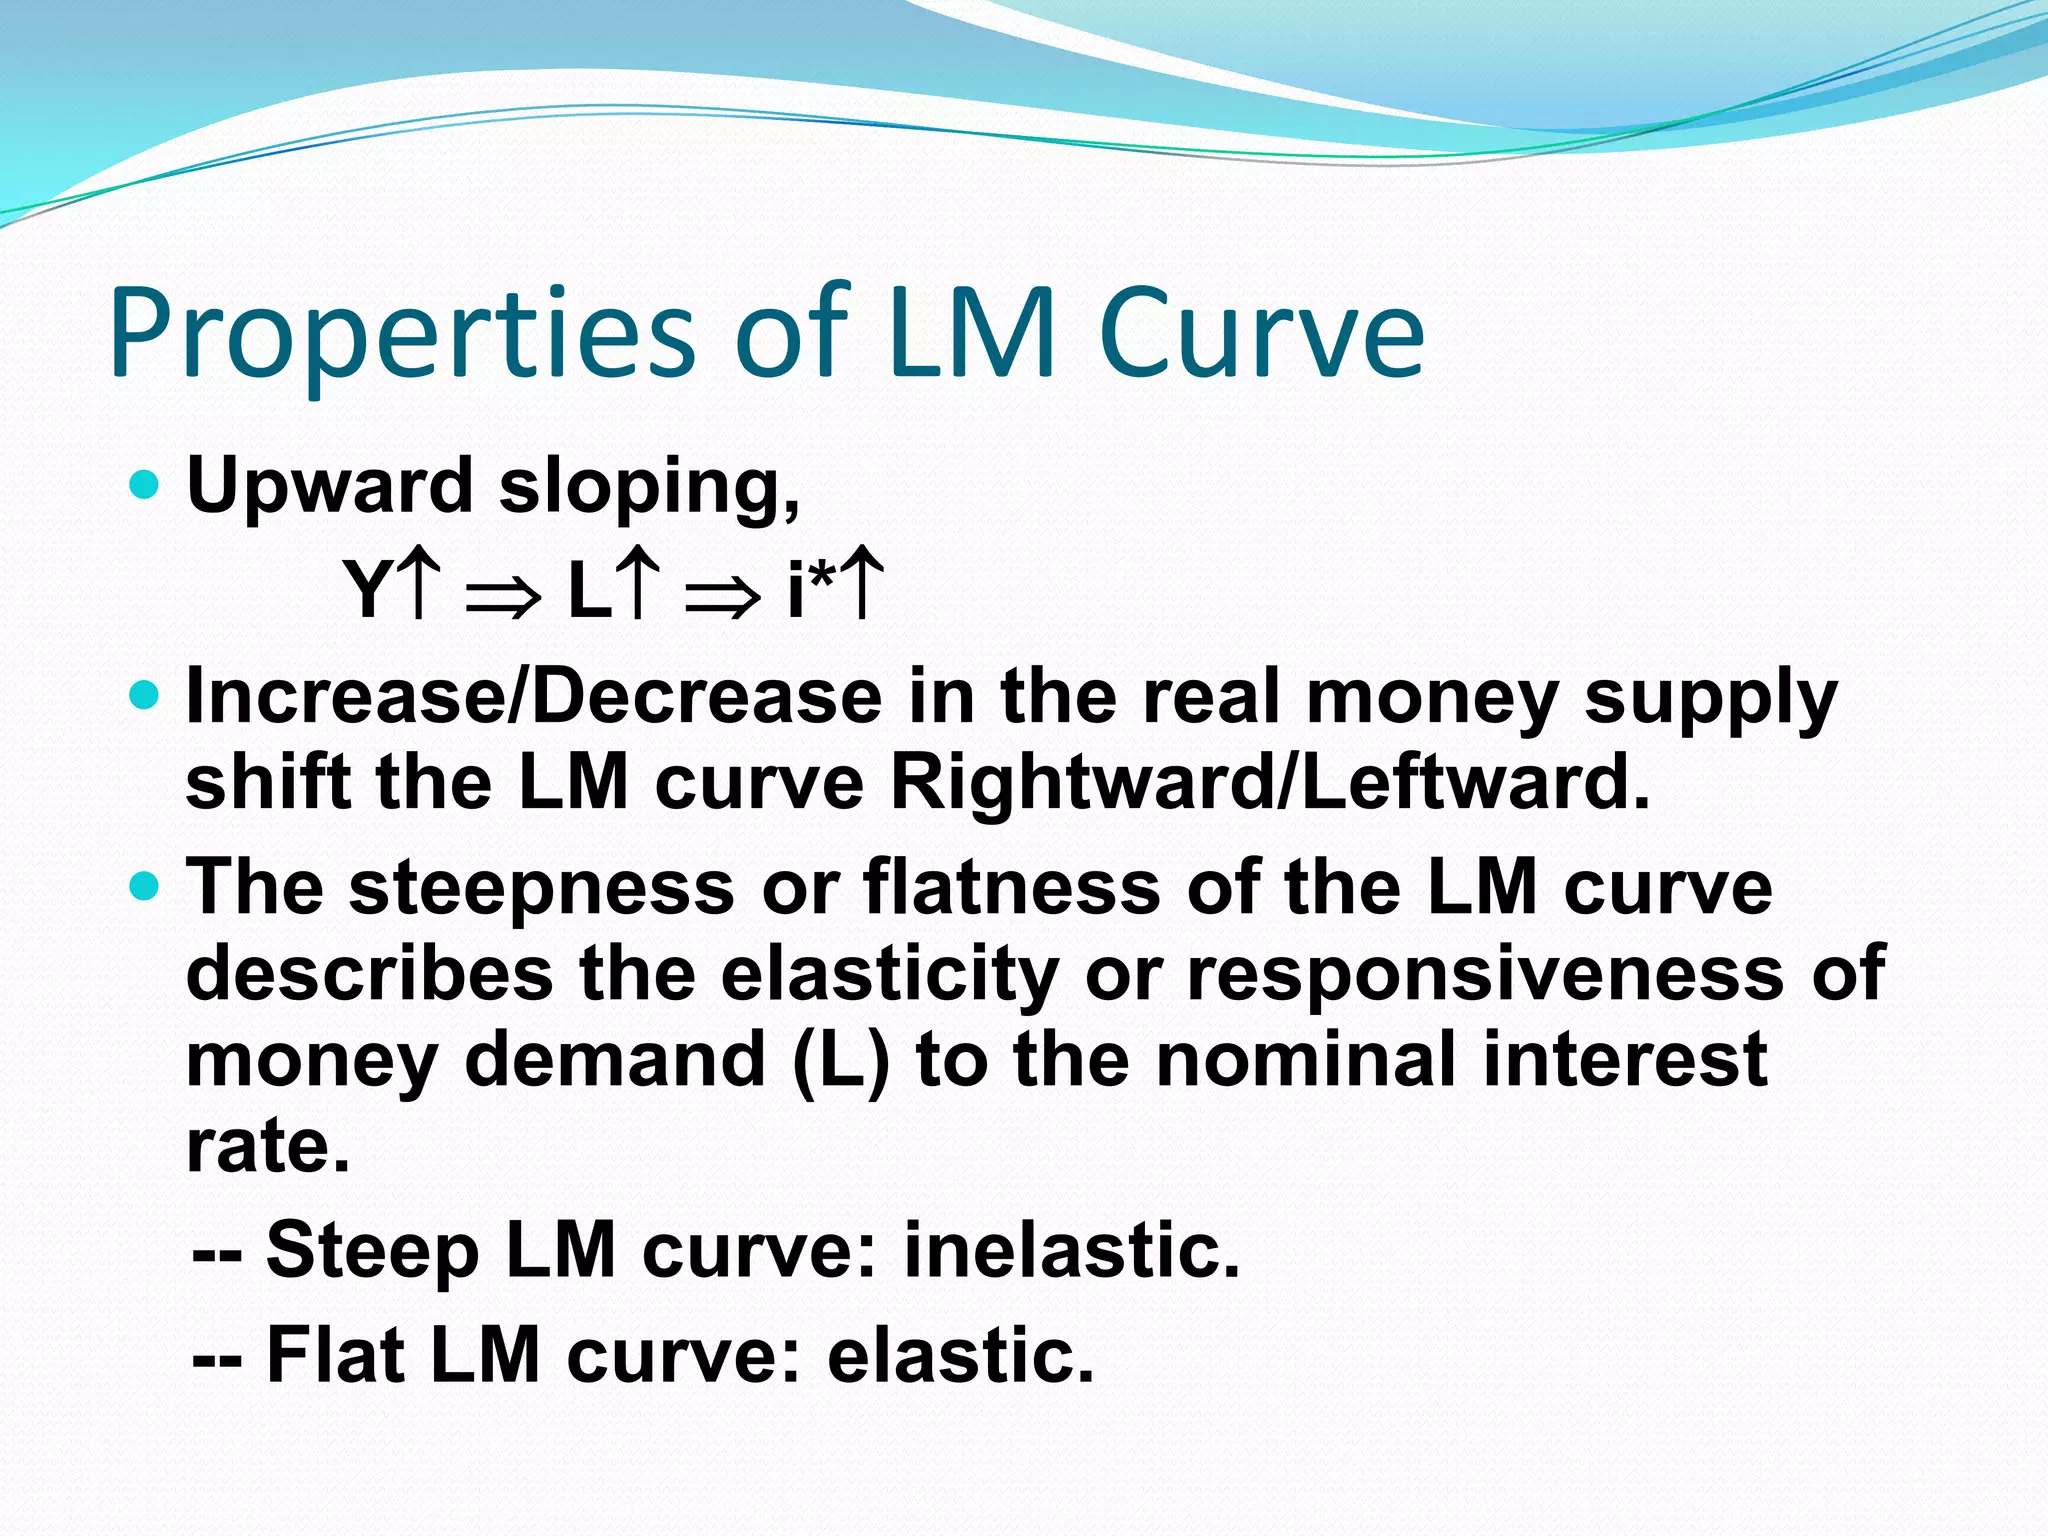
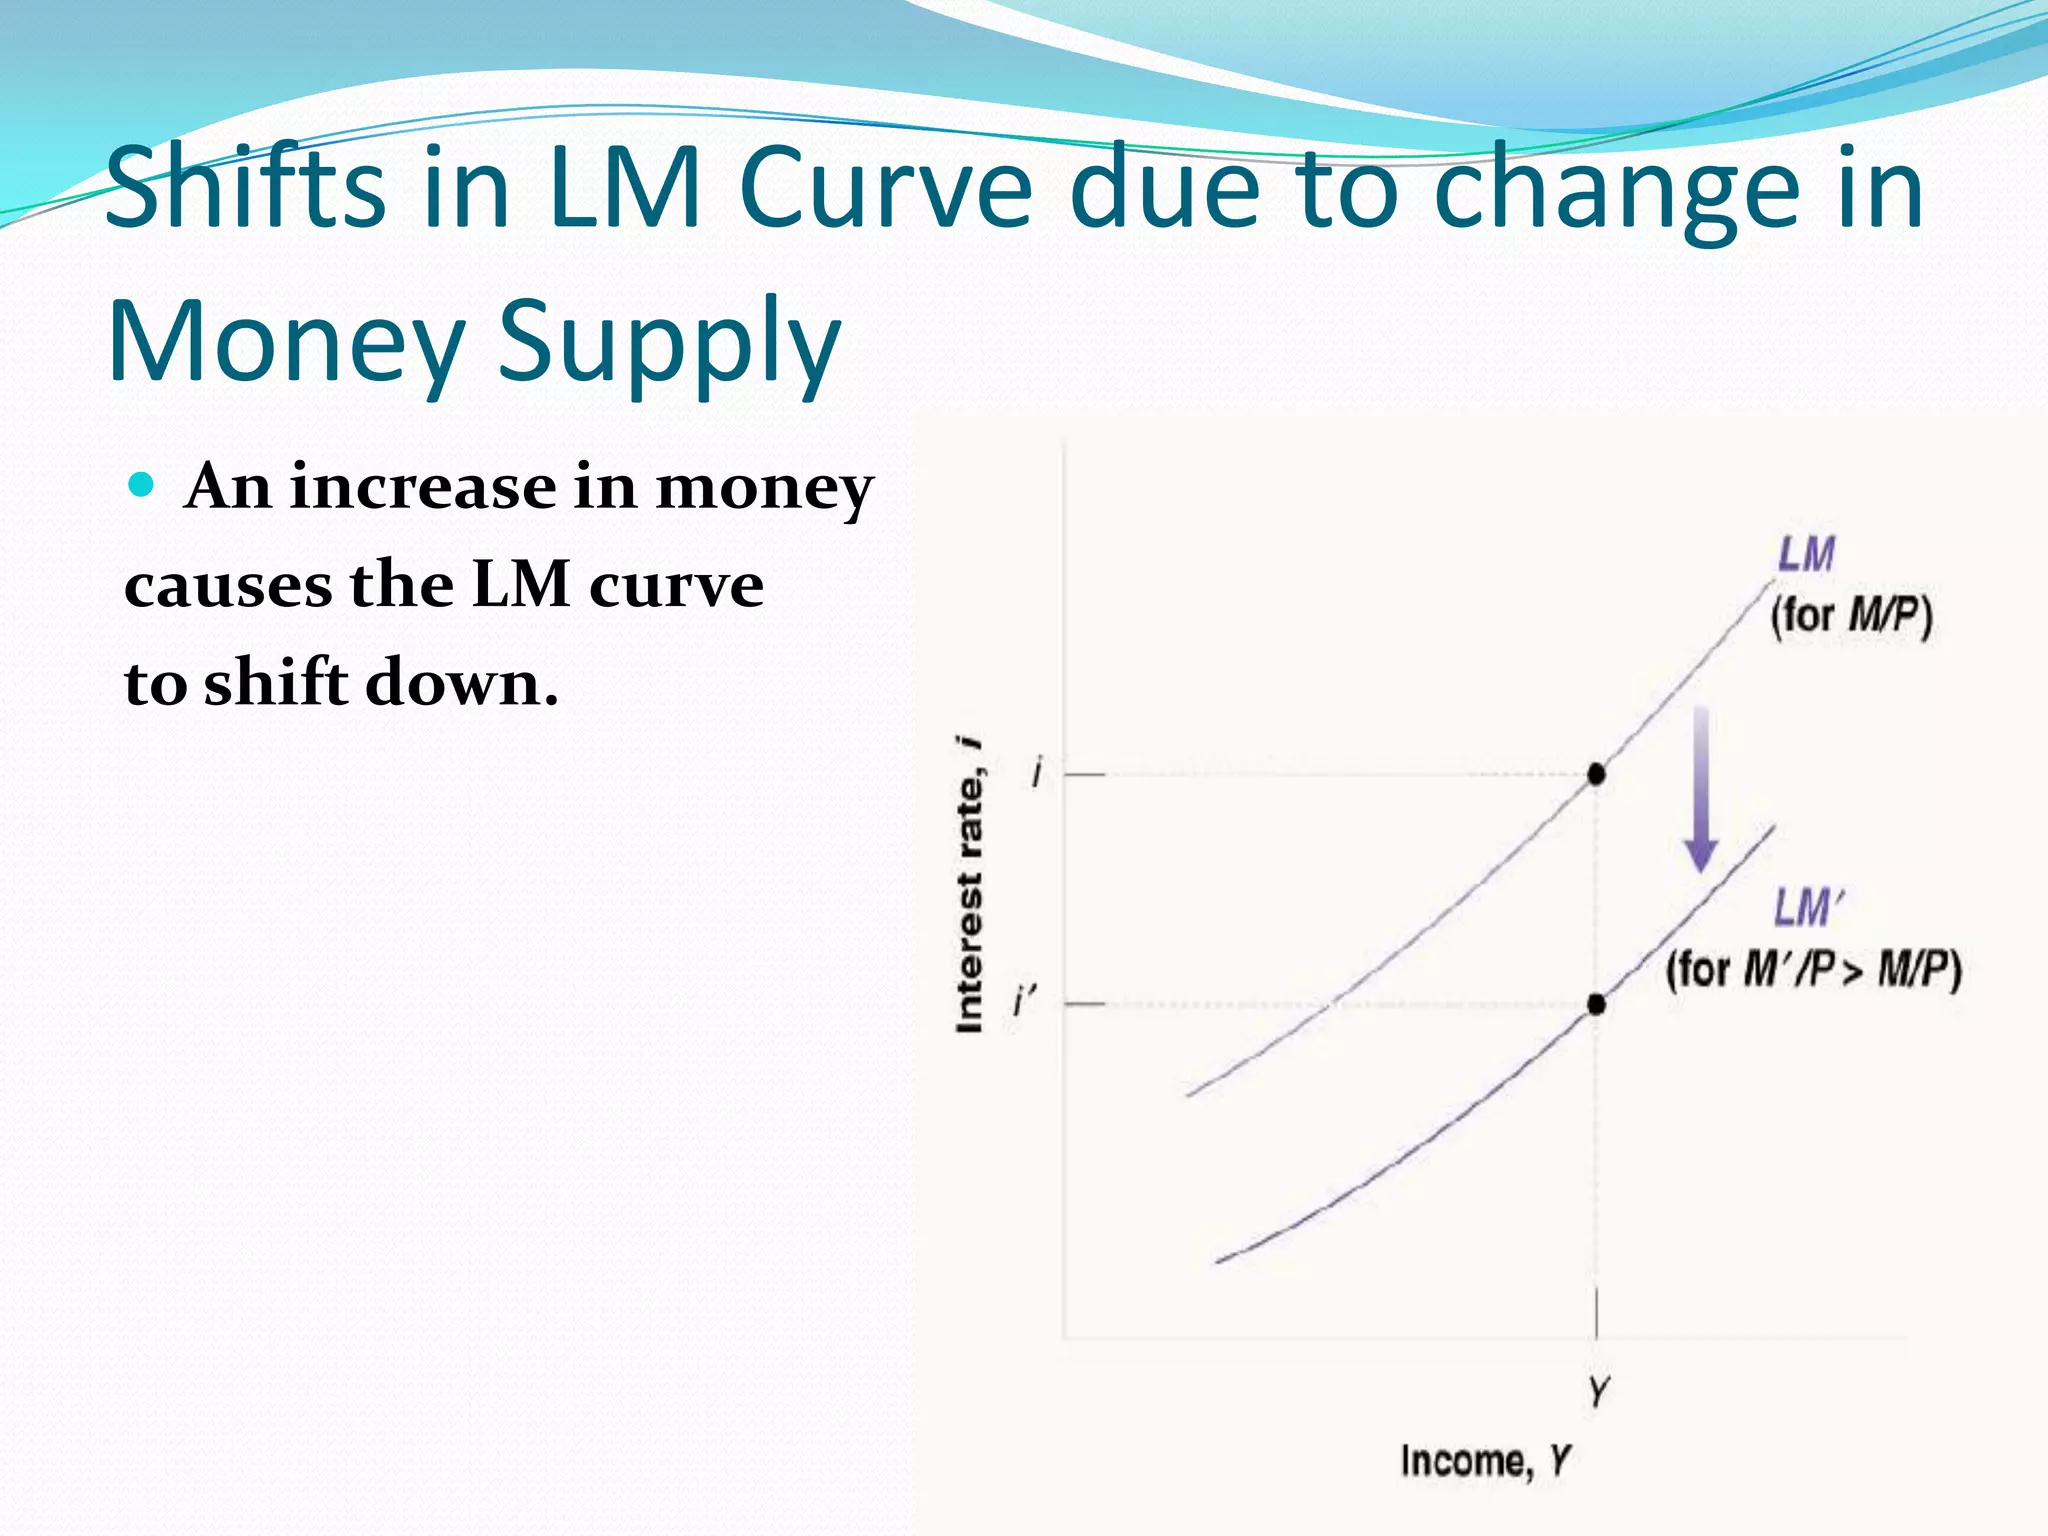
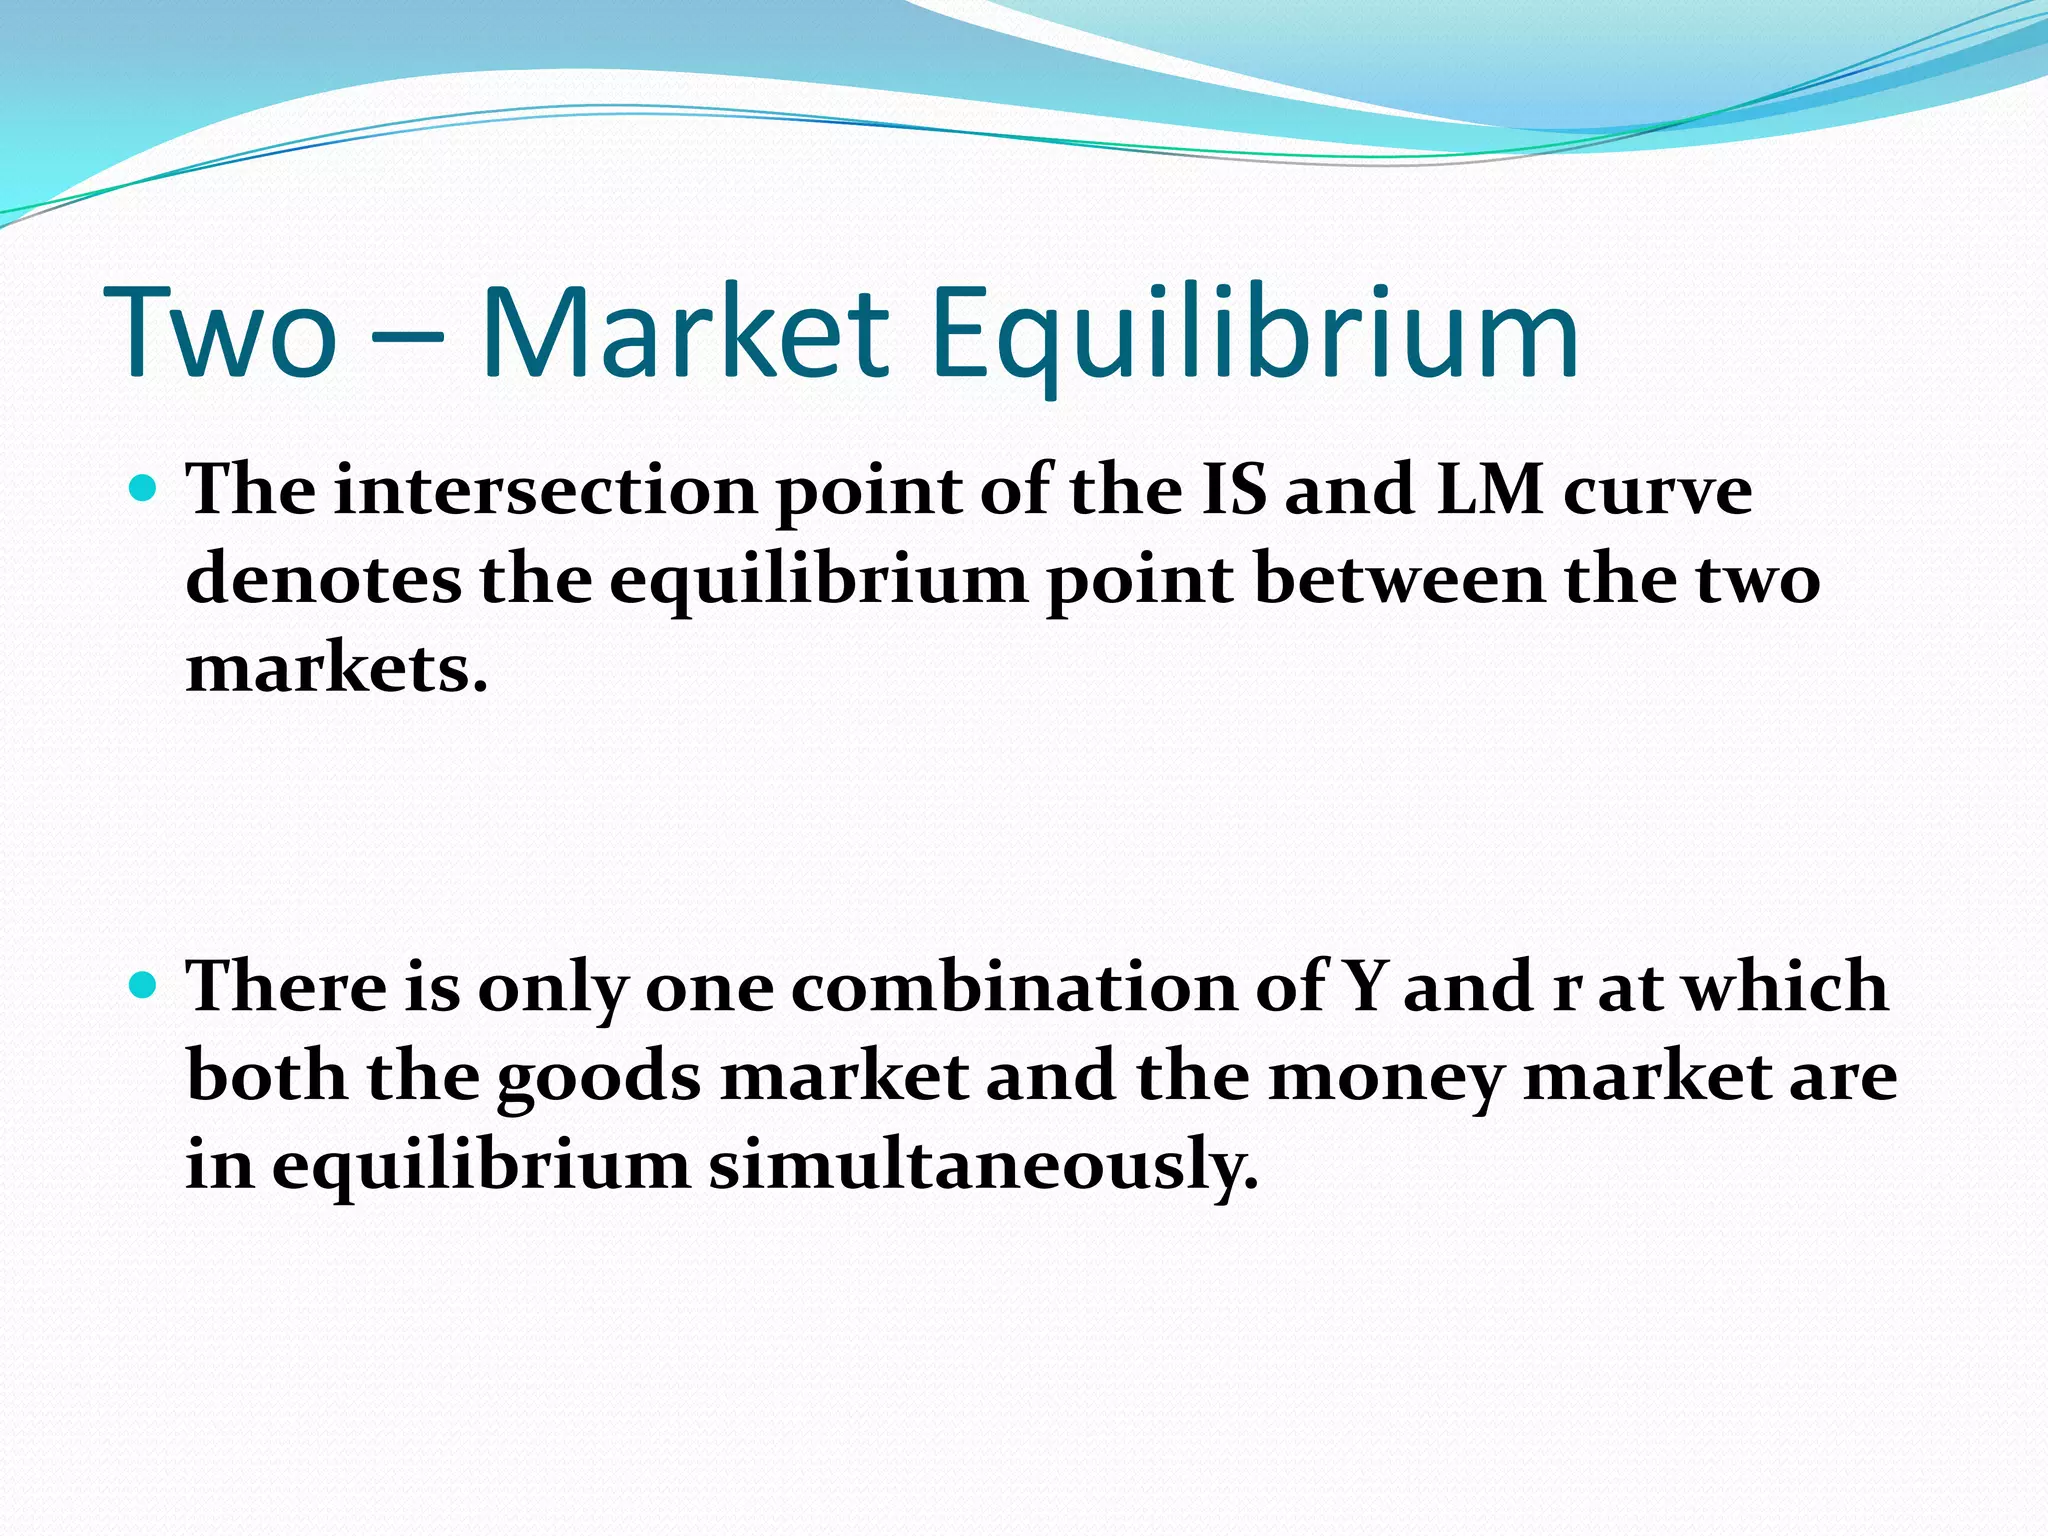
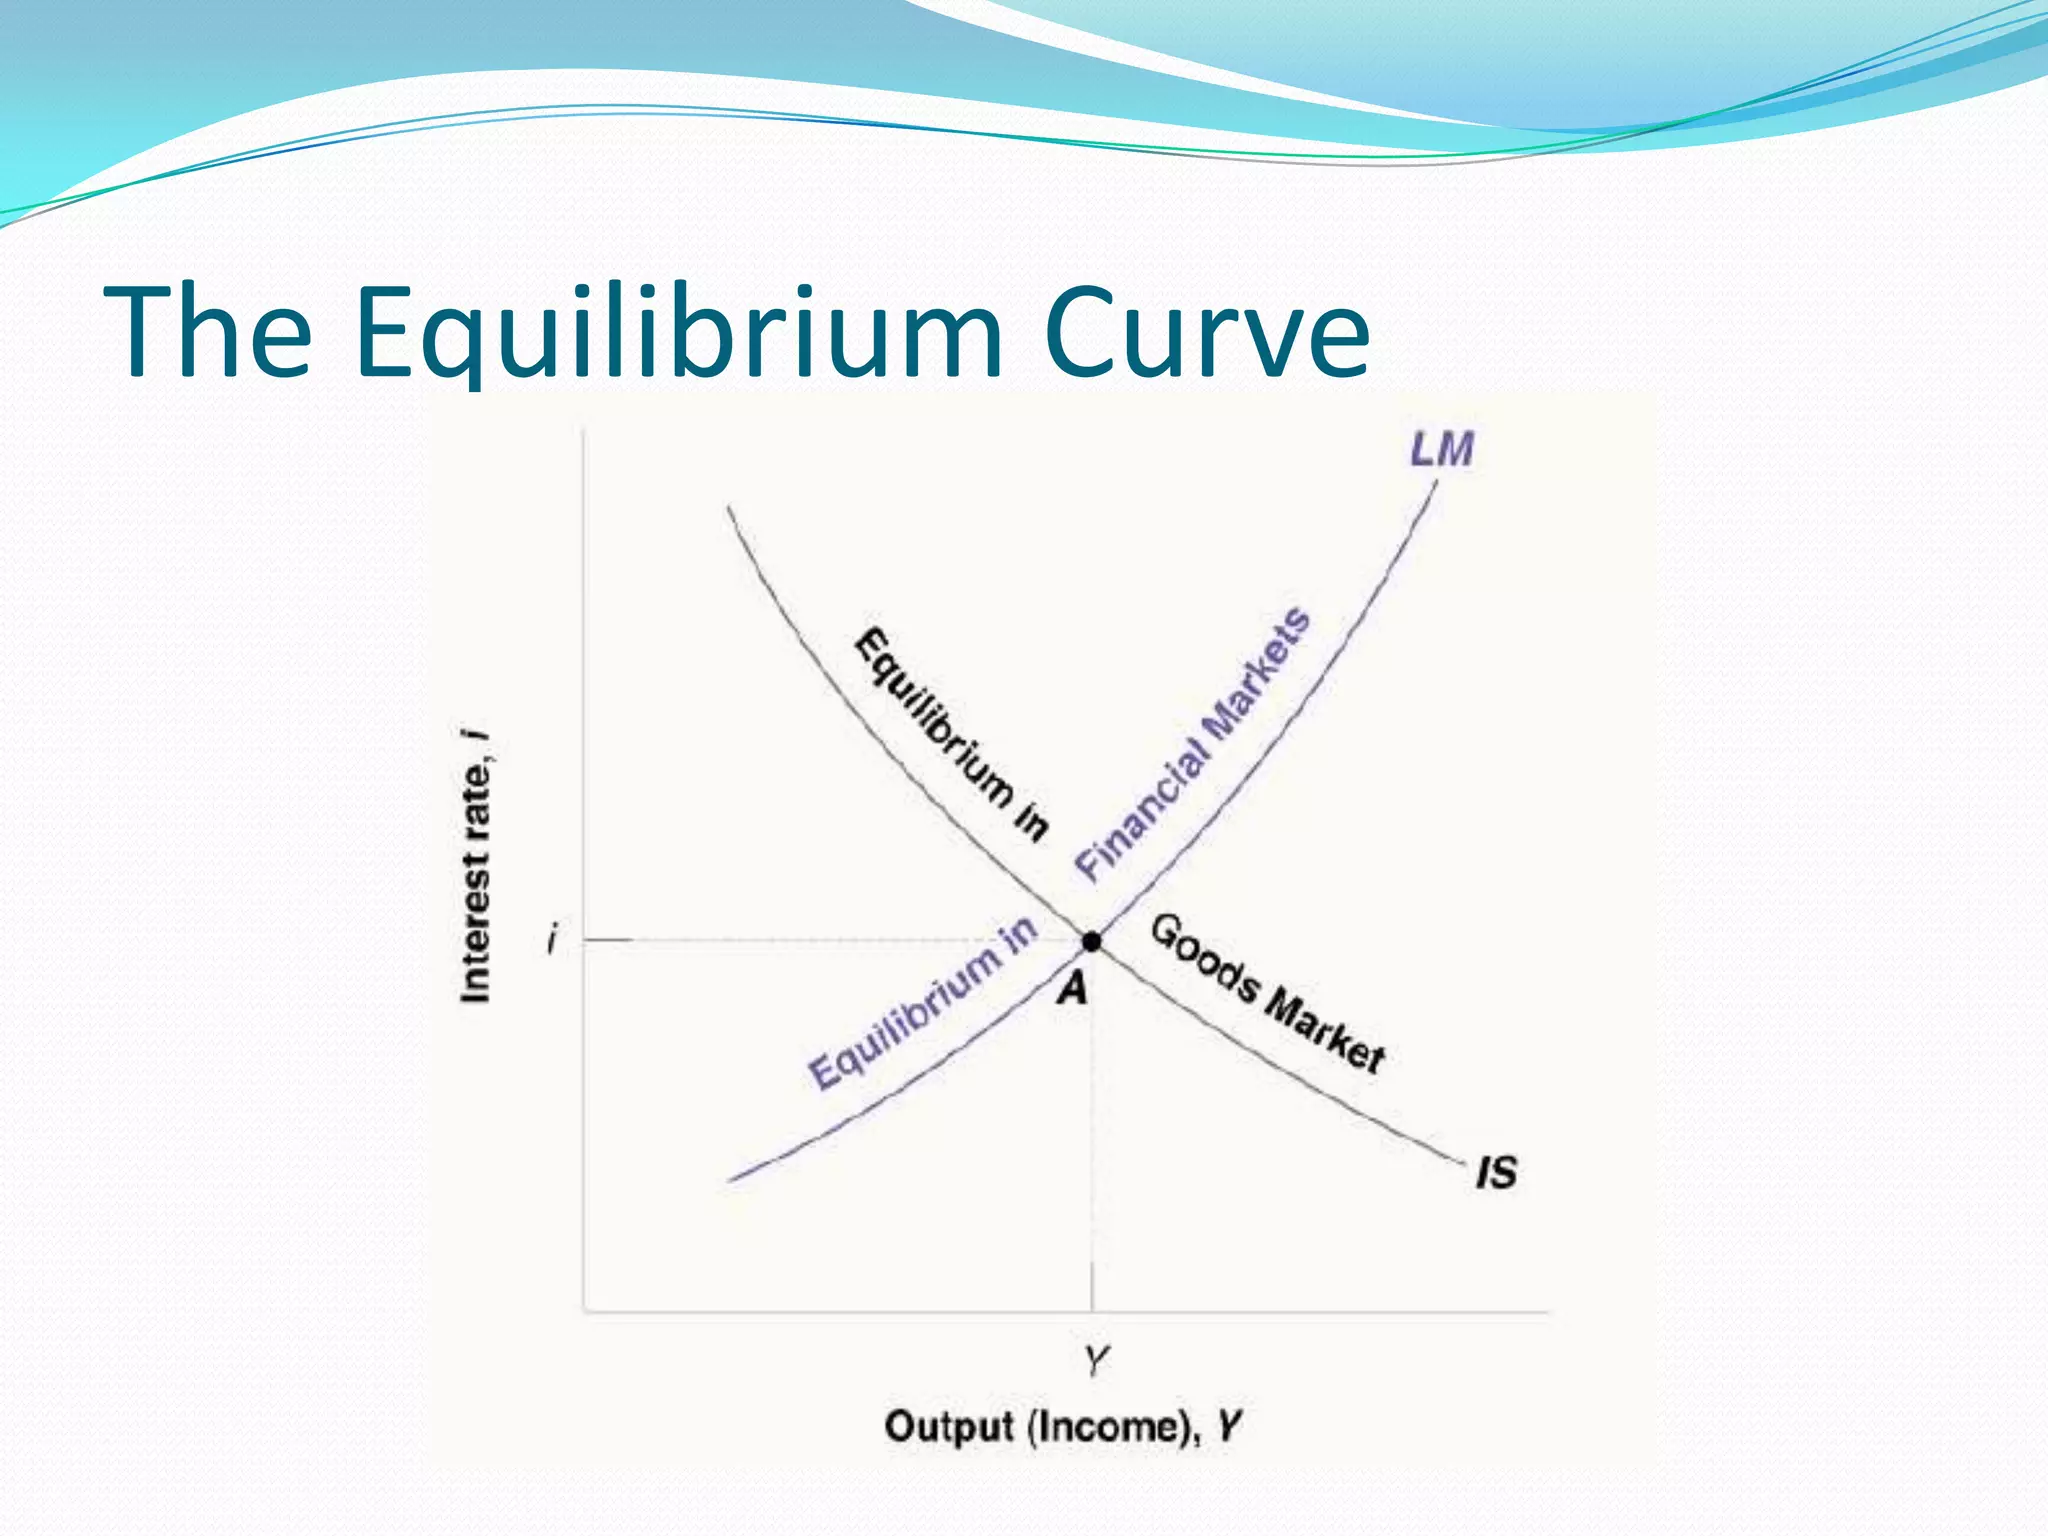
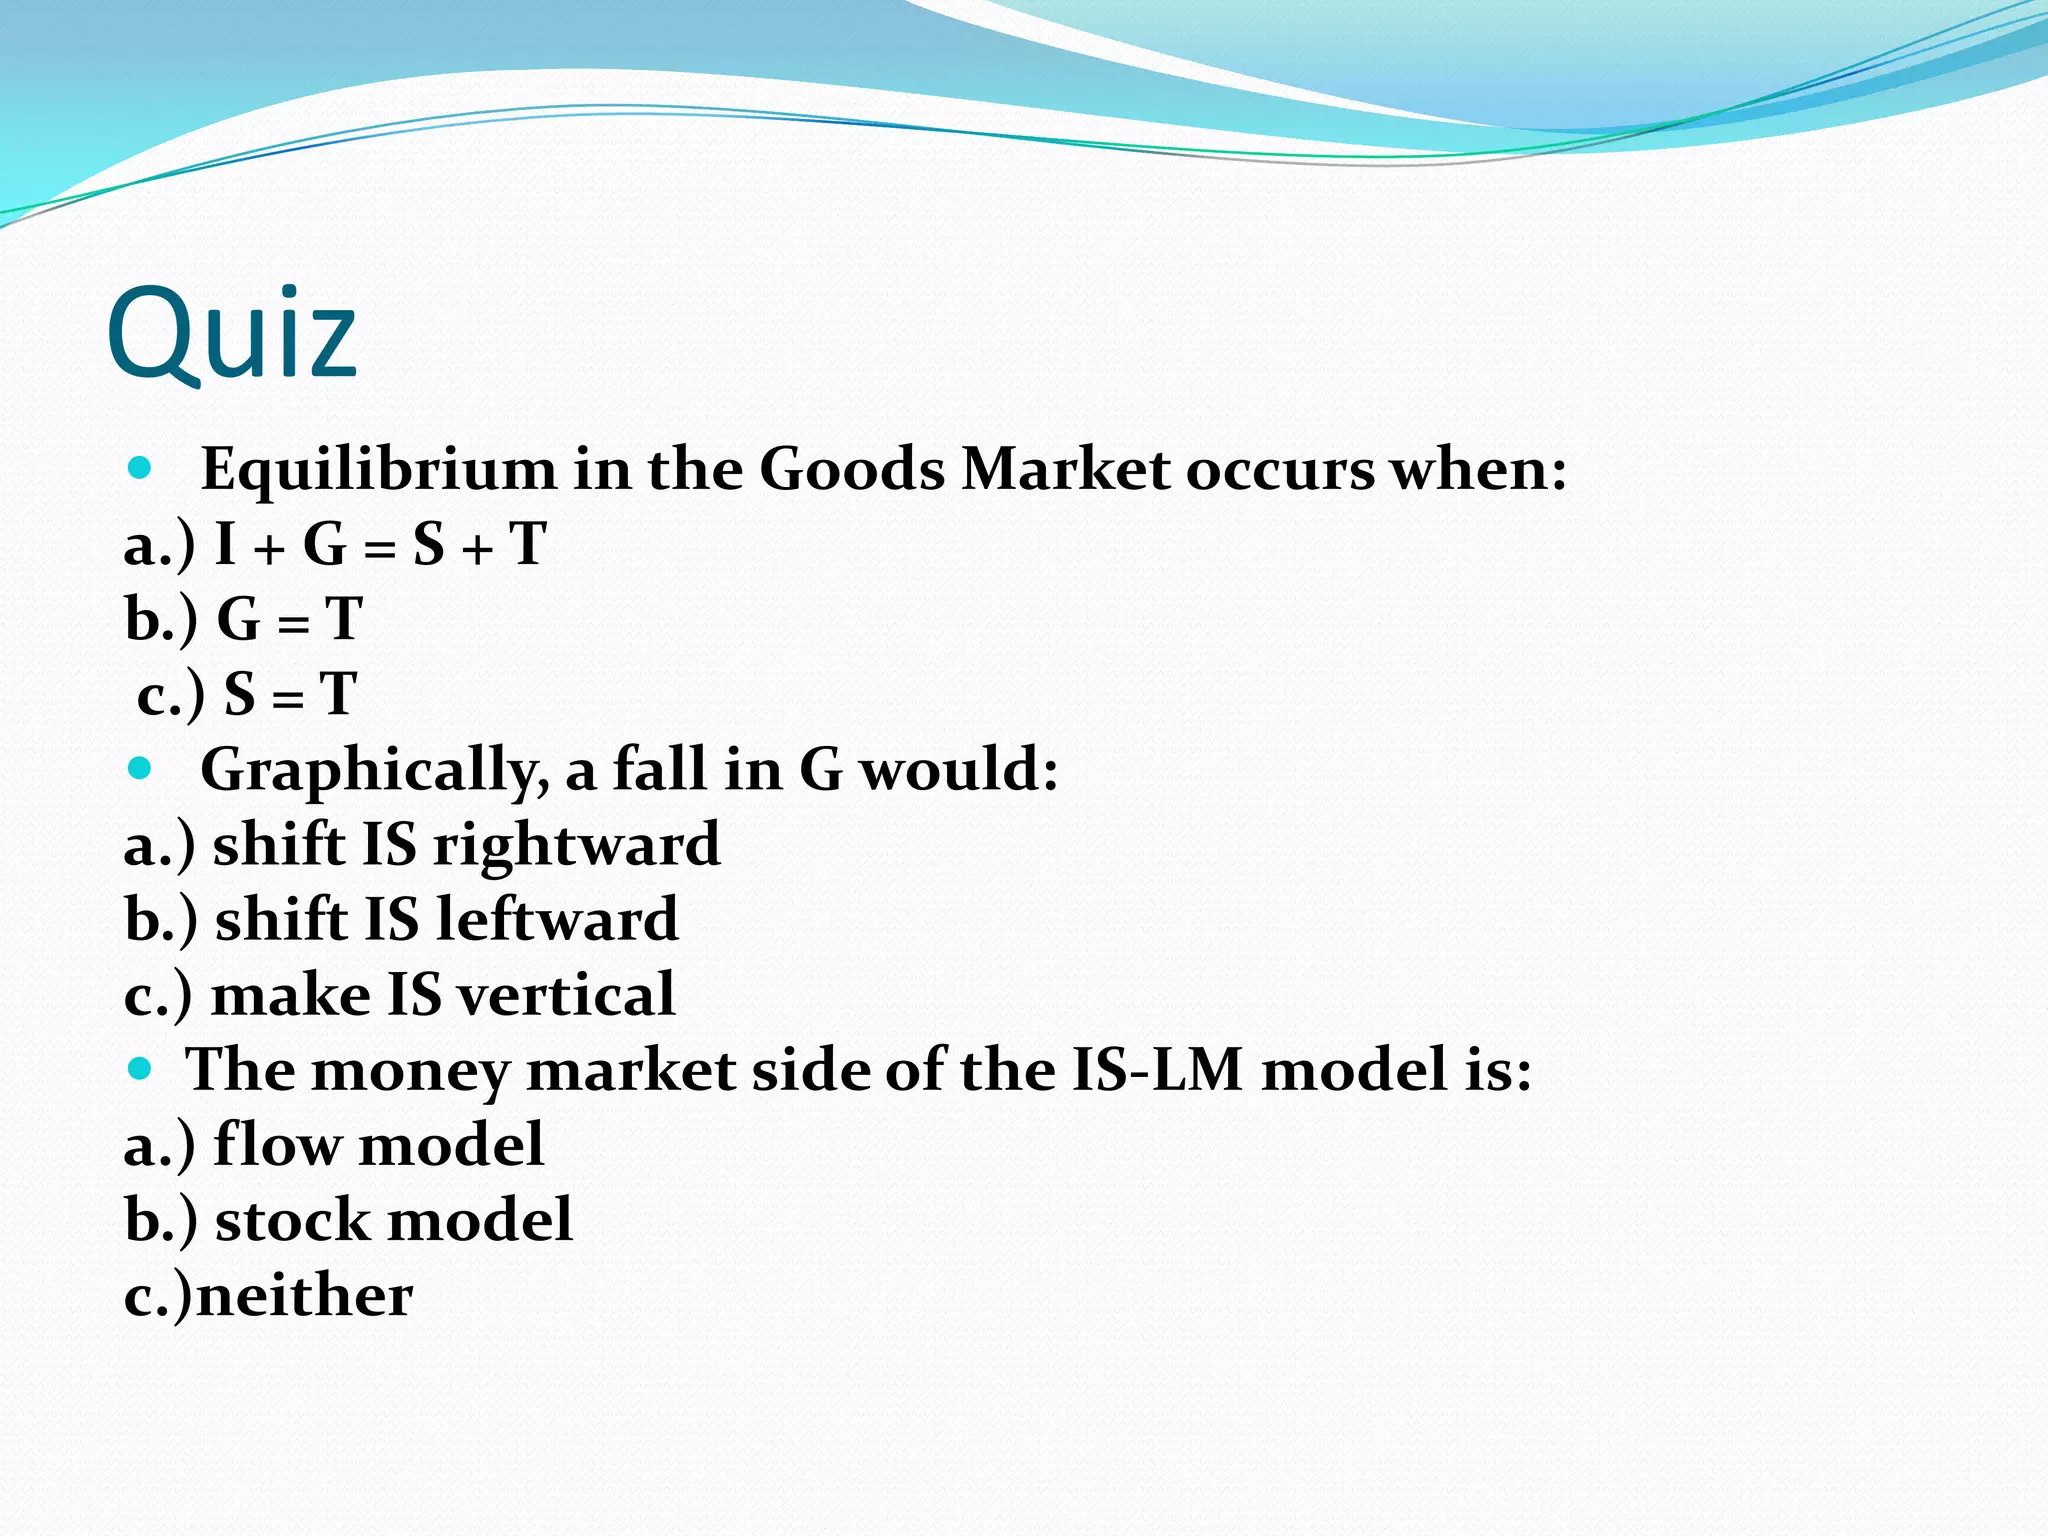
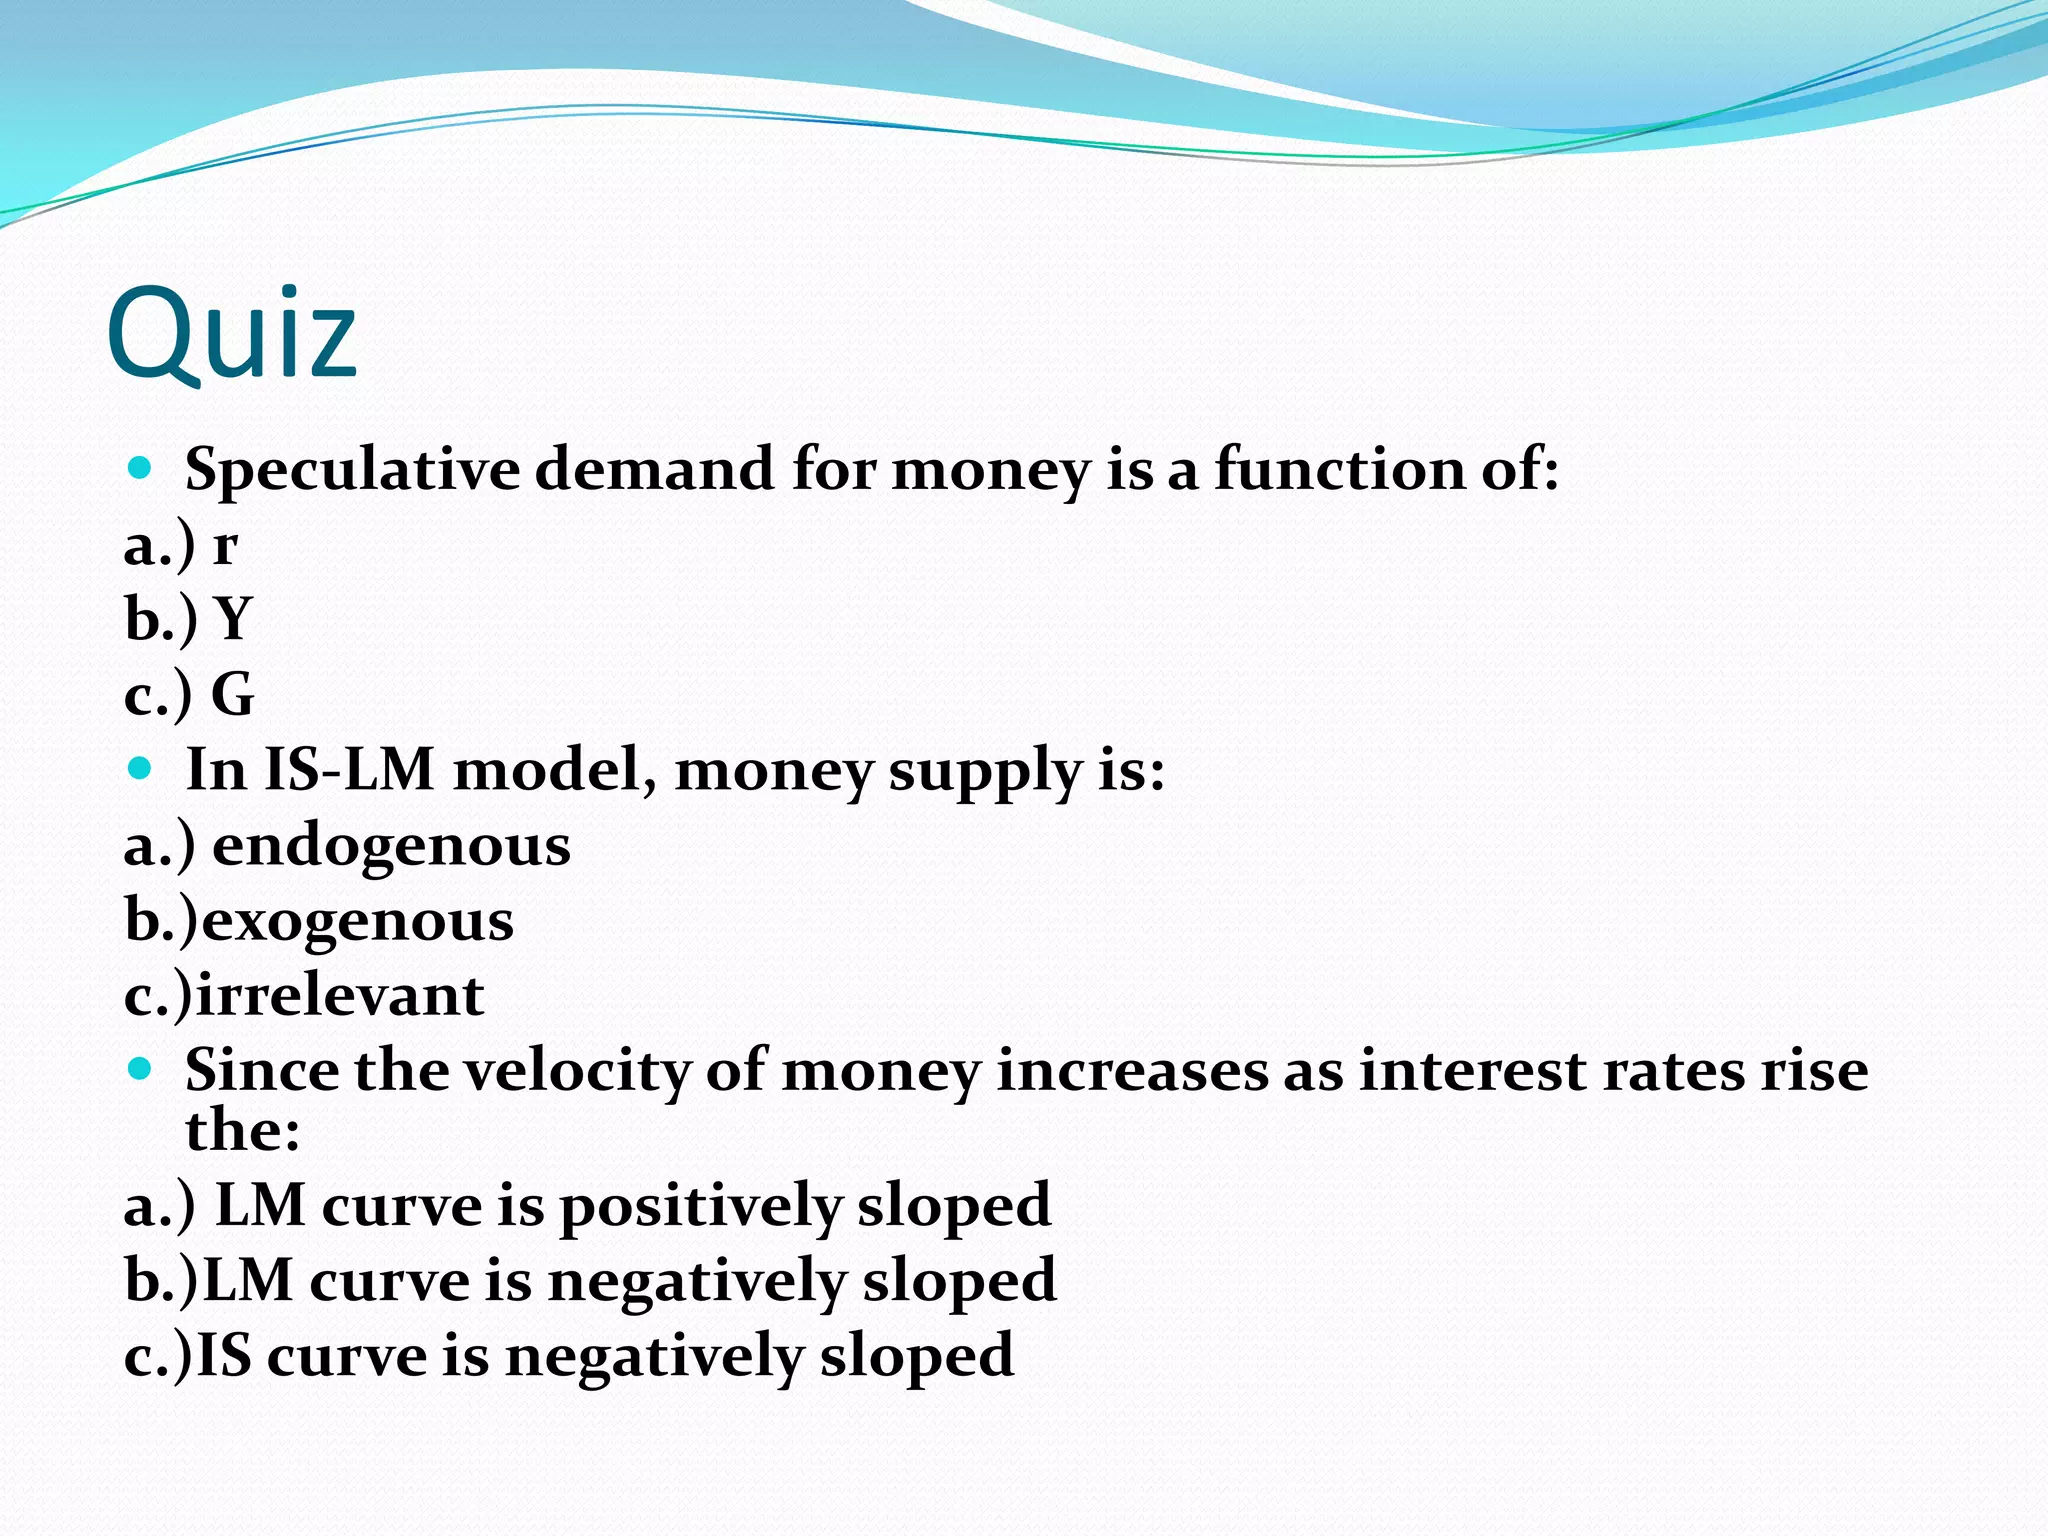
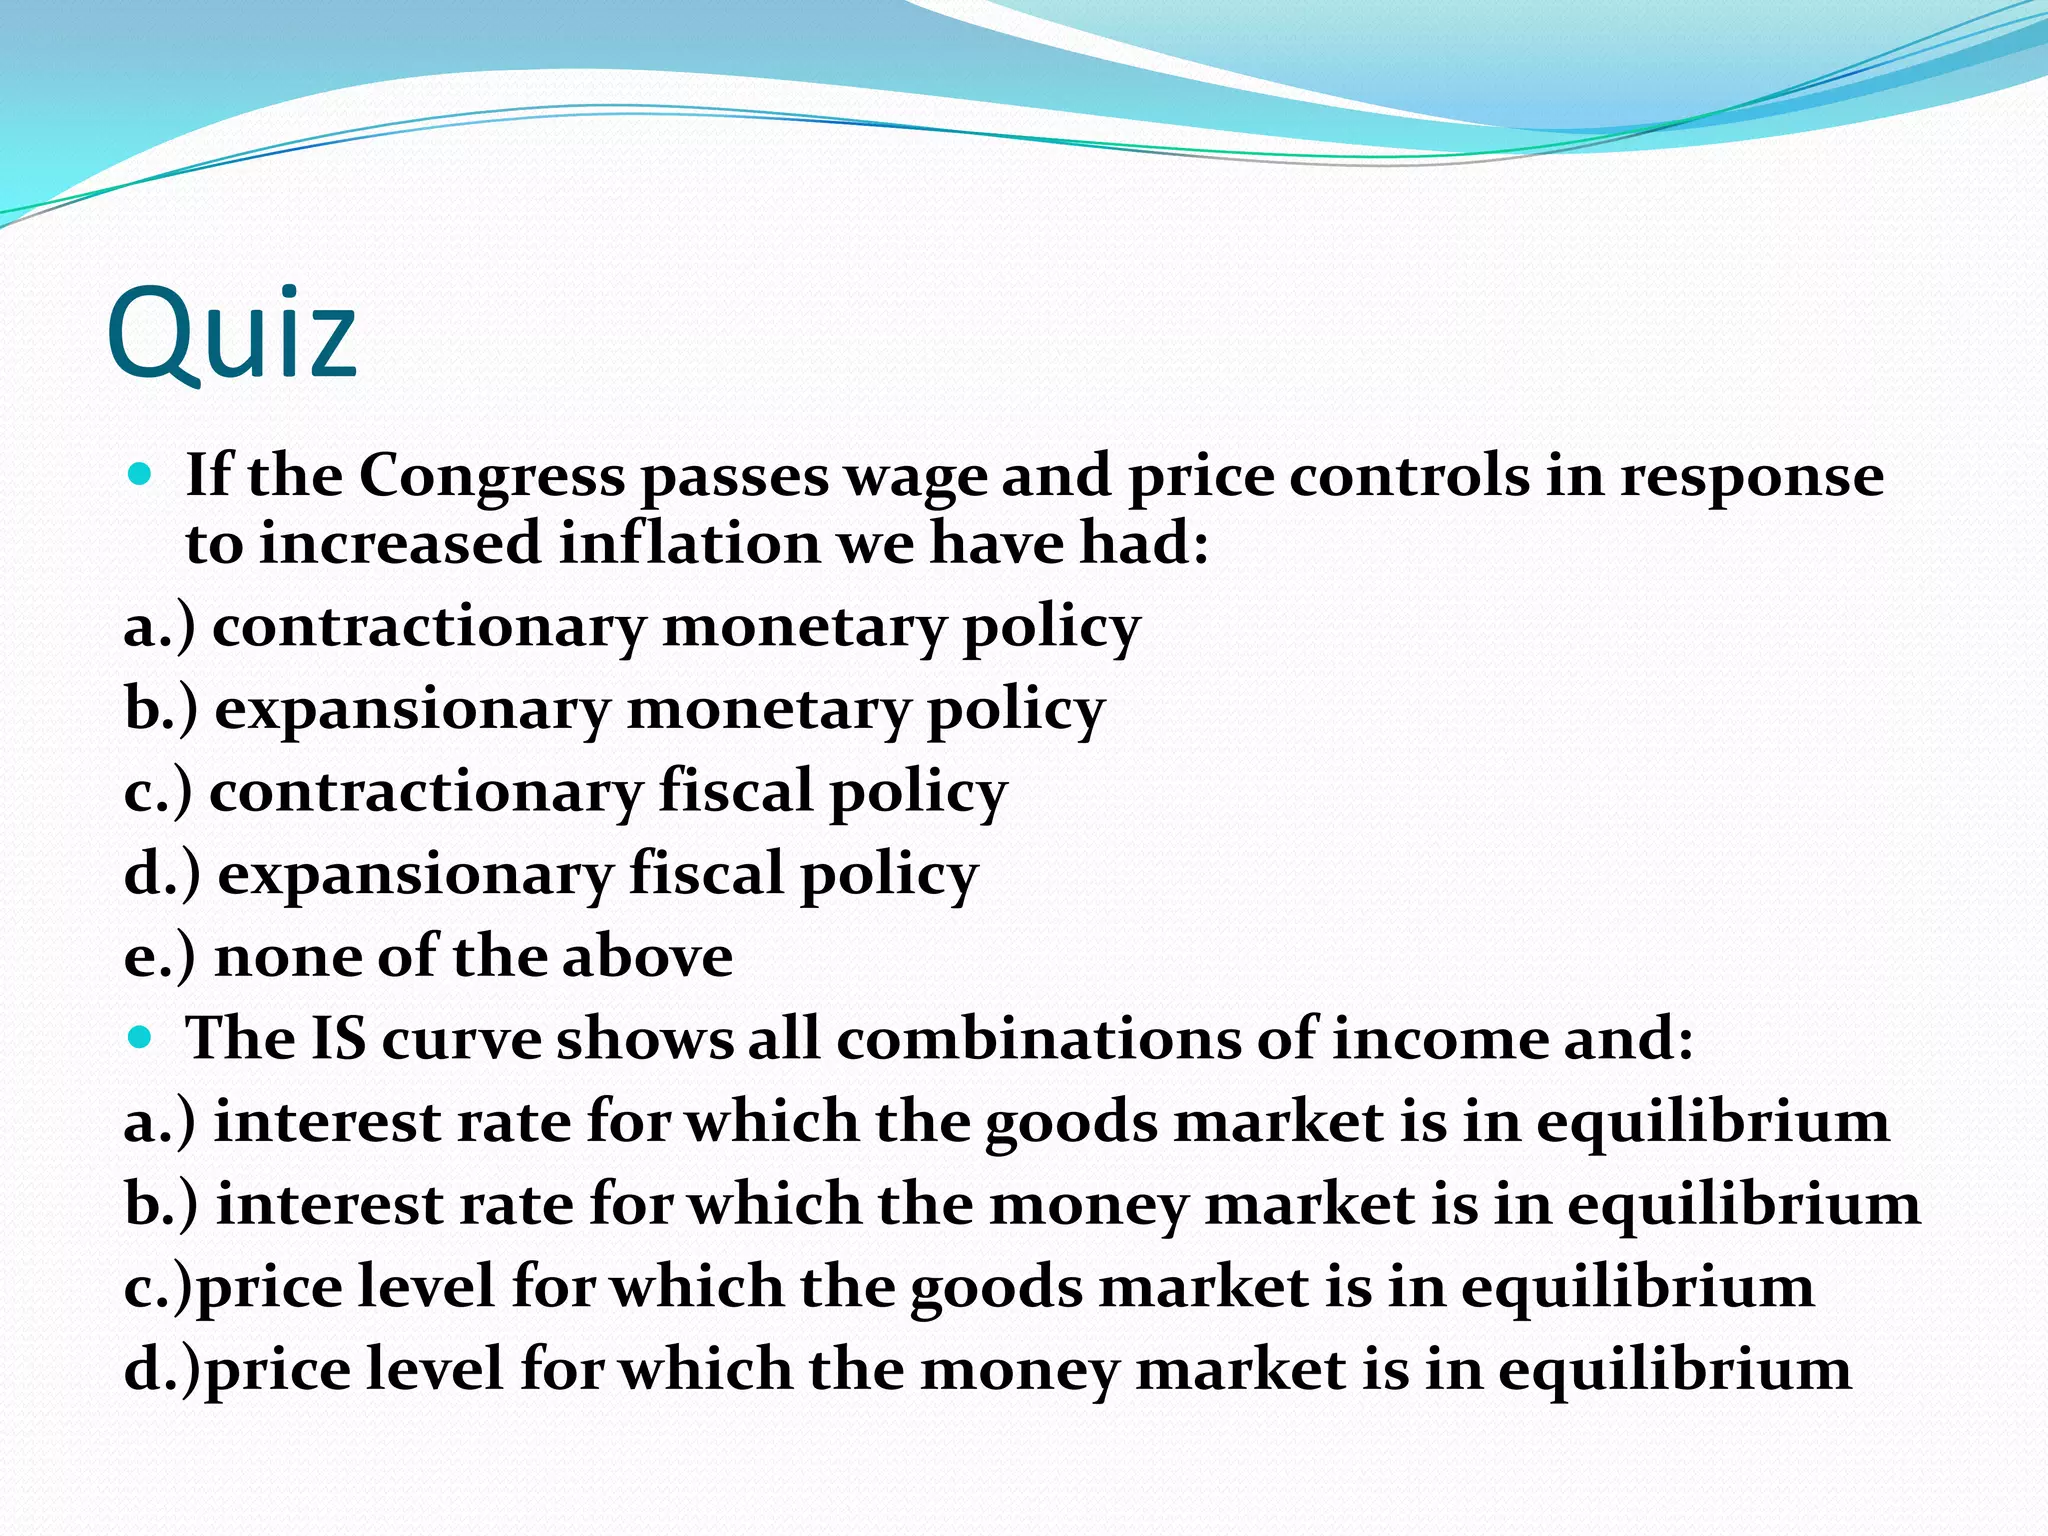
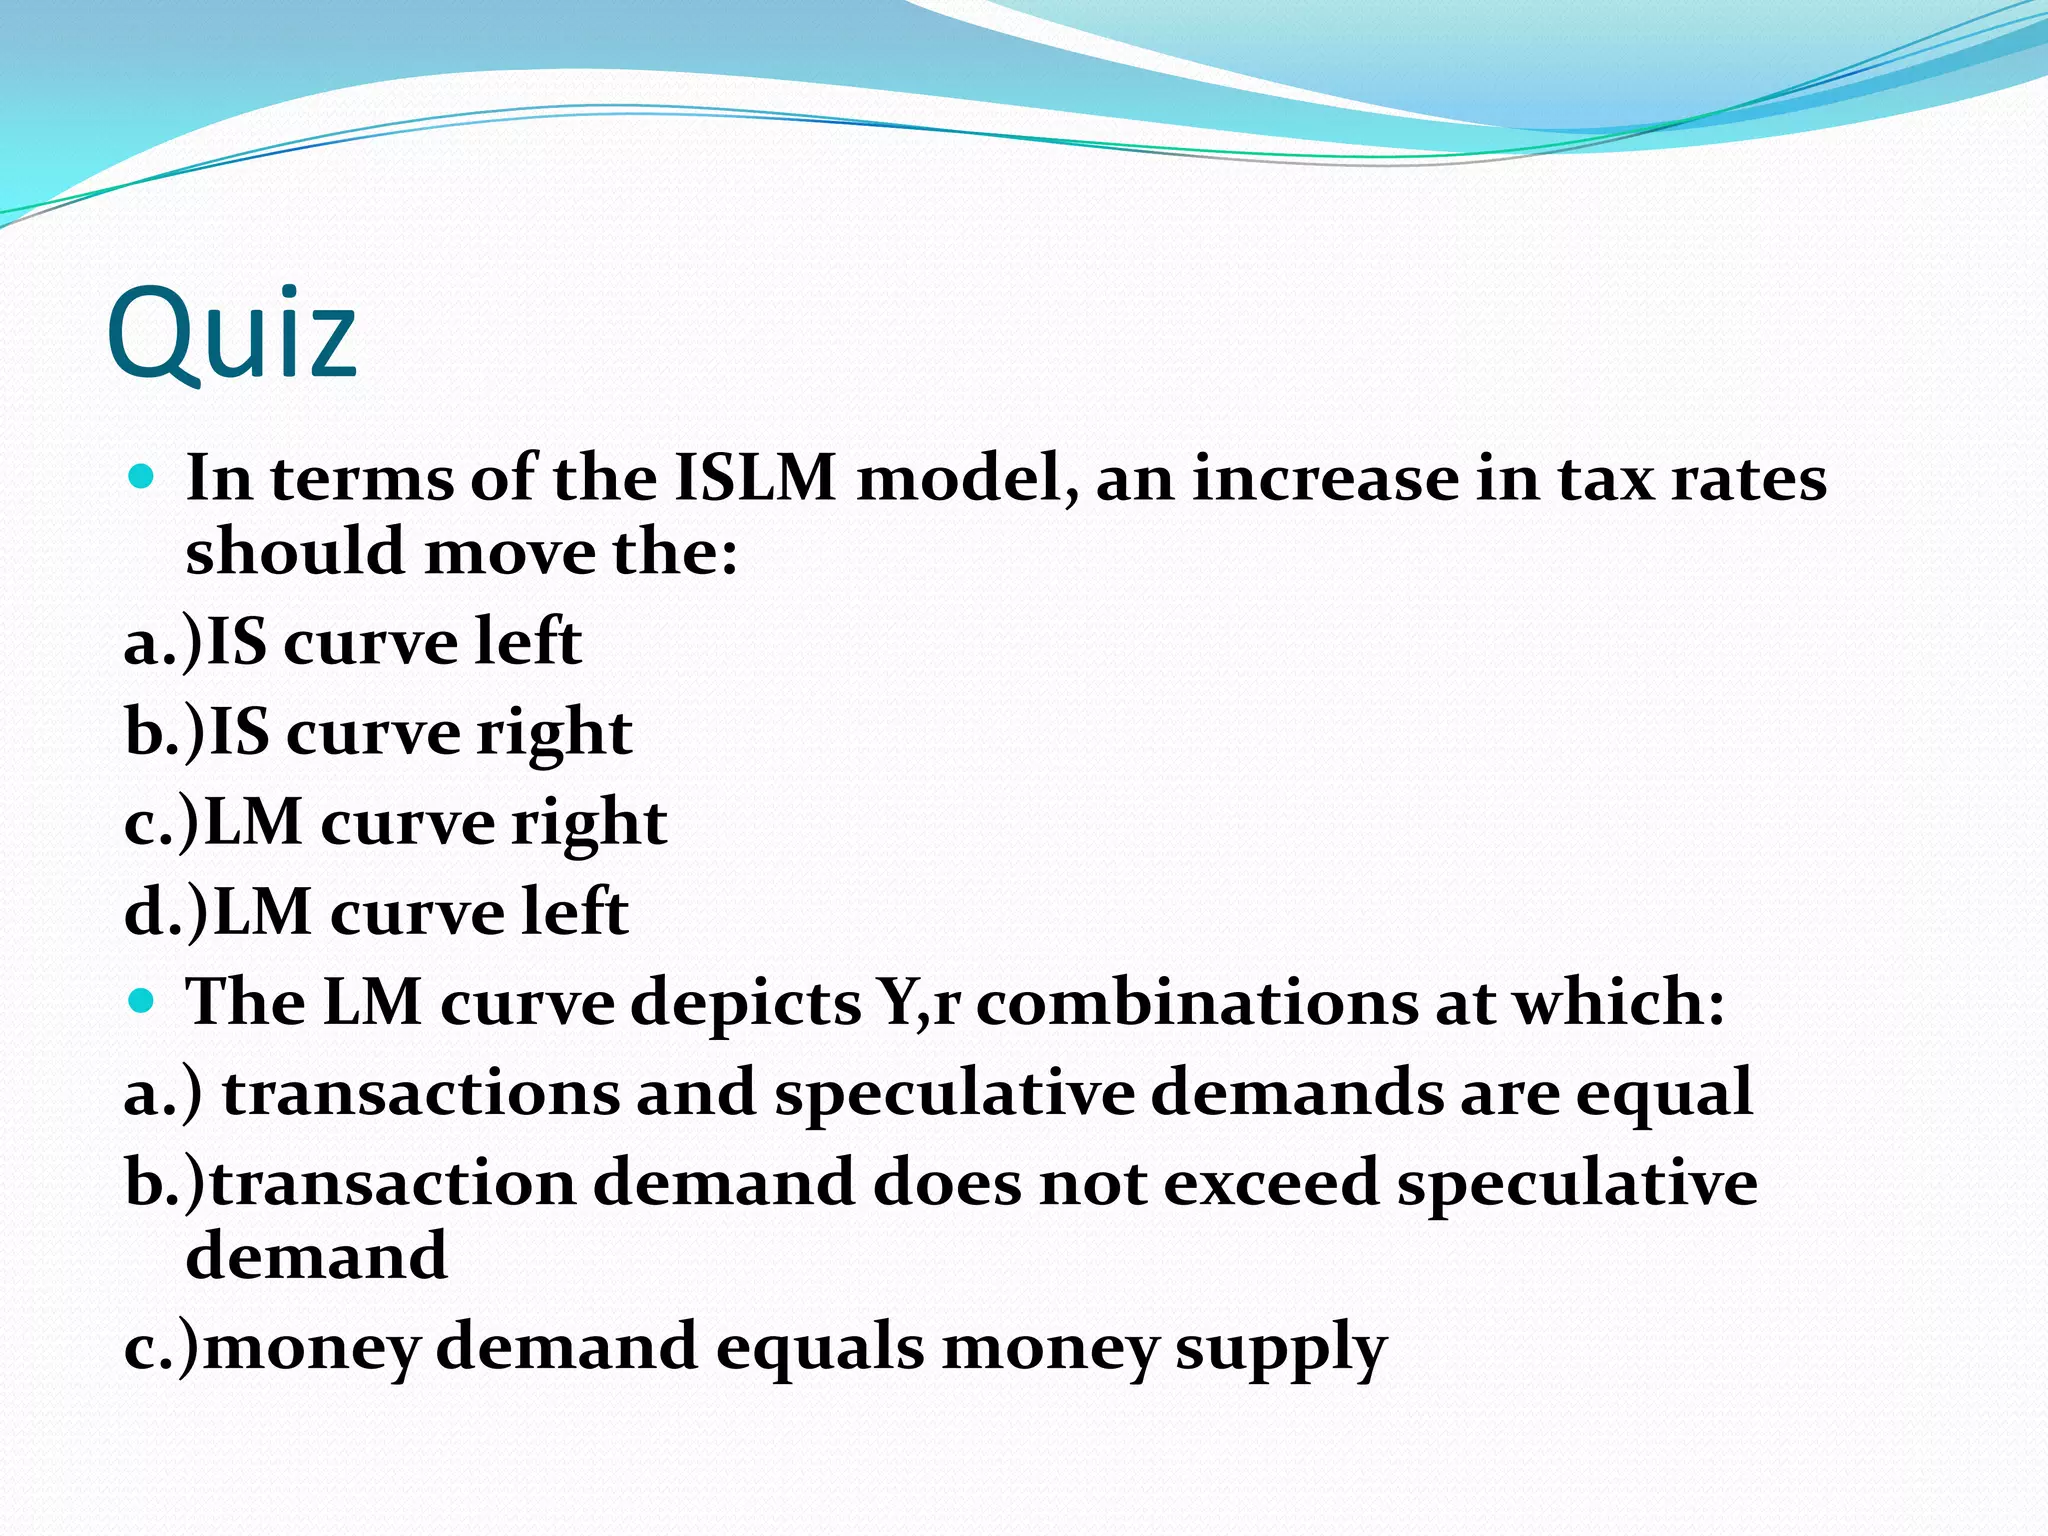
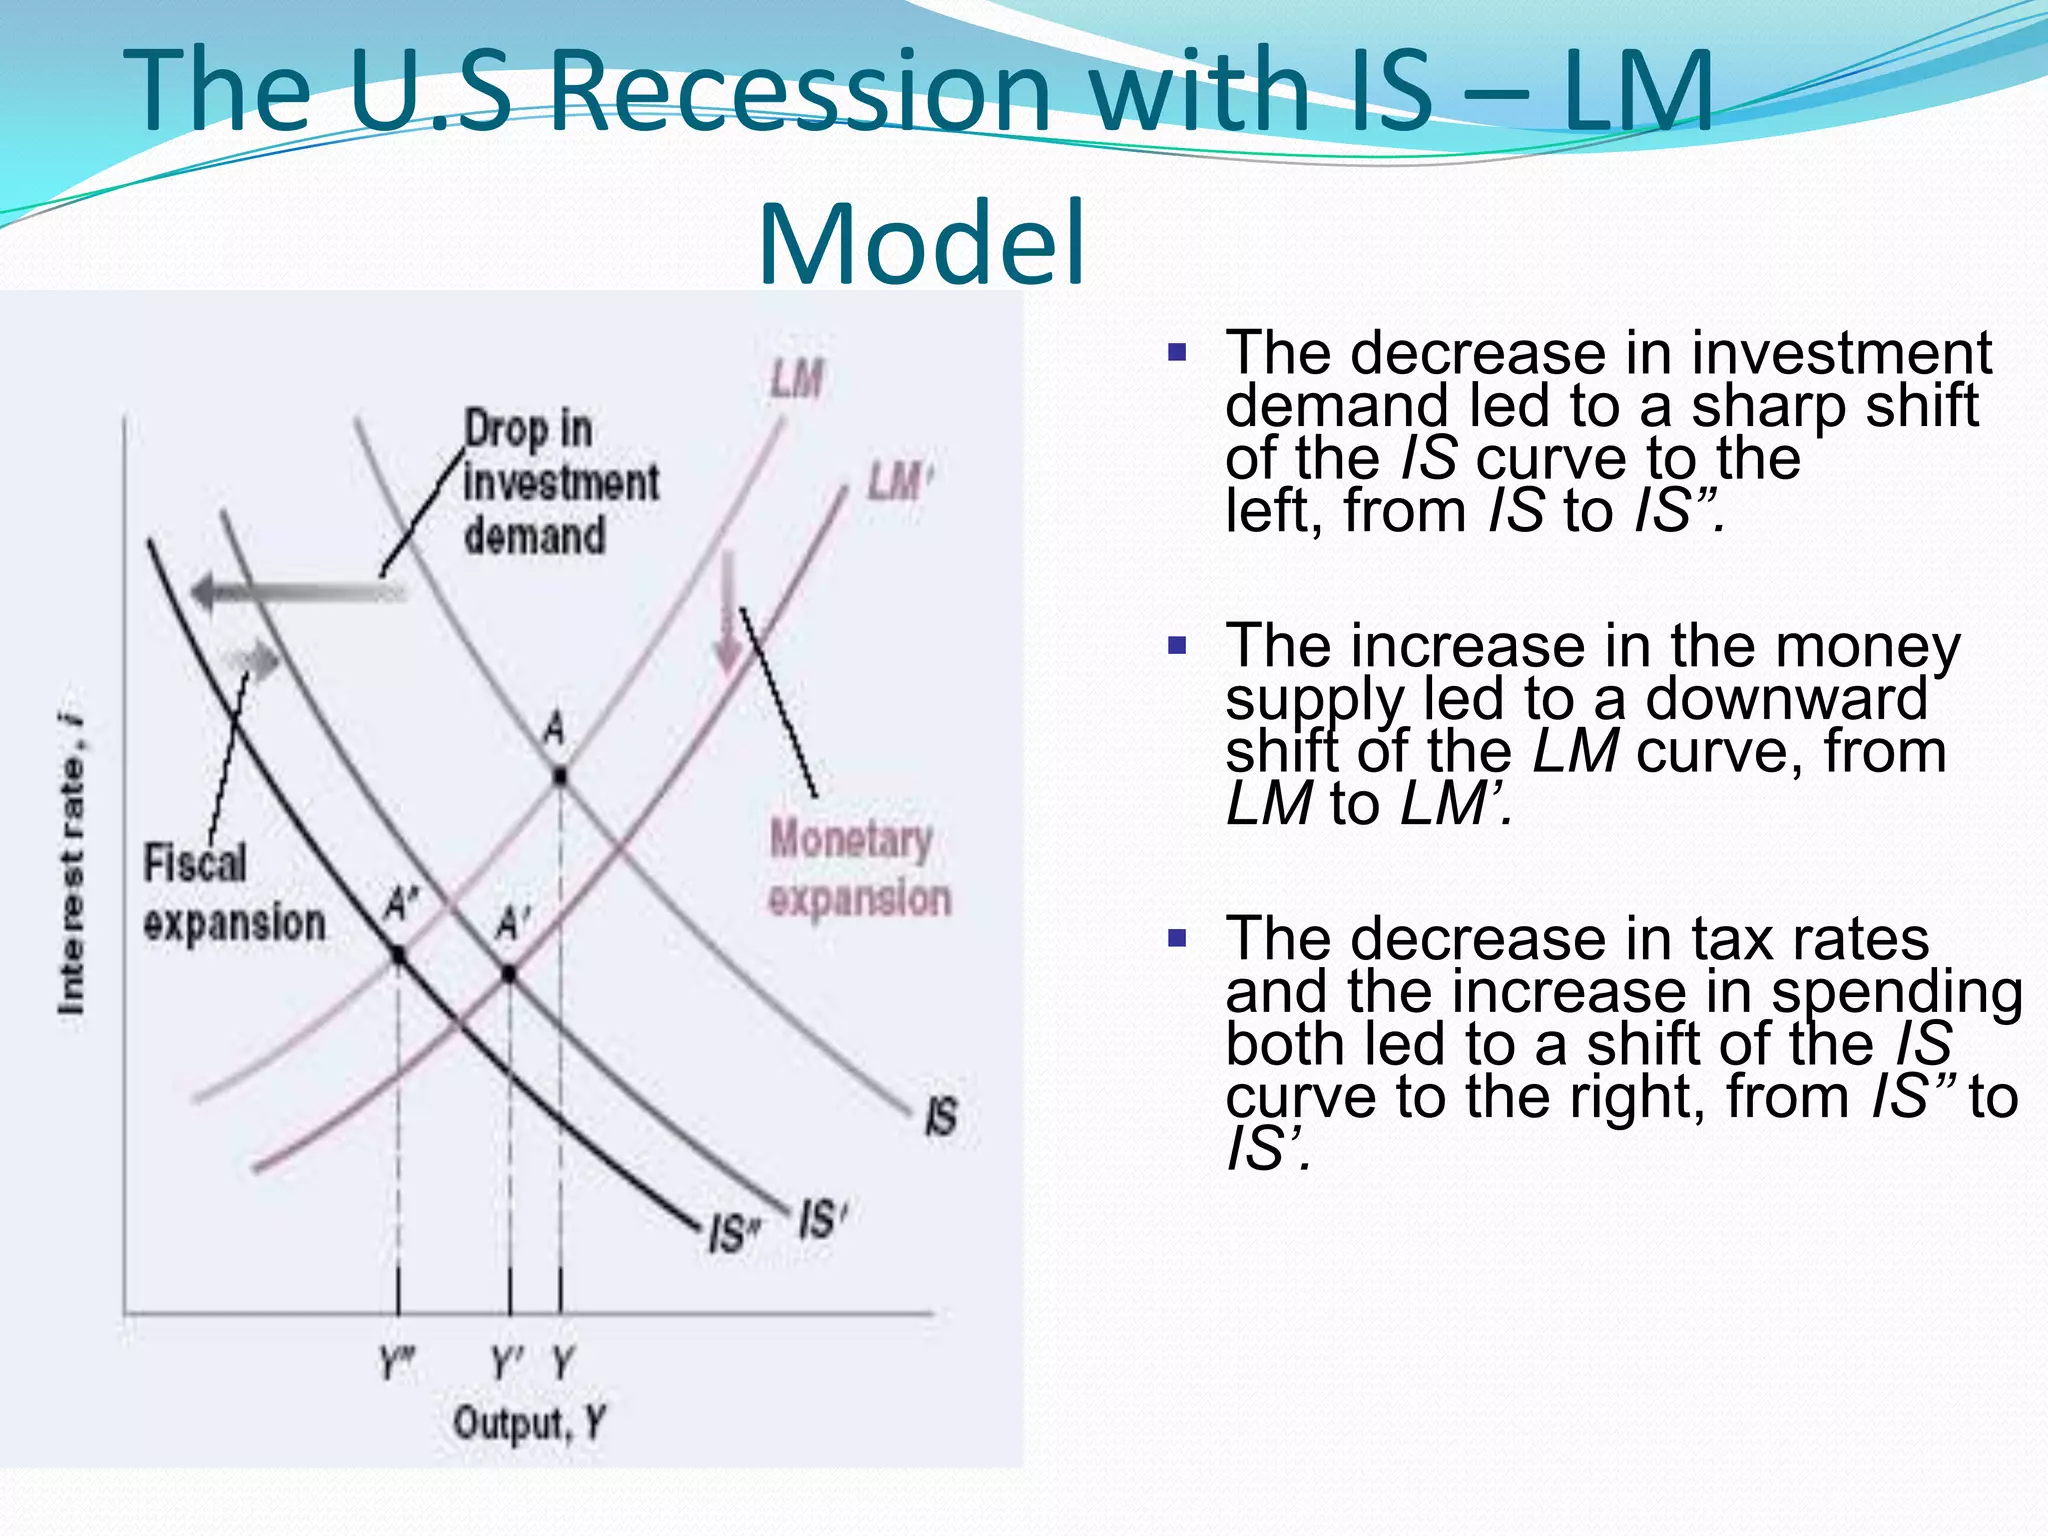
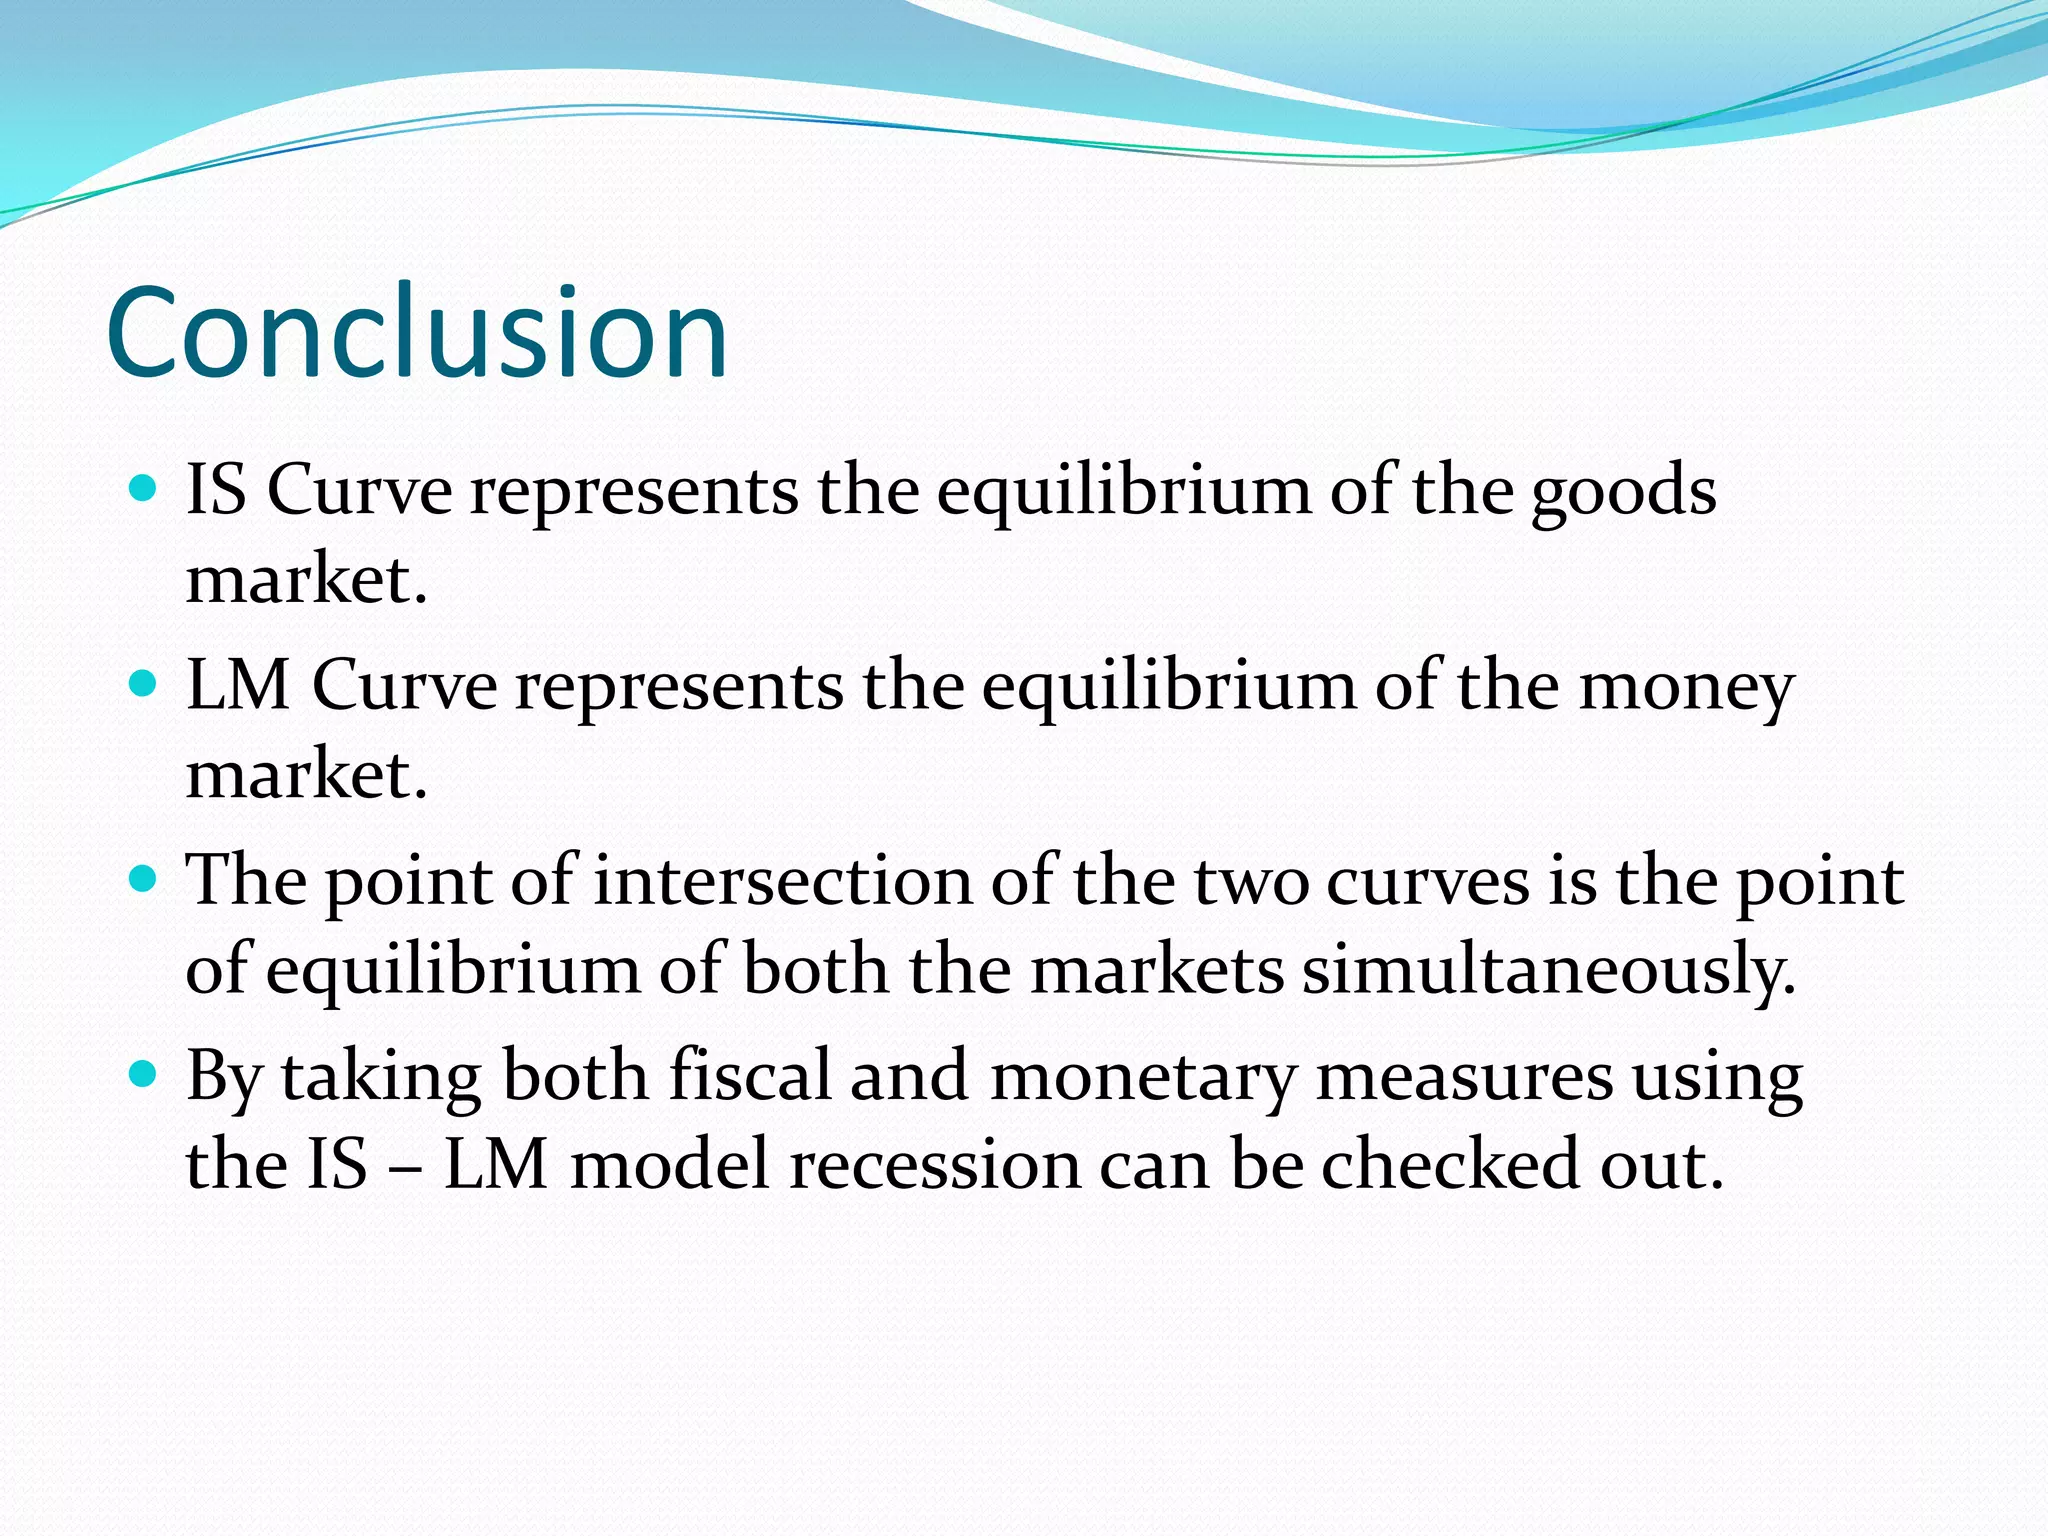
This presentation provides an overview of the goods market equilibrium and money market equilibrium using the IS-LM model. It defines the equilibrium conditions for the goods market as savings equaling investment, and for the money market as money supply equaling money demand. It derives the downward sloping IS curve and upward sloping LM curve, and explains how their intersection shows the overall equilibrium in the goods and money markets. The document then discusses how fiscal and monetary policies can shift the IS and LM curves and discusses the 2001 US recession within this framework.
In Macroeconomics Income and Employment are interchangeable terms, since in the short-run National income depends on the total volume of employment or economic activity in the country. As income and employment are synonymous the employment theory is also called income theory.
It should be clear to readers that the classical economists did not formulate any specific theory of employment as such. They only laid down certain postulates which subsequently developed as a theory.
here in Keynesian theory of income and employment is explained in deep so all those people who want to get keenly into this theory must at least have a look at the same as it can improve your knowledge.
In monetary economics, the quantity theory of money (QTM) states that the general price level of goods and services is directly proportional to the amount of money in circulation, or money supply. The theory was challenged by Keynesian economics,but updated and reinvigorated by the monetarist school of economics. While mainstream economists agree that the quantity theory holds true in the long run, there is still disagreement about its applicability in the short run. Critics of the theory argue that money velocity is not stable and, in the short-run, prices are sticky, so the direct relationship between money supply and price level does not hold.
Alternative theories include the real bills doctrine and the more recent fiscal theory of the price level.
This theory relies on the market behaviour of the consumer to know about his preferences with regard to the various combinations for the two reactions and responses of the consumer.
The economic literature ever since the dawn of modern economics has been much preoccupied with the issue of economic growth Economic growth has also been understood to establish the conditions for economic development The better-known models of economic growth such as the Lewis, Rostow Harrod Domar Solow, and Romer growth models are discussed
In Keynesian Economics equilibrium is reached at a point where Ad equals AS. On the Other hand for equilibrium Consumption must equal Investment given the fact that S = I. The rete of interest which is the major determinant of Investment is determined in Money Market. It is therefore essential that at equilibrium all these markets should be in equilibrium. IS LM explains simultaneous equilibrium in all the markets.
Through this slide I try hard to explain it in as simple as possible, so you guys easily understand what IL-SM curve is & its derivation graphically & mathematically, and I hope you guys no need to open you books after you go through with it.
The European Unemployment Puzzle: implications from population agingGRAPE
We study the link between the evolving age structure of the working population and unemployment. We build a large new Keynesian OLG model with a realistic age structure, labor market frictions, sticky prices, and aggregate shocks. Once calibrated to the European economy, we quantify the extent to which demographic changes over the last three decades have contributed to the decline of the unemployment rate. Our findings yield important implications for the future evolution of unemployment given the anticipated further aging of the working population in Europe. We also quantify the implications for optimal monetary policy: lowering inflation volatility becomes less costly in terms of GDP and unemployment volatility, which hints that optimal monetary policy may be more hawkish in an aging society. Finally, our results also propose a partial reversal of the European-US unemployment puzzle due to the fact that the share of young workers is expected to remain robust in the US.
how to sell pi coins effectively (from 50 - 100k pi)DOT TECH
Anywhere in the world, including Africa, America, and Europe, you can sell Pi Network Coins online and receive cash through online payment options.
Pi has not yet been launched on any exchange because we are currently using the confined Mainnet. The planned launch date for Pi is June 28, 2026.
Reselling to investors who want to hold until the mainnet launch in 2026 is currently the sole way to sell.
Consequently, right now. All you need to do is select the right pi network provider.
Who is a pi merchant?
An individual who buys coins from miners on the pi network and resells them to investors hoping to hang onto them until the mainnet is launched is known as a pi merchant.
debuts.
I'll provide you the Telegram username
@Pi_vendor_247
how to sell pi coins at high rate quickly.DOT TECH
Where can I sell my pi coins at a high rate.
Pi is not launched yet on any exchange. But one can easily sell his or her pi coins to investors who want to hold pi till mainnet launch.
This means crypto whales want to hold pi. And you can get a good rate for selling pi to them. I will leave the telegram contact of my personal pi vendor below.
A vendor is someone who buys from a miner and resell it to a holder or crypto whale.
Here is the telegram contact of my vendor:
@Pi_vendor_247
how can I sell my pi coins for cash in a pi APPDOT TECH
You can't sell your pi coins in the pi network app. because it is not listed yet on any exchange.
The only way you can sell is by trading your pi coins with an investor (a person looking forward to hold massive amounts of pi coins before mainnet launch) .
You don't need to meet the investor directly all the trades are done with a pi vendor/merchant (a person that buys the pi coins from miners and resell it to investors)
I Will leave The telegram contact of my personal pi vendor, if you are finding a legitimate one.
@Pi_vendor_247
#pi network
#pi coins
#money
US Economic Outlook - Being Decided - M Capital Group August 2021.pdfpchutichetpong
The U.S. economy is continuing its impressive recovery from the COVID-19 pandemic and not slowing down despite re-occurring bumps. The U.S. savings rate reached its highest ever recorded level at 34% in April 2020 and Americans seem ready to spend. The sectors that had been hurt the most by the pandemic specifically reduced consumer spending, like retail, leisure, hospitality, and travel, are now experiencing massive growth in revenue and job openings.
Could this growth lead to a “Roaring Twenties”? As quickly as the U.S. economy contracted, experiencing a 9.1% drop in economic output relative to the business cycle in Q2 2020, the largest in recorded history, it has rebounded beyond expectations. This surprising growth seems to be fueled by the U.S. government’s aggressive fiscal and monetary policies, and an increase in consumer spending as mobility restrictions are lifted. Unemployment rates between June 2020 and June 2021 decreased by 5.2%, while the demand for labor is increasing, coupled with increasing wages to incentivize Americans to rejoin the labor force. Schools and businesses are expected to fully reopen soon. In parallel, vaccination rates across the country and the world continue to rise, with full vaccination rates of 50% and 14.8% respectively.
However, it is not completely smooth sailing from here. According to M Capital Group, the main risks that threaten the continued growth of the U.S. economy are inflation, unsettled trade relations, and another wave of Covid-19 mutations that could shut down the world again. Have we learned from the past year of COVID-19 and adapted our economy accordingly?
“In order for the U.S. economy to continue growing, whether there is another wave or not, the U.S. needs to focus on diversifying supply chains, supporting business investment, and maintaining consumer spending,” says Grace Feeley, a research analyst at M Capital Group.
While the economic indicators are positive, the risks are coming closer to manifesting and threatening such growth. The new variants spreading throughout the world, Delta, Lambda, and Gamma, are vaccine-resistant and muddy the predictions made about the economy and health of the country. These variants bring back the feeling of uncertainty that has wreaked havoc not only on the stock market but the mindset of people around the world. MCG provides unique insight on how to mitigate these risks to possibly ensure a bright economic future.
If you are looking for a pi coin investor. Then look no further because I have the right one he is a pi vendor (he buy and resell to whales in China). I met him on a crypto conference and ever since I and my friends have sold more than 10k pi coins to him And he bought all and still want more. I will drop his telegram handle below just send him a message.
@Pi_vendor_247
Empowering the Unbanked: The Vital Role of NBFCs in Promoting Financial Inclu...Vighnesh Shashtri
In India, financial inclusion remains a critical challenge, with a significant portion of the population still unbanked. Non-Banking Financial Companies (NBFCs) have emerged as key players in bridging this gap by providing financial services to those often overlooked by traditional banking institutions. This article delves into how NBFCs are fostering financial inclusion and empowering the unbanked.
what is the best method to sell pi coins in 2024DOT TECH
The best way to sell your pi coins safely is trading with an exchange..but since pi is not launched in any exchange, and second option is through a VERIFIED pi merchant.
Who is a pi merchant?
A pi merchant is someone who buys pi coins from miners and pioneers and resell them to Investors looking forward to hold massive amounts before mainnet launch in 2026.
I will leave the telegram contact of my personal pi merchant to trade pi coins with.
@Pi_vendor_247
Falcon stands out as a top-tier P2P Invoice Discounting platform in India, bridging esteemed blue-chip companies and eager investors. Our goal is to transform the investment landscape in India by establishing a comprehensive destination for borrowers and investors with diverse profiles and needs, all while minimizing risk. What sets Falcon apart is the elimination of intermediaries such as commercial banks and depository institutions, allowing investors to enjoy higher yields.
Resume
• Real GDP growth slowed down due to problems with access to electricity caused by the destruction of manoeuvrable electricity generation by Russian drones and missiles.
• Exports and imports continued growing due to better logistics through the Ukrainian sea corridor and road. Polish farmers and drivers stopped blocking borders at the end of April.
• In April, both the Tax and Customs Services over-executed the revenue plan. Moreover, the NBU transferred twice the planned profit to the budget.
• The European side approved the Ukraine Plan, which the government adopted to determine indicators for the Ukraine Facility. That approval will allow Ukraine to receive a EUR 1.9 bn loan from the EU in May. At the same time, the EU provided Ukraine with a EUR 1.5 bn loan in April, as the government fulfilled five indicators under the Ukraine Plan.
• The USA has finally approved an aid package for Ukraine, which includes USD 7.8 bn of budget support; however, the conditions and timing of the assistance are still unknown.
• As in March, annual consumer inflation amounted to 3.2% yoy in April.
• At the April monetary policy meeting, the NBU again reduced the key policy rate from 14.5% to 13.5% per annum.
• Over the past four weeks, the hryvnia exchange rate has stabilized in the UAH 39-40 per USD range.
Turin Startup Ecosystem 2024 - Ricerca sulle Startup e il Sistema dell'Innov...Quotidiano Piemontese
Turin Startup Ecosystem 2024
Una ricerca de il Club degli Investitori, in collaborazione con ToTeM Torino Tech Map e con il supporto della ESCP Business School e di Growth Capital
Turin Startup Ecosystem 2024 - Ricerca sulle Startup e il Sistema dell'Innov...
A Presentation on IS-LM Model
1.
2. A Presentation By : -
Dhananjay Ghei
09HS2023
Abhishek Jadon
09HS2010
3. The Goods and The Money Market
Equilibrium
Equilibrium of the goods market is achieved when the
goods market is cleared, i.e. , according to Keynes,
planned saving is equal to planned investment.
S=I
OR
Y=C+I
Equilibrium of the money market requires equality
between the supply of and the demand for money.
Ms = Md
4. Equilibrium in the Goods Market
In developing the IS model, investment is
considered as a function of rate of interest ,
consumption and saving as functions of income.
Investment Function : I = I(r)
Consumption Function : C = C(Y)
Saving Function : S = S(Y)
Equilibrium in the goods market is achieved when
:-
S(Y) = I(r)
However, this relationship may be shown
graphically as follows
5. IS Curve
Re-translation of Simple Keynesian model at
equilibrium (Investment = Saving).
A plot of equilibrium output for various
interest rates within the market for goods and
services.
6. Determining Output
Note two characteristics of ZZ:
Because it’s assumed that the
consumption and investment
Relations are linear, ZZ is,
in general, a curve
rather than a line.
ZZ is drawn flatter than a 45-
degree line because it’s
assumed that an increase in
output leads to a less than one
for-one increase in demand.
7. Deriving the IS Curve
Deriving the IS Curve
(a) An increase in the interest rate
decreases the demand for goods
at any level of output, leading to
a decrease in the equilibrium level of
output.
(b) Equilibrium in the goods market
implies that an increase in the
interest rate leads to a decrease in
output.
8. Properties of IS Curve
Downward Sloping,
i C, I Y*
Increase/Decrease in autonomous
expenditure will shift the IS curve
Rightward/Leftward.
The steepness or flatness of the IS curve
describes the elasticity or responsiveness of
C and I to the nominal interest rate.
-- Steep IS curve: inelastic.
-- Flat IS curve: elastic.
9. Shifts in IS Curve due to taxes
An increase in taxes
shifts the IS curve to
the left.
10. Equilibrium in the Money Market
Money Market Equilibrium is achieved when the
supply of money and demand for money are
equal.
M s = Md
Money Demand is made of two parts : -
Msp : Speculative Demand for Money
Mt : Transactionary Demand for Money
Md = Msp + Mt
11. LM Curve
Depicts equilibrium in the Money market (L =
M), as well as the Bond Market (by Walras
Law).
A plot of the equilibrium interest rate for
various levels of output or income, within the
money market for a given level of the nominal
money supply.
12. Deriving the LM Curve
An increase in income rate.
leads, at a given Equilibrium in the
interest rate, to an financial markets
increase in the implies that an
demand for money. increase in income
Given the money leads to an increase in
supply, this increase the interest rate. The
in the demand for LM curve is therefore
money leads to an upward sloping.
increase in the
equilibrium interest
14. Properties of LM Curve
Upward sloping,
Y L i*
Increase/Decrease in the real money supply
shift the LM curve Rightward/Leftward.
The steepness or flatness of the LM curve
describes the elasticity or responsiveness of
money demand (L) to the nominal interest
rate.
-- Steep LM curve: inelastic.
-- Flat LM curve: elastic.
15. Shifts in LM Curve due to change in
Money Supply
An increase in money
causes the LM curve
to shift down.
16. Two – Market Equilibrium
The intersection point of the IS and LM curve
denotes the equilibrium point between the two
markets.
There is only one combination of Y and r at which
both the goods market and the money market are
in equilibrium simultaneously.
18. Fiscal and Monetary policies
Fiscal contraction, refers to fiscal policy that reduces the
budget deficit.
An increase in the deficit is called a fiscal expansion.
Taxes affect the IS curve, not the LM curve.
Monetary contraction, refers to a decrease in the
money supply.
An increase in the money supply is called monetary
expansion.
Monetary policy does not affect the IS curve, only the
LM curve.
For example, an increase in the money supply shifts
the LM curve down.
21. Quiz
In the IS side of the IS-LM model, the money market:
a.) is implicit in the I curve
b.)is completely absent
c.) conditions equilibrium
The goods market side of the IS-LM model is:
a.)flow model
b.)stock model
c.) neither
If I is highly sensitive to r then, graphically:
a.) IS curve will be close to vertical
b.) IS Curve will be close to horizontal
c.) IS Curve will be impossible to draw
22. Quiz
Equilibrium in the Goods Market occurs when:
a.) I + G = S + T
b.) G = T
c.) S = T
Graphically, a fall in G would:
a.) shift IS rightward
b.) shift IS leftward
c.) make IS vertical
The money market side of the IS-LM model is:
a.) flow model
b.) stock model
c.)neither
23. Quiz
Speculative demand for money is a function of:
a.) r
b.) Y
c.) G
In IS-LM model, money supply is:
a.) endogenous
b.)exogenous
c.)irrelevant
Since the velocity of money increases as interest rates rise
the:
a.) LM curve is positively sloped
b.)LM curve is negatively sloped
c.)IS curve is negatively sloped
24. Quiz
A change in the public's desire to hold money will:
a.) shift the LM curve
b.) change the slope and position of LM Curve
c.) change the slope of LM Curve
When the central bank sells government bonds on
the open market we have:
a.) contractionary monetary policy
b.) expansionary monetary policy
c.) contractionary fiscal policy
d.) expansionary fiscal policy
25. Quiz
If the Congress passes wage and price controls in response
to increased inflation we have had:
a.) contractionary monetary policy
b.) expansionary monetary policy
c.) contractionary fiscal policy
d.) expansionary fiscal policy
e.) none of the above
The IS curve shows all combinations of income and:
a.) interest rate for which the goods market is in equilibrium
b.) interest rate for which the money market is in equilibrium
c.)price level for which the goods market is in equilibrium
d.)price level for which the money market is in equilibrium
26. Quiz
In terms of the ISLM model, an increase in tax rates
should move the:
a.)IS curve left
b.)IS curve right
c.)LM curve right
d.)LM curve left
The LM curve depicts Y,r combinations at which:
a.) transactions and speculative demands are equal
b.)transaction demand does not exceed speculative
demand
c.)money demand equals money supply
27.
28.
29. What happened in U.S. in 2001?
The U.S. economy shrank in three quarters in the early
2000s (the 3rd quarter of 2000), the first quarter of
2001, and the third quarter of 2001.
The US economy was in recession from March 2001 to
November 2001, a period of eight months.
2.1 million people lost their jobs as unemployment rose
from 3.9% to 5.8% .
GDP growth slowed to 0.8% ( compared to 3.9%
annual average growth during 1994-2000)
30. Causes of U.S Recession
Stock Market Decline
1500 Standard & Poor’s 500
1200
Index
900
600
300
1995 1996 1997 1998 1999 2000 2001 2002 2003
9/11 Attack on U.S.
31. Outcome of the Recession
Increased Uncertainty.
Fall in Consumer and Business Confidence.
This all resulted in : -
Lower Spending, IS curve shifted towards
left.
Reduced Stock Prices, Discouraged
Investment
32. Measures taken
Fiscal Measure
IS Curve shifts towards Right
1. Tax cuts in 2001 and 2003
2. Spending Increases
a. Airline industry bailout
b. Afghanistan War
Monetary Measure
LM Curve shifts donwards towards Right.
1. Rise in interest rate
2. Depress Income
33. The U.S Recession with IS – LM
Model
The decrease in investment
demand led to a sharp shift
of the IS curve to the
left, from IS to IS”.
The increase in the money
supply led to a downward
shift of the LM curve, from
LM to LM’.
The decrease in tax rates
and the increase in spending
both led to a shift of the IS
curve to the right, from IS’’ to
IS’.
34. Conclusion
IS Curve represents the equilibrium of the goods
market.
LM Curve represents the equilibrium of the money
market.
The point of intersection of the two curves is the point
of equilibrium of both the markets simultaneously.
By taking both fiscal and monetary measures using
the IS – LM model recession can be checked out.
35. Refrences
Books referred : -
1. Macroeconomic Analysis : - E. Shapiro
2. Macroeconomics : – N. Gregory Mankiw
3. An Inquiry into the Nature and Causes of the
Wealth of Nations : - Adam Smith
Online References : -
1. Wikipedia
2. Authorstream
3. IS – LM model by Dudley Cooke (Trinity College
Dublin)