Downloaded 525 times
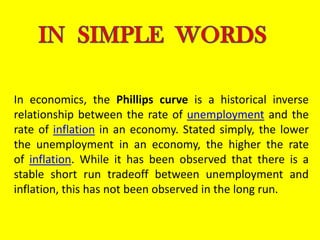
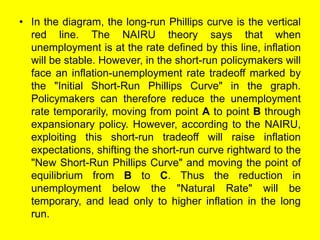
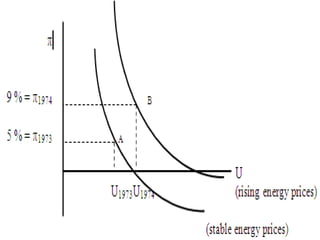
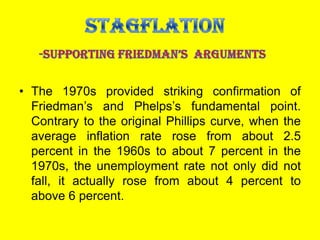
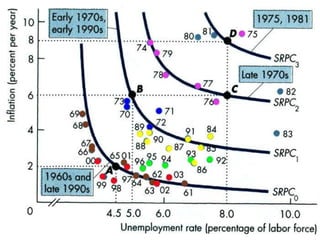


The Phillips curve describes an inverse relationship between unemployment and inflation, such that lower unemployment is associated with higher inflation. While observed to be stable in the short-run, it does not hold in the long-run. The document discusses the origins of the Phillips curve from William Phillips' 1958 paper and subsequent modifications by economists like Friedman and Phelps who argued it does not reflect long-run economic realities. It also examines shifts to the Phillips curve from supply shocks and how the relationship between unemployment and inflation is now understood with incorporation of inflation expectations.