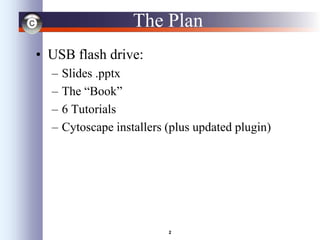
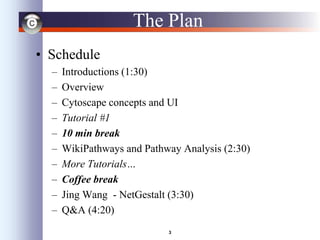
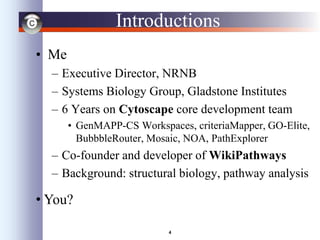
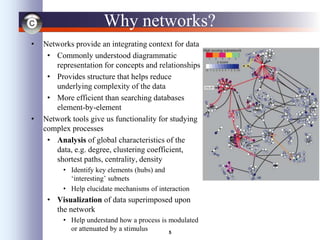
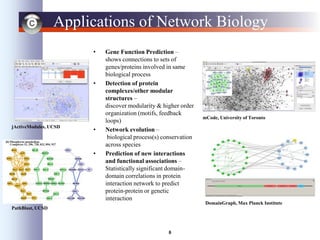
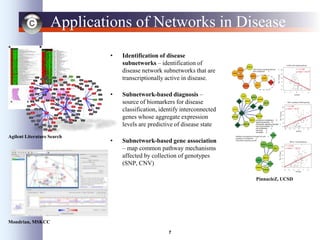
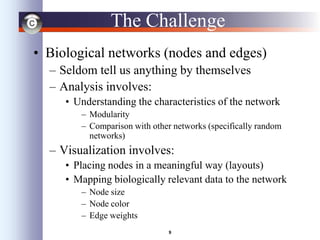
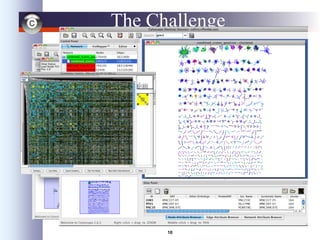
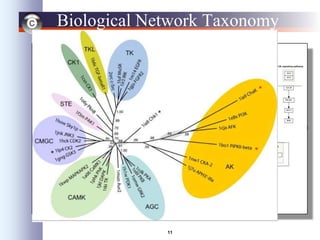
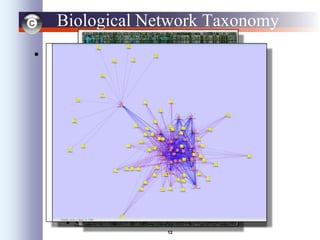
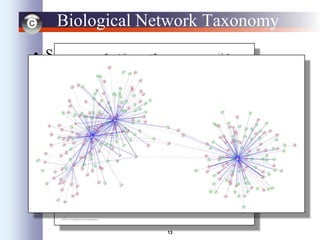
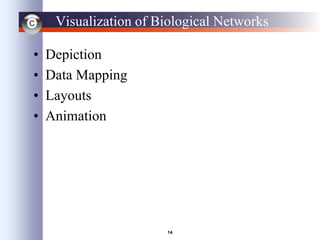
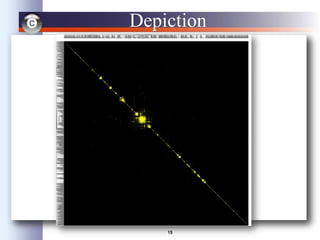
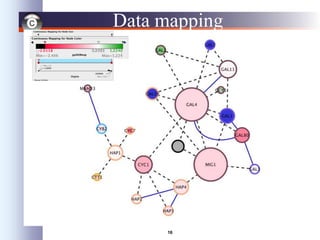
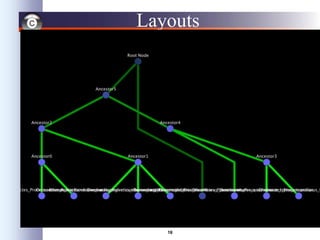
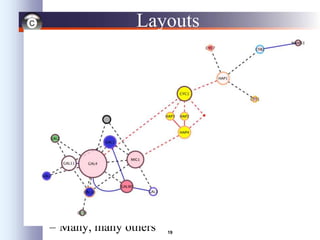
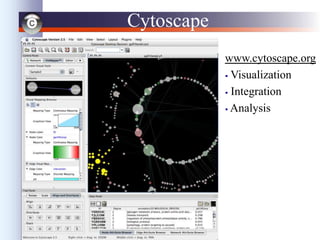
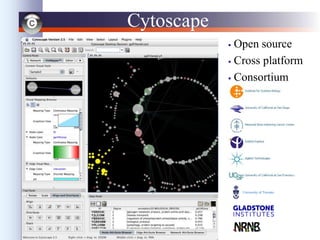
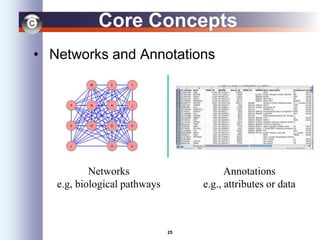
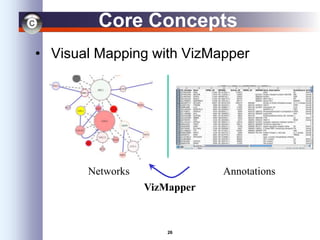
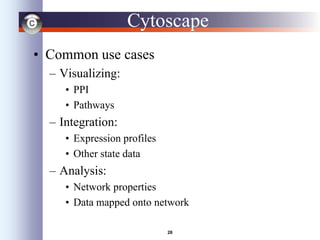
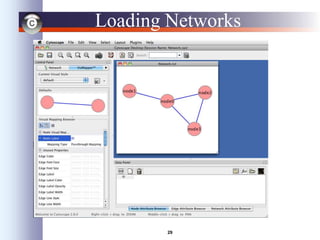
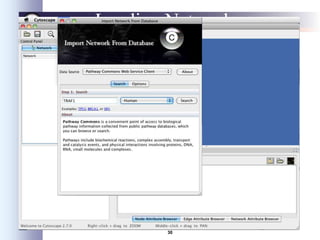
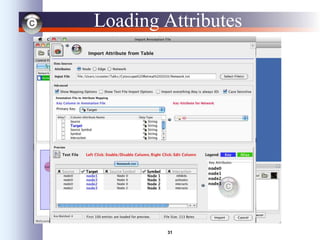
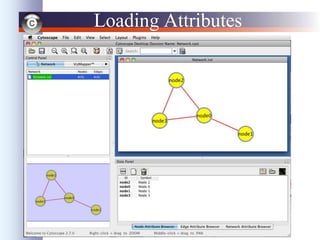
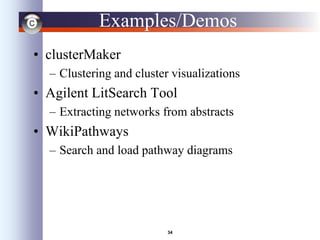
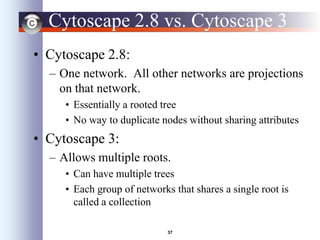
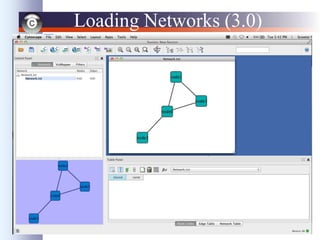
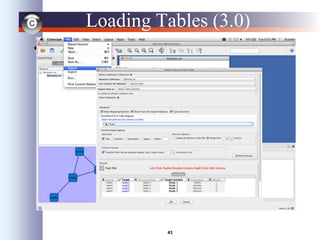
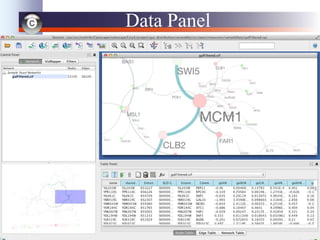
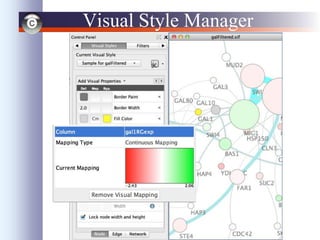
This document provides an overview and agenda for an introductory workshop on network visualization and analysis using Cytoscape. The agenda includes introductions, an overview of Cytoscape concepts and user interface, six tutorials, breaks, and a presentation on pathway analysis. The document discusses loading and visualizing networks and attributes in Cytoscape, different types of biological networks, visualization techniques like layouts and data mapping, and tips for using Cytoscape effectively.
cytoscape is open source network analyses tools, in this slides we define the basic features of this tool, and a brief tutorial of how can you use this tool in innovative way.
Systems biology & Approaches of genomics and proteomicssonam786
This presentation provides the basic understanding of varous genomics and proteomics techniques.Systems biology studies life as a system .It includes the study of living system using various omic technologies .
Owing to the fragmented nature of EST reads, it is worthwhile to attempt to organize the reads into assemblies that provide a consensus view of the sampled transcripts.
Such fragmented, EST data or gene sequence data, placed in correct context, and indexed by gene such that all expressed data concerning a single gene is in a single index class, and each index class contains the information for only one gene is an EST cluster.
A biological database providing free online retrieval of all the literature related to genetic diseases and their relationships with the phenotypes which are submitted by the medical and biological researchers that are updated regularly
Introduction to Biological Network Analysis and Visualization with Cytoscape ...Keiichiro Ono
Introduction to biological network analysis and visualization with Cytoscape (using the latest version 3.4).
This is a first half of the lecture for Applied Bioinformatics lecture at TSRI.
Introduction
Transcriptome analysis
Goal of functional genomics
Why we need functional genomics
Technique
1. At DNA level
2.At RNA level
3. At protein level
4. loss of function
5. functional genomic and bioinformatics
Application
Latest research and reviews
Websites of functional genomics
Conclusions
Reference
ExPASy is the SIB Bioinformatics Resource Portal which provides access to scientific databases and software tools (i.e., resources) in different areas of life sciences including proteomics, genomics, phylogeny, systems biology, population genetics, transcriptomics etc
INTRODUCTION
STRUCTURAL PROTEOMICS
WHAT IS THE IMPORTANCE OF STUDY OF PROTEIN
METHODS FOR SOLVING PROTEIN STRUCTURE
1. X- RAY CRYSTALLOGRAPHY
INTRODUCTION
PROCEDURE
LIMITATIONS
2.NUCLEAR MAGNETIC RESONANCE
PROTEIN STRUCTURE DETERMINATION
3. MASS SPECTROMETER
MALDI
ESI
STRUCTURE MODELING
APPLICATIONS
CONCLUSION
REFERENCES
Biotechnology information system in india (btis net)KAUSHAL SAHU
Introduction to Bioinformatics
Bioinformatics in India
Biotechnology Information System Network
Objective
Structure of BTISnet in India
Apex centre
Centre of excellence
Research activities proposed to be undertaken by the CoEs
Distributed information centers(DICs)
Sub-Distribution
Sub-DIC National Institute of Technology, Raipur
BIF for Biology Teaching Through Bioinformatics (BTBI)
EMBnet India Node
Future planning
Conclusion
Reference
Slide deck from my presentation at NYC's #Pydata 2012 conference - http://nyc2012.pydata.org/abstracts/#gephi
Talk abstract:
Are you interested in working with social data to map out communities and connections between friends, fans and followers? In this session I'll show ways in which we use the python networkx library along with the open source gephi visualization tool to make sense of social network data. We'll take a few examples from Twitter, look at how a hashtag spreads through the network, and then analyze the connections between users posting to the hashtag. We'll be constructing graphs, running stats on them and then visualizing the output.
A Fast and Dirty Intro to NetworkX (and D3)Lynn Cherny
Using the python lib NetworkX to calculate stats on a Twitter network, and then display the results in several D3.js visualizations. Links to demos and source files. I'm @arnicas and live at www.ghostweather.com.
(ATS4-DEV02) Accelrys Query Service: Technology and ToolsBIOVIA
This talk discussions the technology provided by the new Accelrys Query Service and what it offers to developers. Attendees should come away with a basic understanding of what the query service does, when it is the technology of choice, and how to use it.
Database Models, Client-Server Architecture, Distributed Database and Classif...Rubal Sagwal
Introduction to Data Models
-Hierarchical Model
-Network Model
-Relational Model
-Client/Server Architecture
Introduction to Distributed Database
Classification of DBMS
A machine learning and data science pipeline for real companiesDataWorks Summit
Comcast is one of the largest cable and telecommunications providers in the country built on decades of mergers, acquisitions, and subscriber growth. The success of our company depends on keeping our customers happy and how quickly we can pivot with changing trends and new technologies. Data abounds within our internal data centers and edge networks as well as both the private and public cloud across multiple vendors.
Within such an environment and given such challenges, how do we get AI, machine learning, and data science platforms built so our company can respond to the market, predict our customers’ needs and create new revenue generating products that delight our customers? If you don’t happen to be our friends and colleagues at Google, Facebook, and Amazon, what are technologies, strategies, and toolkits you can employ to bring together disparate data sets and quickly get them into the hands of your data scientists and then into your own production systems for use by your customers and business partners?
We’ll explore our journey and evolution and look at specific technologies and decisions that have gotten us to where we are today and demo how our platform works.
Speaker
Ray Harrison, Comcast, Enterprise Architect
Prashant Khanolkar, Comcast, Principal Architect Big Data
Keynote given at the workshop for Artificial Intelligence meets the Web of Data on Pragmatic Semantics.
In this keynote I argue that the Web of Data is a Complex System or Marketplace of Ideas rather than a classical Database, and that the model theory on which classical semantics are based is not appropriate in all situations, and propose an alternative "Pragmatic Semantics" based on optimisation of possible interpretations. .
Lambda Data Grid: An Agile Optical Platform for Grid Computing and Data-inten...Tal Lavian Ph.D.
Lambda Data Grid
An Agile Optical Platform for Grid Computing
and Data-intensive Applications
Focus on BIRN Mouse application.
Great vision –
LambdaGrid is one step towards this concepts
LambdaGrid –
A novel service architecture
Lambda as a Scheduled Service
Lambda as a prime resource - like storage and computation
Change our current systems assumptions
Potentially opens new horizon
Network Visualization guest lecture at #DataVizQMSS at @Columbia / #SNA at PU...Denis Parra Santander
- First version was a guest lecture about Network Visualization in the class "Data Visualization" taught by Dr. Sharon Hsiao in the QMSS program at Columbia University http://www.columbia.edu/~ih2240/dataviz/index.htm
- This updated version was delivered in our class on SNA at PUC Chile in the MPGI master program.
Practice discovering biological knowledge using networks approach.Elena Sügis
This practice session gives an overview how to analyze biological data using networks approach. It covers netwokrs topology, data integration, differential expression, network visualization, functional enrichment analysis and retrieving data from external sources. Primarily Cytoscape software is used for this practice session.
Similar to Network Visualization and Analysis with Cytoscape (20)
National Resource for Networks Biology's TR&D Theme 3: Although networks have been very useful for representing molecular interactions and mechanisms, network diagrams do not visually resemble the contents of cells. Rather, the cell involves a multi-scale hierarchy of components – proteins are subunits of protein complexes which, in turn, are parts of pathways, biological processes, organelles, cells, tissues, and so on. In this technology research project, we will pursue methods that move Network Biology towards such hierarchical, multi-scale views of cell structure and function.
Technology R&D Theme 2: From Descriptive to Predictive NetworksAlexander Pico
National Resource for Networks Biology's TR&D Theme 2: Genomics is mapping complex data about human biology and promises major medical advances. However, the routine use of genomics data in medical research is in its infancy, due mainly to the challenges of working with highly complex “big data”. In this theme, we will use network information to help organize, analyze and integrate these data into models that can be used to make clinically relevant diagnoses and predictions about an individual.
National Resource for Networks Biology's TR&D Theme 1: In this theme, we will develop a series of tools and methodologies for conducting differential analyses of biological networks perturbed under multiple conditions. The novel algorithmic methodologies enable us to make use of high-throughput proteomic level data to recover biological networks under specific biological perturbations. The software tools developed in this project enable researchers to further predict, analyze, and visualize the effects of these perturbations and alterations, while enabling researchers to aggregate additional information regarding the known roles of the involved interactions and their participants.
The NRNB has been funded as an NIGMS Biomedical Technology Research Resource since 2010. During the previous five-year period, NRNB investigators introduced a series of innovative methods for network biology including network-based biomarkers, network-based stratification of genomes, and automated inference of gene ontologies using network data. Over the next five years, we will seek to catalyze major phase transitions in how biological networks are represented and used, working across three broad themes: (1) From static to differential networks, (2) From descriptive to predictive networks, and (3) From flat to hierarchical networks bridging across scales. All of these efforts leverage and further support our growing stable of network technologies, including the popular Cytoscape network analysis infrastructure.
Visualization and Analysis of Dynamic Networks Alexander Pico
DynNetwork development was taken up initially by Sabina Sara Pfister back in GSoC 2012. She laid out a strong foundation for dynamic network visualization in Cytoscape and my job was to extend the plugin’s functionality to help users analyse time changing networks. The two of us were mentored by Jason Montojo. We had developed a decent tool over the course of two GSoC programs to aid dynamic network analysis and our efforts culminated in DynNetwork getting accepted for an oral presentation at the International Network for Social Network Analysis (INSNA), Sunbelt 2014 which was held in St. Petersburg, FL in February.
Ozempic: Preoperative Management of Patients on GLP-1 Receptor Agonists Saeid Safari
Preoperative Management of Patients on GLP-1 Receptor Agonists like Ozempic and Semiglutide
ASA GUIDELINE
NYSORA Guideline
2 Case Reports of Gastric Ultrasound
Pulmonary Thromboembolism - etilogy, types, medical- Surgical and nursing man...VarunMahajani
Disruption of blood supply to lung alveoli due to blockage of one or more pulmonary blood vessels is called as Pulmonary thromboembolism. In this presentation we will discuss its causes, types and its management in depth.
Report Back from SGO 2024: What’s the Latest in Cervical Cancer?bkling
Are you curious about what’s new in cervical cancer research or unsure what the findings mean? Join Dr. Emily Ko, a gynecologic oncologist at Penn Medicine, to learn about the latest updates from the Society of Gynecologic Oncology (SGO) 2024 Annual Meeting on Women’s Cancer. Dr. Ko will discuss what the research presented at the conference means for you and answer your questions about the new developments.
263778731218 Abortion Clinic /Pills In Harare ,sisternakatoto
263778731218 Abortion Clinic /Pills In Harare ,ABORTION WOMEN’S CLINIC +27730423979 IN women clinic we believe that every woman should be able to make choices in her pregnancy. Our job is to provide compassionate care, safety,affordable and confidential services. That’s why we have won the trust from all generations of women all over the world. we use non surgical method(Abortion pills) to terminate…Dr.LISA +27730423979women Clinic is committed to providing the highest quality of obstetrical and gynecological care to women of all ages. Our dedicated staff aim to treat each patient and her health concerns with compassion and respect.Our dedicated group ABORTION WOMEN’S CLINIC +27730423979 IN women clinic we believe that every woman should be able to make choices in her pregnancy. Our job is to provide compassionate care, safety,affordable and confidential services. That’s why we have won the trust from all generations of women all over the world. we use non surgical method(Abortion pills) to terminate…Dr.LISA +27730423979women Clinic is committed to providing the highest quality of obstetrical and gynecological care to women of all ages. Our dedicated staff aim to treat each patient and her health concerns with compassion and respect.Our dedicated group of receptionists, nurses, and physicians have worked together as a teamof receptionists, nurses, and physicians have worked together as a team wwww.lisywomensclinic.co.za/
Couples presenting to the infertility clinic- Do they really have infertility...Sujoy Dasgupta
Dr Sujoy Dasgupta presented the study on "Couples presenting to the infertility clinic- Do they really have infertility? – The unexplored stories of non-consummation" in the 13th Congress of the Asia Pacific Initiative on Reproduction (ASPIRE 2024) at Manila on 24 May, 2024.
Prix Galien International 2024 Forum ProgramLevi Shapiro
June 20, 2024, Prix Galien International and Jerusalem Ethics Forum in ROME. Detailed agenda including panels:
- ADVANCES IN CARDIOLOGY: A NEW PARADIGM IS COMING
- WOMEN’S HEALTH: FERTILITY PRESERVATION
- WHAT’S NEW IN THE TREATMENT OF INFECTIOUS,
ONCOLOGICAL AND INFLAMMATORY SKIN DISEASES?
- ARTIFICIAL INTELLIGENCE AND ETHICS
- GENE THERAPY
- BEYOND BORDERS: GLOBAL INITIATIVES FOR DEMOCRATIZING LIFE SCIENCE TECHNOLOGIES AND PROMOTING ACCESS TO HEALTHCARE
- ETHICAL CHALLENGES IN LIFE SCIENCES
- Prix Galien International Awards Ceremony
micro teaching on communication m.sc nursing.pdfAnurag Sharma
Microteaching is a unique model of practice teaching. It is a viable instrument for the. desired change in the teaching behavior or the behavior potential which, in specified types of real. classroom situations, tends to facilitate the achievement of specified types of objectives.
Flu Vaccine Alert in Bangalore Karnatakaaddon Scans
As flu season approaches, health officials in Bangalore, Karnataka, are urging residents to get their flu vaccinations. The seasonal flu, while common, can lead to severe health complications, particularly for vulnerable populations such as young children, the elderly, and those with underlying health conditions.
Dr. Vidisha Kumari, a leading epidemiologist in Bangalore, emphasizes the importance of getting vaccinated. "The flu vaccine is our best defense against the influenza virus. It not only protects individuals but also helps prevent the spread of the virus in our communities," he says.
This year, the flu season is expected to coincide with a potential increase in other respiratory illnesses. The Karnataka Health Department has launched an awareness campaign highlighting the significance of flu vaccinations. They have set up multiple vaccination centers across Bangalore, making it convenient for residents to receive their shots.
To encourage widespread vaccination, the government is also collaborating with local schools, workplaces, and community centers to facilitate vaccination drives. Special attention is being given to ensuring that the vaccine is accessible to all, including marginalized communities who may have limited access to healthcare.
Residents are reminded that the flu vaccine is safe and effective. Common side effects are mild and may include soreness at the injection site, mild fever, or muscle aches. These side effects are generally short-lived and far less severe than the flu itself.
Healthcare providers are also stressing the importance of continuing COVID-19 precautions. Wearing masks, practicing good hand hygiene, and maintaining social distancing are still crucial, especially in crowded places.
Protect yourself and your loved ones by getting vaccinated. Together, we can help keep Bangalore healthy and safe this flu season. For more information on vaccination centers and schedules, residents can visit the Karnataka Health Department’s official website or follow their social media pages.
Stay informed, stay safe, and get your flu shot today!
New Directions in Targeted Therapeutic Approaches for Older Adults With Mantl...i3 Health
i3 Health is pleased to make the speaker slides from this activity available for use as a non-accredited self-study or teaching resource.
This slide deck presented by Dr. Kami Maddocks, Professor-Clinical in the Division of Hematology and
Associate Division Director for Ambulatory Operations
The Ohio State University Comprehensive Cancer Center, will provide insight into new directions in targeted therapeutic approaches for older adults with mantle cell lymphoma.
STATEMENT OF NEED
Mantle cell lymphoma (MCL) is a rare, aggressive B-cell non-Hodgkin lymphoma (NHL) accounting for 5% to 7% of all lymphomas. Its prognosis ranges from indolent disease that does not require treatment for years to very aggressive disease, which is associated with poor survival (Silkenstedt et al, 2021). Typically, MCL is diagnosed at advanced stage and in older patients who cannot tolerate intensive therapy (NCCN, 2022). Although recent advances have slightly increased remission rates, recurrence and relapse remain very common, leading to a median overall survival between 3 and 6 years (LLS, 2021). Though there are several effective options, progress is still needed towards establishing an accepted frontline approach for MCL (Castellino et al, 2022). Treatment selection and management of MCL are complicated by the heterogeneity of prognosis, advanced age and comorbidities of patients, and lack of an established standard approach for treatment, making it vital that clinicians be familiar with the latest research and advances in this area. In this activity chaired by Michael Wang, MD, Professor in the Department of Lymphoma & Myeloma at MD Anderson Cancer Center, expert faculty will discuss prognostic factors informing treatment, the promising results of recent trials in new therapeutic approaches, and the implications of treatment resistance in therapeutic selection for MCL.
Target Audience
Hematology/oncology fellows, attending faculty, and other health care professionals involved in the treatment of patients with mantle cell lymphoma (MCL).
Learning Objectives
1.) Identify clinical and biological prognostic factors that can guide treatment decision making for older adults with MCL
2.) Evaluate emerging data on targeted therapeutic approaches for treatment-naive and relapsed/refractory MCL and their applicability to older adults
3.) Assess mechanisms of resistance to targeted therapies for MCL and their implications for treatment selection
Ethanol (CH3CH2OH), or beverage alcohol, is a two-carbon alcohol
that is rapidly distributed in the body and brain. Ethanol alters many
neurochemical systems and has rewarding and addictive properties. It
is the oldest recreational drug and likely contributes to more morbidity,
mortality, and public health costs than all illicit drugs combined. The
5th edition of the Diagnostic and Statistical Manual of Mental Disorders
(DSM-5) integrates alcohol abuse and alcohol dependence into a single
disorder called alcohol use disorder (AUD), with mild, moderate,
and severe subclassifications (American Psychiatric Association, 2013).
In the DSM-5, all types of substance abuse and dependence have been
combined into a single substance use disorder (SUD) on a continuum
from mild to severe. A diagnosis of AUD requires that at least two of
the 11 DSM-5 behaviors be present within a 12-month period (mild
AUD: 2–3 criteria; moderate AUD: 4–5 criteria; severe AUD: 6–11 criteria).
The four main behavioral effects of AUD are impaired control over
drinking, negative social consequences, risky use, and altered physiological
effects (tolerance, withdrawal). This chapter presents an overview
of the prevalence and harmful consequences of AUD in the U.S.,
the systemic nature of the disease, neurocircuitry and stages of AUD,
comorbidities, fetal alcohol spectrum disorders, genetic risk factors, and
pharmacotherapies for AUD.
- Video recording of this lecture in English language: https://youtu.be/lK81BzxMqdo
- Video recording of this lecture in Arabic language: https://youtu.be/Ve4P0COk9OI
- Link to download the book free: https://nephrotube.blogspot.com/p/nephrotube-nephrology-books.html
- Link to NephroTube website: www.NephroTube.com
- Link to NephroTube social media accounts: https://nephrotube.blogspot.com/p/join-nephrotube-on-social-media.html
1. 1
Intro to Cytoscape
Network Visualization and
Analysis with Cytoscape
Alex Pico
apico@gladstone.ucsf.edu
Hey, early birds! USB:Cytoscape Tutorial/2.8 Installers/…
2. 2
The Plan
• USB flash drive:
– Slides .pptx
– The “Book”
– 6 Tutorials
– Cytoscape installers (plus updated plugin)
3. 3
The Plan
• Schedule
– Introductions (1:30)
– Overview
– Cytoscape concepts and UI
– Tutorial #1
– 10 min break
– WikiPathways and Pathway Analysis (2:30)
– More Tutorials…
– Coffee break
– Jing Wang - NetGestalt (3:30)
– Q&A (4:20)
4. 4
Introductions
• Me
– Executive Director, NRNB
– Systems Biology Group, Gladstone Institutes
– 6 Years on Cytoscape core development team
• GenMAPP-CS Workspaces, criteriaMapper, GO-Elite,
BubbbleRouter, Mosaic, NOA, PathExplorer
– Co-founder and developer of WikiPathways
– Background: structural biology, pathway analysis
• You?
5. 5
Why networks?
• Networks provide an integrating context for data
• Commonly understood diagrammatic
representation for concepts and relationships
• Provides structure that helps reduce
underlying complexity of the data
• More efficient than searching databases
element-by-element
• Network tools give us functionality for studying
complex processes
• Analysis of global characteristics of the
data, e.g. degree, clustering coefficient,
shortest paths, centrality, density
• Identify key elements (hubs) and
„interesting‟ subnets
• Help elucidate mechanisms of interaction
• Visualization of data superimposed upon
the network
• Help understand how a process is modulated
or attenuated by a stimulus
6. 6
Applications of Network Biology
• Gene Function Prediction –
shows connections to sets of
genes/proteins involved in same
biological process
• Detection of protein
complexes/other modular
structures –
discover modularity & higher order
organization (motifs, feedback
loops)
• Network evolution –
biological process(s) conservation
across species
• Prediction of new interactions
and functional associations –
Statistically significant domain-
domain correlations in protein
interaction network to predict
protein-protein or genetic
interaction
jActiveModules, UCSD
PathBlast, UCSD
mCode, University of Toronto
DomainGraph, Max Planck Institute
7. 7
Applications of Networks in Disease
• Identification of disease
subnetworks – identification of
disease network subnetworks that are
transcriptionally active in disease.
• Subnetwork-based diagnosis –
source of biomarkers for disease
classification, identify interconnected
genes whose aggregate expression
levels are predictive of disease state
• Subnetwork-based gene association
– map common pathway mechanisms
affected by collection of genotypes
(SNP, CNV)
Agilent Literature Search
Mondrian, MSKCC
PinnacleZ, UCSD
9. 9
The Challenge
• Biological networks (nodes and edges)
– Seldom tell us anything by themselves
– Analysis involves:
• Understanding the characteristics of the network
– Modularity
– Comparison with other networks (specifically random
networks)
– Visualization involves:
• Placing nodes in a meaningful way (layouts)
• Mapping biologically relevant data to the network
– Node size
– Node color
– Edge weights
15. 15
Depiction
• There are various ways to depict biological
networks:
– Node-Link (graph) representation
• This is what we most often think of
– Partitioned Node-Link representation
• Split graph into discrete partitions based on some
feature
– Matrix representation
• Can be useful for very dense networks
• Can also map information into cells of matrix
– e.g. degree, color scale (heat map)
16. 16
Data mapping
• Mapping of data values associated with graph
elements onto graph visuals
• Visual attributes
– Node fill color, border color, border width, size,
shape, opacity, label
– Edge type, color, width, ending type, ending size,
ending color
• Mapping types
– Passthrough (labels)
– Continuous (numeric values)
– Discrete (categories)
17. 17
Data mapping
• Avoid cluttering your visualization with too
much data
– Map the data you are specifically interested in to
call out meaningful differences
– Mapping too much data to visual attributes may
just confuse the viewer
– Can always create multiple networks and map
different values
18. 18
Layouts
• Layouts determine the location of nodes and
(sometimes) the paths of edges
• Types:
– Simple
• Grid
• Partitions
– Hierarchical
• layout data as a tree or hierarchy
• Works best when there are no loops
– Circular (Radial)
• arrange nodes around a circle
• could use node attributes to govern position
– e.g. degree sorted
19. 19
Layouts
• Types:
– Force-Directed
• simulate edges as springs
• may be weighted or unweighted
– Combining layouts
• Use a general layout (force directed) for the entire
graph, but use hierarchical or radial to focus on a
particular portion
– Multi-layer layouts
• Partition graph, layout each partition then layout
partitions
– Many, many others
20. 20
Layouts
• Use layouts to convey the relationships
between the nodes
• Layout algorithms may need to be “tuned” to
fit your network
– LayoutsSettings… menu
• Lots of parameters to change layout algorithm
behavior
• Can also consider laying out portions of your
network
21. 21
Animation
• Animation is useful to show changes in a
network:
– Over a time series
– Over different conditions
– Between species
22. 22
Introduction to Cytoscape
• Overview
• Core Concepts
– Networks vs. Attributes
– VizMapper
– Apps
• Working with Data
– Loading network from the Web
– Importing networks from csv files or Excel
– Importing attributes from csv files or Excel
– The attribute browser
• Cytoscape tips & tricks
28. 28
Cytoscape
• Common use cases
– Visualizing:
• PPI
• Pathways
– Integration:
• Expression profiles
• Other state data
– Analysis:
• Network properties
• Data mapped onto network
30. 30
Loading Networks
• Use import network from table:
– Excel file
– Comma or tab delimited text
• Use import network from web services
– Allows query and load from a variety of services:
• Pathway commons
• WikiPathways (if GPML plugin is loaded)
• NCBI Entrez Eutilities
• BioCyc
34. 34
Examples/Demos
• clusterMaker
– Clustering and cluster visualizations
• Agilent LitSearch Tool
– Extracting networks from abstracts
• WikiPathways
– Search and load pathway diagrams
35. 37
Cytoscape 2.8 vs. Cytoscape 3
• Cytoscape 2.8:
– One network. All other networks are projections
on that network.
• Essentially a rooted tree
• No way to duplicate nodes without sharing attributes
• Cytoscape 3:
– Allows multiple roots.
• Can have multiple trees
• Each group of networks that shares a single root is
called a collection
36. 42
Loading Networks (3.0)
• Conceptually the same as 2.8
– Use import network from table:
• Excel file
• Comma or tab delimited text
• …but
– Must specify if you want a new network collection
(tree)
– If not, you need to specify the join column
37. 43
Loading Tables (3.0)
• Same as 2.8, except:
– Use Import table from file
– You need to specify the network collection
40. 46
Cytoscape 2.8 vs 3.0
• Compare and Contrast
– 3.0 is more stable
– 3.0 has improved model and UI
– 2.8 has more apps
Depends on what you need and when you need it
• Timing
– Current release: 3.0.2
– 3.1 coming in October
– 22 apps and counting!
42. 48
Tips & Tricks
• “Root graph”
– “There is one graph to rule them all….”
– The networks in Cytoscape are all “views” on a
single graph.
– Changing the attribute for a node in one network
will also change that attribute for a node with the
same ID in all other loaded networks
– There is no way to “copy” a node and keep the
same ID
– Make a copy of the session
43. 49
Tips & Tricks
• Network views
– When you open a large network, you will not get a
view by default
– To improve interactive performance, Cytoscape
has the concept of “Levels of Detail”
• Some visual attributes will only be apparent when you
zoom in
• The level of detail for various attributes can be changed
in the preferences
• To see what things will look like at full detail:
– ViewShow Graphics Details
44. 50
Tips & Tricks
• Sessions
– Sessions save pretty much everything:
• Networks
• Properties
• Visual styles
• Screen sizes
– Saving a session on a large screen may require
some resizing when opened on your laptop
45. 51
Tips & Tricks
• Logging
– By default, Cytoscape writes it’s logs to the Error
Dialog: HelpError Dialog
– Can change a preference to write it to the console
• EditPreferencesProperties…
• Set logger.console to true
• Don’t forget to save your preferences
• Restart Cytoscape
– (can also turn on debugging: cytoscape.debug, but
I don’t recommend it)
46. 52
Tips & Tricks
• Memory
– Cytoscape uses lots of it
– Doesn’t like to let go of it
– An occasional restart when working with large
networks is a good thing
– Destroy views when you don’t need them
– Java doesn’t give us a good way to get the memory
right at start time
• Cytoscape 2.7 does a much better job at “guessing” good
default memory sizes than previous versions
47. 53
Tips & Tricks
• .cytoscape directory
– Your defaults and any plugins downloaded from the
plugin manager will go here
– Sometimes, if things get really messed up, deleting (or
renaming) this directory can give you a “clean slate”
• Plugin manager
– “Outdated” doesn’t necessarily mean “won’t work”
– Plugin authors don’t always update their plugins
immediately after new releases
– Click on “Show outdated plugins” to see the entire list
of plugins.
Editor's Notes
UPDATE
Medical professionals that work with patients? Bench biologists? Bioinformaticians? Software developers? CS and mathematicians? Physicists?
Cytoscape is a network visualization and analysis tool. What does that mean?Well, what are networks? They are points connected by lines; or nodes connected by edges. And what purpose do they serve? They are intuitive representations of the relationship between things (this connects to this, which connects to this). They reduce complexity by providing structure (like groupings and heirarchy). And networks and graphs like this provide efficiency over tables (reading this as a table of pair-wise interactions would be unenlightening).So, a network tool like Cytoscape gives us a way to generate and study networks. There are two main goals: Analysis and Visualization. You can analyze the inherent properites of a network (such as…). In more functional terms this might include identifying hubs or “interesting” subnetworks or following a mechanism of action. The other main goal is Visualization. You can not only visualize the network itself, but you can overlay data onto it and feed it back into the analysis. For example…
Cytoscape has been used to study…
And, specifically related to biomedical research, Cytoscape has been used to study a variety of diseases. In each of these cases, subnetworks are pulled out of the integration of networks and various biomedical datasets to identify…
So, the challenge here is to make sense of biological networks. Networks in biology come in all sorts of shapes and sizes, each inscrutable in it’s own way…
Signaling pathway: Androgen Receptor Signaling PathwayMetabolic pathway: One Carbon pathway
----- Meeting Notes (8/9/13 16:35) -----Think about YOUR data. What type is it? What network representation is most effective?
Add some examples
Add counter examples
Need layout examples
Notes: it is a Cytoscape goal that both the graph model and the data are free from Biological semantics
Notes: it is a Cytoscape goal that both the graph model and the data are free from Biological semanticsMention water distribution network publication