Download as PDF, PPTX
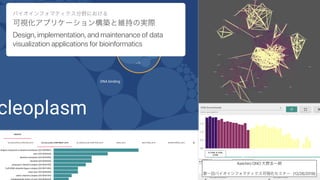


- Keiichiro Ono presented on his experience developing and maintaining bioinformatics visualization applications over 15 years, including Cytoscape. - Expanding applications to support new technologies like web, Python, and JavaScript is important to attract developers and connect to popular tools, but breaking API changes are difficult. - A loosely coupled approach integrating existing applications, Jupyter notebooks, and new web apps may be better than rewriting applications from scratch.