The document summarizes the accomplishments of the National Resource for Network Biology (NRNB) over the past year, including:
- Over 100 publications citing NRNB funding and high usage of Cytoscape tools
- 18 supported tools, 93 collaborations, and training of over 100 users
- Progress on developing algorithms for differential network analysis, predictive networks, and multi-scale networks
- Launch of two new NRNB workgroups on single cell genomics and patient similarity networks
- 18 new collaboration projects in areas like cancer, neuroinflammation, and drug transporters
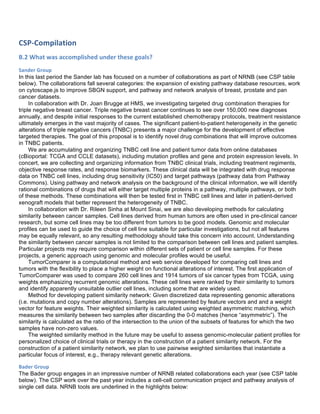
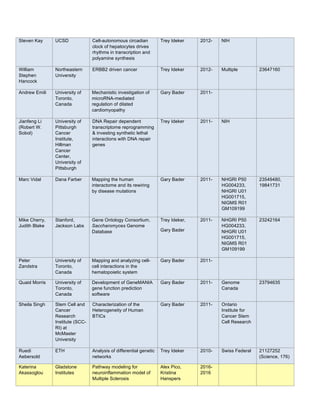
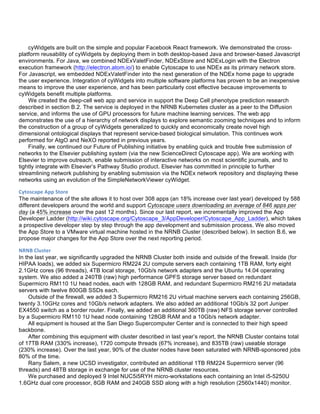
![phenotypic results we observe in vivo, we have also begun to perform deeper molecular profiling the xenograft
tumors.
This year, we followed-up with experiments to optimize dosing and endpoint data acquisition We
established reasonable doses by performing serial dilutions of palbociclib, saracatinib, and sunitinib. In the
DDLS8817-PDX, we found that the combination of palbociclib and sunitinib was was no more effective than
palbociclib alone. This was surprising as we had observed an increase in phospho-PDGFR-beta and may be
due to the “dirtiness” of the Sunitinib inihibitor, which is known to inhibit PDGFR and other receptor tyrosine
kinases. Based on our network analysis, the next experiment we attempted, combined palbociclib with the 2nd
generation Src inhibitor saracatinib. Unfortunately, we again had issues with dosing and the results were
inconclusive as the saracatinib alone appeared ineffective and palbociclib flatlined the tumors.
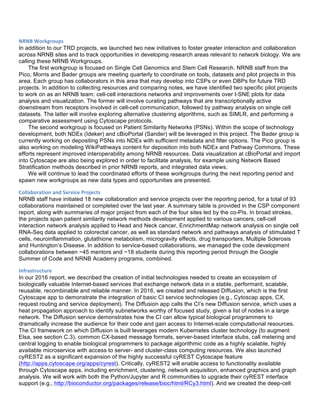
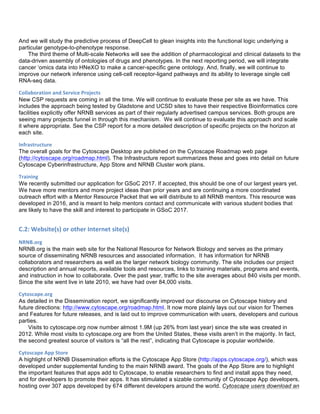
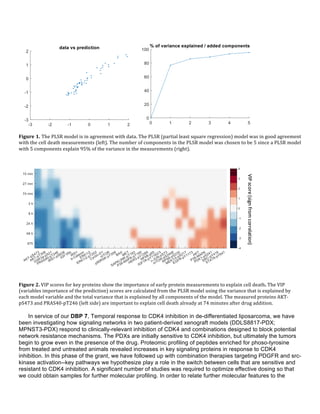
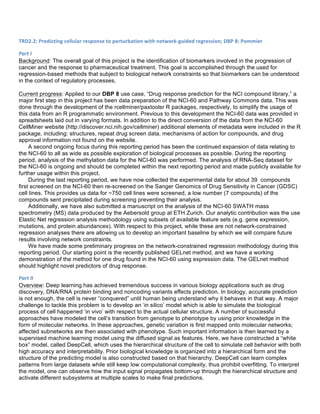
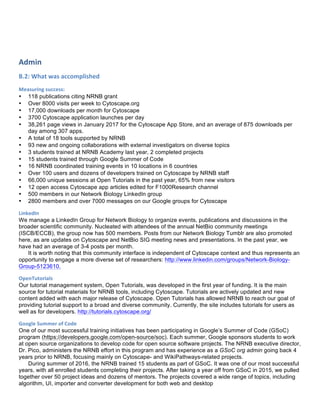
The sunitinib and palbociclib combination was tested in MPNST3-PDX. This PDX showed a strong
increase in phospho-PDGFR-alpha during treatment with palbociclib. For this study we utilized 150 mg/kg
PD991 with 40 mg/kg and 60 mg/kg sunitinib (singles, in combination, and a vehicle control). All groups had 5
animals. Sunitinib was very effective with or without palbociclib. At certain time points, it appeared that there
might be synergy between palbociclib and sunitinib. However, the addition of a slight amount of sunitinib (from
40 to 60 mg/kg) seemed to decrease tumor burden more effectively than 150 mg/kg palbociclib (see Figure 1).
As the tumor burden is very high with control and singly-treated MPNST3-PDXs, we were unable to harvest
tumors at the same time and simultaneously evaluate how the tumors respond after extended periods with the
drug. In order to gain time-matched material for further molecular analysis, we performed an additional
combination study with lower doses of sunitinib. Tumor material was harvested and analysis of this material is
ongoing.
In addition to performing several additional xenograft studies, we have also begun to profile the genomic
and transcriptomic baseline of this tumor material. We have now performed deep DNA sequencing using the
targeted sequencing IMPACT assay. We have also performed RNA sequencing on the tumor material.
Analysis is ongoing.
TRD
1.2:
Protein
network
alignment
algorithm
and
viewer;
DBP
2:
Vidal
and
Hill
TRD1, Differential networks Aim 2. We continue to develop protein-protein interaction network alignment
algorithms since publishing “GreedyPlus: An Algorithm for the Alignment of Interface Interaction Networks” in
2015 [1], the first such algorithm for protein interaction networks that includes binding site information. We
have studied protein domain and binding site evolution from a range of organisms with fully sequenced
genomes and have identified many different patterns of sequence evolution that change network architecture
at the local protein level – more so than expected. We hypothesized that we could identify a few major
sequence evolution patterns, but most examples we studied were unique. This work has led us to design a
new technology for ortholog function assessment that simultaneously considers protein and network evolution,
described in B.6. TRD1.2.
To support DBP 2 (Vidal and Hill) “Mapping the human interactome and its rewiring by disease mutations”,
we have engaged in weekly discussions with the Vidal team to consult on the analysis of their ongoing human
interactome project, in particular where their work includes differential network analysis and consideration of
binding sites.
References
1. Law B, Bader GD. GreedyPlus: An Algorithm for the Alignment of Interface Interaction Networks. Scientific
Reports. 2015;5:12074.
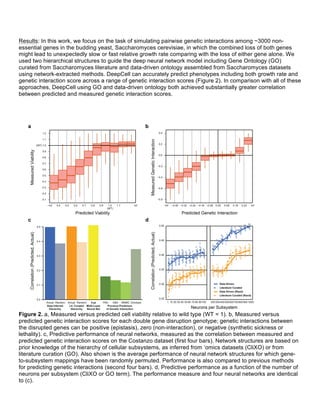
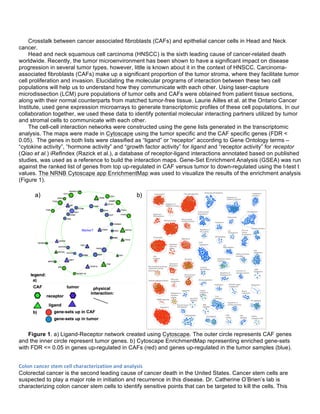
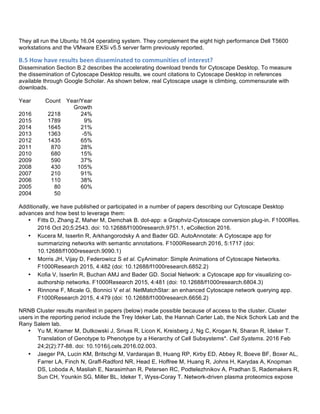
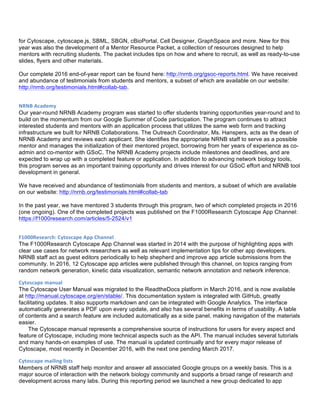
TRD 1.3: Facilitating the interpretation of AP-MS data as interaction networks; DBP 1: Krogan
Mass spectrometry practitioners and analysts routinely work with network models constructed from
fundamental interaction measurements. The data inform the biomedical understanding of host-pathogen
interactions, signaling networks and network rewiring in cancer, to name a few examples. This is a critical field
of research with which to provide powerful and accessible network visualization and analysis technology. This
project component is aimed at making specific improvements and implementing new features to Cytoscape to
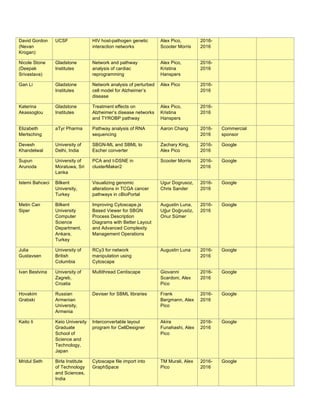
enhance its applicability and adoption by mass spec community. The main objectives are to augment](https://image.slidesharecdn.com/wrap-upreport-190604173012/85/NRNB-Annual-Report-2017-11-320.jpg)
![Cytoscape to streamline the typical mass spec analysis pipeline and provide better access to public mass spec
data and annotation repositories relevant to researchers.
Following the guideline of our (lengthy) Nature Protocol for mass spec analysis using Cytoscape [1], we
made significant progress on streamlining and enhancing the protocol. First, in terms of identifier mapping, we
took a multistep process involving the installation and configuration of a separate app and replaced it with a
built-in context menu option added to the existing Node Table in Cytoscape. Identifier mapping, in brief,
addresses the matter of mapping between identifier systems (e.g., UniProt, Entrez Gene, Ensembl, etc) when
merging interaction data or integrating data types. This is a common problem faced by all bioinformaticians. In
the specific domain of network data in Cytoscape, we see the opportunity to provide semi-automated
assistance for users wanting to merge and integrate heterogeneous data. This is particularly relevant to mass
spec practitioners, e.g., those in the Krogan lab (DBP 1), who want to view their interaction data in the context
of other public interaction data and other annotations. The integration of identifier mapping into Cytoscape as a
built-in feature greatly enhances the user experience for mass spec practitioners as well as many other users.
See the before/after comparison of the steps required in the published mass spec Nature Protocol.
The simplification goes beyond app integration and user interface work. For example, rather than requiring
the user to explicitly connect to a database source, the new tool automatically connects to existing web service
provided by BridgeDb. And rather than requiring the user to explicitly choose a source identifier type, the new
tool guesses the identifier based on the values extracted from the column indicated by the user in the right click
action that initiated the dialog. We also included better, more common, default options for target identifier type
and the force single feature based on prior experience using and training others on the original BridgeDb app.
This is a great example of a coordinated NRNB project. Despite being spread across 4 campuses, this
project involved work by members of the Ideker lab, together with the features and resources leveraged by the
BridgeDb app, which was a Google Summer of Code project mentored by the Pico lab and implemented by a
student later hired by the Sander lab [2]. In the end, members of three of the 4 NRNB sites directly contributed
to this project, while also leveraging financial support and talent recruitment from Google.
The second major activity was the continued development of the stringApp for Cytoscape by Dr. Morris.
STRING (http://www.string-db.org/) is an important public interaction database, widely regarded by mass spec
practitioners. With input from both mass spec practitioners (DBP 1) and the developers/maintainers of the
STRING database, Dr. Morris implemented the app to take full advantage of all the unique aspects of STRING,
as described in the NAR special database issue for 2017 [3]. The stringApp has been downloaded over 7400
times since its original release in December of 2015 and is freely available at the Cytoscape App Store:
http://apps.cytoscape.org/apps/stringapp.](https://image.slidesharecdn.com/wrap-upreport-190604173012/85/NRNB-Annual-Report-2017-12-320.jpg)
![TRD
2:
Descriptive
to
Predictive
Networks
B.2.
What
was
accomplished
under
these
goals?
TRD2.1:
Predicting
clinical
outcome
using
patient
similarity
networks;
DBP
5:
Friend
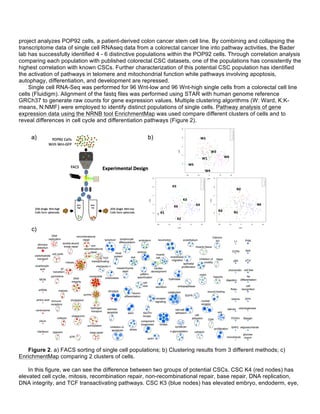
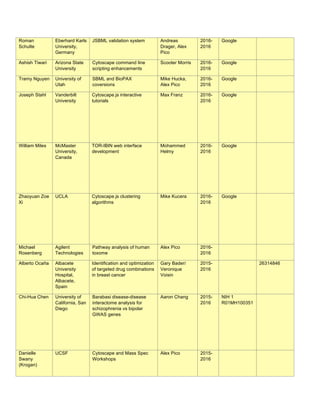
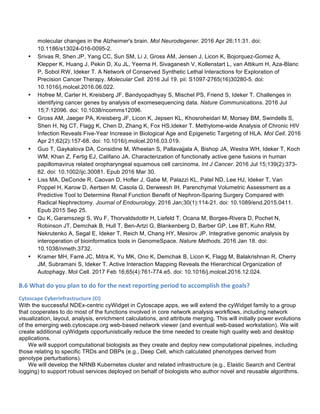
Patient classification has widespread biomedical and clinical applications, including diagnosis, prognosis,
disease subtyping and treatment response prediction. A general purpose and clinically relevant prediction
algorithm should be accurate, generalizable, be able to integrate diverse data types (e.g. clinical, genomic,
metabolomic, imaging), handle sparse data, be compatible with patient privacy protection systems and be
intuitive to interpret. We have recently developed netDx (http://netdx.org/), a supervised patient classification
framework based on patient similarity networks that meets the above criteria. netDx models input data as
patient networks and uses the GeneMANIA machine learning algorithm that we previously developed for
network integration and feature selection. We demonstrated the utility of netDx by integrating gene expression
and copy number variants to classify breast cancer tumour class, achieving an accuracy (~85%) similar or
better (depending on the class) than previously published methods. Further, we have been able to successfully
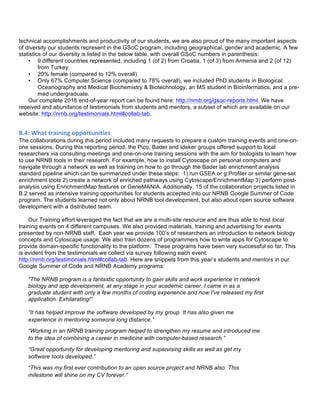
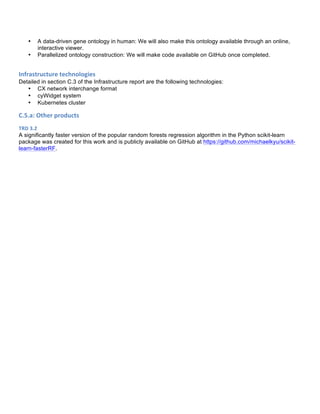
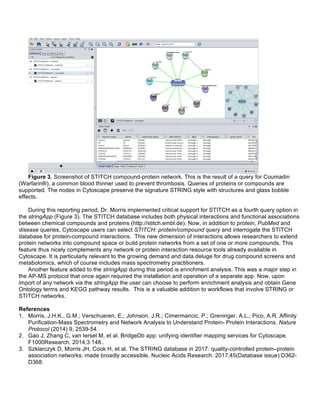
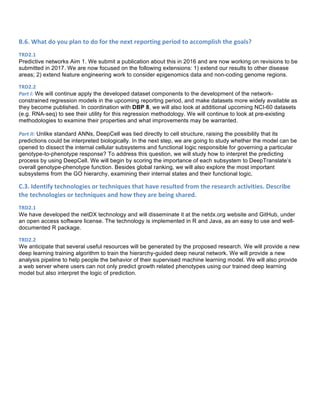
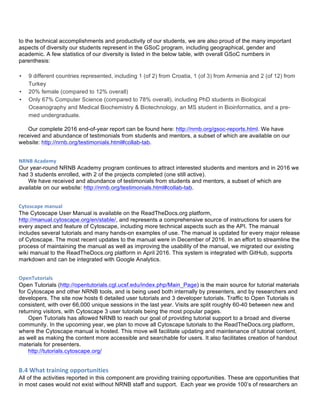
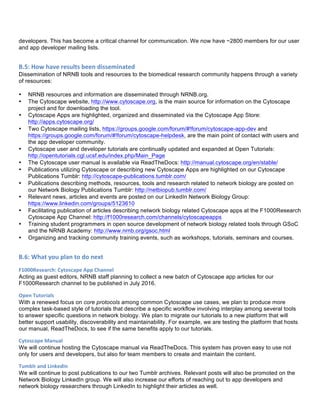
predict Autism Spectrum Disorders (ASD) phenotype from germ line DNA for a subset of ASD patients(Figure
1). netDx uses pathway features to aid biological interpretability and results can be visualized in Cytoscape as
an integrated patient similarity network to aid clinical interpretation.
Figure 1. Predictive power of netDX is better than contemporary methods: ASD case. Mean test performance
over three resamplings. Predicted status is informative beyond genetic ancestry (ANOVA chisq-test,
p=2.76x10⁻¹⁰
). GBT = pathway-level FET (cnvGSA). RFCF = Random forests (Engchuan, et al. 2015 BMC
Genomics). Reproduced from NetBio SIG presentation.
To support DBP 5: Sage Bionetworks: Molecular stratification of colorectal cancer and DREAM challenges,
we have revisited all major DREAM challenges where data are available and where the challenge experimental
design is compatible with netDX’s classification engine (two class classification). We have reported on netDx
[1] and presented on netDx at the NetBio SIG Meeting in 2016 [2].
References:
1. Shraddha Pai, Shirley Hui, Ruth Isserlin, Hussam Kaka, Gary Bader. netDx: Patient classification using
integrated patient similarity networks. bioRxiv 084418; https://doi.org/10.1101/084418
2. https://f1000research.com/slides/5-1710](https://image.slidesharecdn.com/wrap-upreport-190604173012/85/NRNB-Annual-Report-2017-16-320.jpg)
![TRD
3:
Multi-‐scale
Networks
B.2.
What
was
accomplished
under
these
goals?
TRD
3.2:
Functionalized
gene
ontologies
as
a
hierarchy
of
functional
prediction;
DBP
3:
Cherry
Development and validation of an iterative procedure for incorporating new data into a data-driven ontology. In
the last reporting period, we began developing a general progressive procedure, Active Interaction Mapping, to
guide assembly of the hierarchy of functions (ontology) encoding any biological system. Since then, we have
published this work [1] and have made the procedure available at http://atgo.ucsd.edu. In this work, we
assembled an ontology of functions comprising autophagy, a central recycling process implicated in numerous
diseases. We performed subsequent experimental validation of the ontology, including newly identified roles
for Gyp1 at the phagophore-assembly site, Atg24 in cargo engulfment, Atg26 in cytoplasm-to-vacuole
targeting, and Ssd1, Did4, and others in selective and non-selective autophagy. This work was co-authored by
our DBP 3 with Michael Cherry [1].
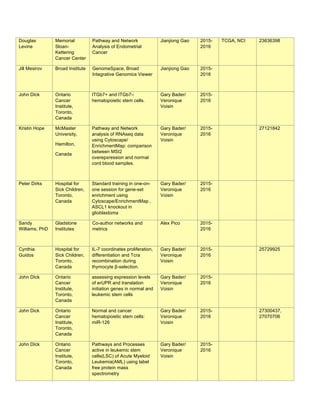
Construction of a data-driven gene ontology in human.
Whereas our previous work was focused in yeast, we have
recently constructed the first data-driven gene ontology in
human. As input to building this ontology, we took 908
experimental studies covering 98% of human coding genes.
These data were drawn from several databases, including
Gene Expression Omnibus (668 microarrays), GeneMANIA
(201 genetic/protein interaction networks), GTEx (35 co-
expression networks). Using our Active Interaction Mapping
pipeline, we integrated these datasets into a unified gene-
gene similarity network and then hierarchically clustered this
network to assemble a human gene ontology (called
HNeXO).
Parallelized, GPU-based algorithm for ontology
construction. We have been optimizing our algorithm for
constructing an ontology. Currently, it takes about a day to
assemble a data-driven gene ontology in yeast (~6000
genes) and several days for one in human (~20,000 genes).
We aim to reduce this runtime down to the span of hours by
parallelizing the computation. To do this, we have
reformulated the construction of an ontology as a series of
matrix computations, for which there are known algorithms
for massive parallelization and efficient memory caching.
Our approach fully exploits the capacity of parallelism on a
multi-CPU platform and is easily generalized to Graphics
Processing Units (GPU).
References
1. Kramer MH, Farré JC, Mitra K, et al. Active Interaction Mapping Reveals the Hierarchical Organization of
Autophagy. Mol Cell. 2017.
TRD3.3:
Bridging
ligand-‐receptor
networks
to
cell-‐cell
communication
networks;
DBP
9:
Zandstra
We have undertaken new research and development work to infer cell-cell interaction networks. In particular,
we have extensively used single cell RNA-seq data to infer higher resolution cell-cell networks and have
developed applications to cancer stem cell biology and regenerative medicine (e.g. DBP 9), both areas where
cell communication is important for tumour or normal tissue development. For single cell RNA-seq, we start by
clustering the single cells to define cell types. Clusters representing cell types are identified by the expression
of known cell type markers and previously unrecognized clusters are, by default, linked to the nearest known
cell type (e.g. neuron subtype A, B, C…) Each cell type is analyzed for the expression of surface receptors and
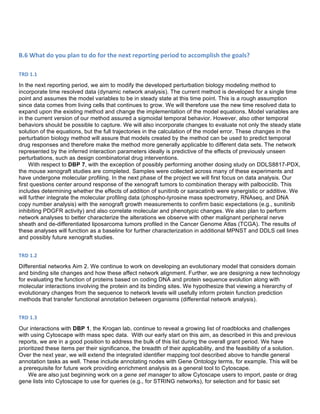
Data-driven gene ontology in human
(HNeXO). To understand how HNeXO
compares with curated knowledge in the
Gene Ontology (GO), we searched for
matching HNeXO and GO terms. HNeXO
recapitulates thousands of GO terms and
also discovers new terms that are
supported by data but have no](https://image.slidesharecdn.com/wrap-upreport-190604173012/85/NRNB-Annual-Report-2017-20-320.jpg)
![ligands to infer connections between them. These represent hypotheses about cellular communication for
experimental follow up.
To support DBP 9: Engineering blood for regenerative medicine, we are automating our cell-cell interaction
network inference pipeline. This is important as the regenerative medicine community in Toronto received a
transformation grant ($114M CAD) to expand this scientific research area. As a result, many more
developmental biology research groups are requesting cell-cell interaction network analysis. As a major
milestone, a neural developmental biology group used this method to identify three new neural development
factors (Figure 1) [1].
Figure 1. Integration of the E13/14 cortex ligand data with the transcriptome-based cortical communication
model and the combined transcriptome-cell-surface proteome communication model. Red nodes denote
ligands predicted in the transcriptome-based model that were expressed in the E13/14 cortex and also have
receptors identified by cell-surface proteomics. Nodes surrounding the yellow CP (Cortical Precursor) and CN
(Cortical Neuron) nodes represent predicted autocrine ligands for CPs and CNs, respectively. Nodes located
between the yellow CP and CN nodes are predicted paracrine ligands. Edges indicate direction of
communication. Reproduced from ref 1.
References
1. Yuzwa SA, Yang G, Borrett MJ, et al. Proneurogenic Ligands Defined by Modeling Developing Cortex
Growth Factor Communication Networks. Neuron. 2016;91(5):988-1004.
B.6.
What
do
you
plan
to
do
for
the
next
reporting
period
to
accomplish
the
goals?
TRD3.2
Data-driven ontologies of other biomedical data types, including drugs and phenotypes. Our current work
has focused on assembling and applying gene ontologies, in which we group genes based on similar functions
within the cell. Likewise, drugs can be organized into drug classes based on similar chemical structure, gene
targets, or functional effect. Moreover, clinical signs and symptoms can be organized into diseases and
disease classes. In the next reporting period, we will use available pharmacological and clinical datasets to
assemble data-driven ontologies of drugs and phenotypes.
Construction of a cancer-specific human gene ontology. One of the limitations of the Gene Ontology is that
it encompasses all species, tissues, and cell types. Context-specific knowledge is difficult to extract from GO.
In our Active Interaction Mapping work, we showed that it is possible to assemble a context-specific ontology
(yeast autophagy). In the next reporting period, we will integrate cancer ‘omics data into HNeXO to make a
cancer-specific gene ontology.
TRD3.3
We are currently working to improve our network inference using additional information on cell-cell
receptor-ligand pathways. For instance, if a pathway downstream of a receptor is active, it strengthens the](https://image.slidesharecdn.com/wrap-upreport-190604173012/85/NRNB-Annual-Report-2017-21-320.jpg)


![Community Finding with Applications on Phylogenetic Networks [Extended Abstract]](https://cdn.slidesharecdn.com/ss_thumbnails/extendedabstract-190703140727-thumbnail.jpg?width=640&height=640&fit=bounds)