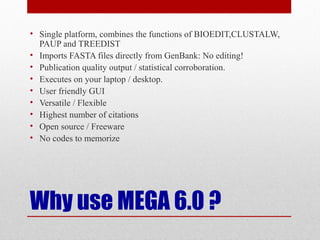
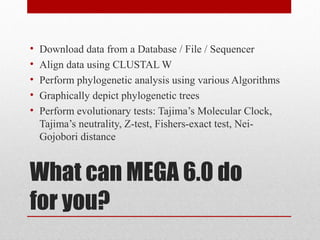
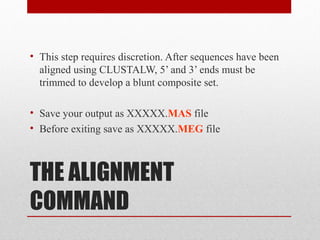
PHYLOGENETICS
An introduction to the concepts and analysis
using MEGA 6.0
Today’s Objectives
• To introduce the basis concepts involved in phylogenetic
analysis.
• To learn the usage of the phylogenetic package MEGA
6.0
• To discuss the manner in which you can apply
phylogenetic analysis in your research approach, thesis
and publications.
Why use Phylogenetics ?
• The human mind is naturally inclined to classify
information.
• Classification facilitates logical understanding as well as
the detection of heuristic patterns within data sets.
• Logical understanding of a process facilitates the process
of discovery.
Where will it be of use to
me?
• Classifying my sequence data within a global
perspective.
• Finding unique regions within my sequence data by
comparison with a global data set.
• Identification of genes which have not yet been widely
characterized.
• Infinitely many possibilities
Traditional Classification
schemes
• Based on Phenotypic traits (Phenetic) and taxonomic
classifiers (TU)
• Low level of resolution
• Not applicable to molecular data
• Difficult to resolve taxonomic ambiguities at higher
levels.
From TUs to Genomic
databases
• DNA technology prompted a quantum shift in the
resolving power of phylogenetics.
• TU: < 100 classifiers
• Amino Acids: Millions of combinations of AAs
• Genomic level: Billions of bp of nucleotide data
Does more information solve the problem?
0
100000
200000
300000
400000
500000
600000
700000
800000
900000
1000000
RESOLUTION
Taxonomic unit
Protein
Nucleic acid
Species trees
• A species tree establishes the hierarchy of a species
within a globally accepted framework of classification.
• ITS:16s
• ITS: rDNA
• ITS: chloroplast and mitochondria
• Genes: rbcL, ADH, cytC, Ig(SC)
Crab rRNA sequence data used to construct UPGMA tree, Note the out-group
species that has been added to establish a perspective scale.
Gene trees
• Gene trees facilitate the understanding of evolutionary
processes occurring within genes across taxa or within a
species.
• The rates of evolution offer insights into the manner in
which genes evolve as a family.
• Gene trees can be transformed into species trees if they
conform to evolutionary criteria.
Species v/s Gene trees
• Which one do we select?
The choice is determined by what we intend to characterize:
Is it the organism within a genus / species? OR
Is it a gene which is distributed across taxa?
Molecular taxonomy
based on genes
• Prokaryotes: 16s rDNA
• Higher organisms: ITS rDNA, Cp, Mt
• Do you want an evolutionary tree?
• Does your “molecular tree” corroborate your “taxonomic
tree”?
D. affinidisjuncta
D. heteroneura
D. mimica
D. adiastola
D. nigra
S. albovittata
D. crassifemur
S. lebanonensis
D. mulleri
D. melanogaster
D. pseudoobscura
0.000.050.100.150.200.25
Gene tree constructed using the Alcohol Dehydrogenase (ADH) gene from
Drosophila spp. (UPGMA)
The molecular clock
• A digital clock displays time as the cumulative function
of the frequency of a silicon crystal.
• A molecular clock graphically depicts evolution as the
function of changing nucleotide / amino acid
frequency versus time.
A highly simplified and idealized
molecular clock ! The red bar is a
gene, the colored bars represent
nucleotide positions which change as
a function of time.
Phylogenetic trees
•Distance based methods: inclusive
•Maximum parsimony methods: assumptive
NJT
• Constructed Purely on the basis of pairwise genetic
distance.
• No prior assumptions are made pertaining to tree
topology and branch lengths
Japanese
Korean
Southern Chinese
Australian
Papuan
North Amerind
South Amerind
Finn
Italian
German
English
San
Bantu
Pygmy
Nigerian
0.01
Neighbor Joining Tree (NJT) based on human genetic distance matrix:
compares Pairwise Genetic Distances only
UPGMA
• Originally developed for Phenogram construction (Sokal &
Michener, 1958)
• Adapted for Dendrogram construction
• Can be used when there is a correlation between the distance
measure used and the evolutionary timescale.
Japanese
Korean
Southern Chinese
North Amerind
South Amerind
Italian
Finn
German
English
Australian
Papuan
San
Pygmy
Nigerian
Bantu
0.000.010.020.030.040.05
UPGMA tree based on human genetic distance matrix:
Assumes a constant rate molecular clock
VALIDATION:
Bootstrapping
• The concept of parsimony.
• This is a re-sampling method by replacement with the
same data matrix.
• It allows calculation of standard deviations and variances.
Zea
Oryza
Nicotiana
Pinus
Marchantia
Odontella
Porphyra
Synechocys
Cyanophora
Euglena
100
91
100
100
100
100
100
0.05
Bootstrap consensus tree constructed using the NJT algorithm.
Based on chloroplast DNA protein coding regions.
Zea
Oryza
Nicotiana
Marchantia
Pinus
Odontella
Synechocys
Porphyra
Cyanophora
Euglena
100
100
100
100
100
100
100
0.000.050.100.150.20
Bootstrap consensus tree constructed using the UPGMA algorithm
Based on Chloroplast DNA protein coding regions
Why use MEGA 6.0 ?
• Single platform, combines the functions of BIOEDIT,CLUSTALW,
PAUP and TREEDIST
• Imports FASTA files directly from GenBank: No editing!
• Publication quality output / statistical corroboration.
• Executes on your laptop / desktop.
• User friendly GUI
• Versatile / Flexible
• Highest number of citations
• Open source / Freeware
• No codes to memorize
What can MEGA 6.0 do
for you?
• Download data from a Database / File / Sequencer
• Align data using CLUSTAL W
• Perform phylogenetic analysis using various Algorithms
• Graphically depict phylogenetic trees
• Perform evolutionary tests: Tajima’s Molecular Clock,
Tajima’s neutrality, Z-test, Fishers-exact test, Nei-
Gojobori distance
Getting started with
MEGA
• Input file
• Processing commands
• Output file
THE INPUT FILE
• FASTA format
• ABI format
• Distance matrix files
THE ALIGNMENT
COMMAND
• This step requires discretion. After sequences have been
aligned using CLUSTALW, 5’ and 3’ ends must be
trimmed to develop a blunt composite set.
• Save your output as XXXXX.MAS file
• Before exiting save as XXXXX.MEG file
The ends of the composite sequence should be trimmed after
CLUSTALW alignment as they can contribute significantly to error
in determining true evolutionary divergence / sequence similarity
DEFINING YOUR OUTPUT
• Distance Matrix File
• Phylogenies: NJT / UPGMA / MP / ME
• Parsimony trees
• Evolutionary parameters
• Molecular clocks
Some concepts to think
about:
• Gene clusters
• Genes across geographical boundaries
• Why does genetic evolution transcend species
boundaries?
• Why do some genes evolve faster that others?
• Why do some genes evolve concurrently?
Some concepts to think
about:
• RNA families: clustering of ESTs
• Comparative genomics within a supra genome
• Evolutionary linkages within human genes
CITATION
MEGA should be cited as:
Tamura K, Dudley J, Nei M & Kumar S (2007) MEGA4: Molecular
Evolutionary Genetics Analysis (MEGA) software version 4.0.
Molecular Biology and Evolution 24:1596-1599. (Publication PDF
at http://www.kumarlab.net/publications)
BIOINFORMATICS
SESSION
Follow the instructions on the screen and obtain your tree.
If you have WIFI access to NCBI, you can develop your
own unique alignments
THANK YOU
“In the greater scheme of things, all systems tend to unity… all of
human understanding and logic is based on this underlying
principle.. and the genome is no exception… “

PHYLOGENETICS WITH MEGA

  • 1.
    PHYLOGENETICS An introduction tothe concepts and analysis using MEGA 6.0
  • 2.
    Today’s Objectives • Tointroduce the basis concepts involved in phylogenetic analysis. • To learn the usage of the phylogenetic package MEGA 6.0 • To discuss the manner in which you can apply phylogenetic analysis in your research approach, thesis and publications.
  • 3.
    Why use Phylogenetics? • The human mind is naturally inclined to classify information. • Classification facilitates logical understanding as well as the detection of heuristic patterns within data sets. • Logical understanding of a process facilitates the process of discovery.
  • 4.
    Where will itbe of use to me? • Classifying my sequence data within a global perspective. • Finding unique regions within my sequence data by comparison with a global data set. • Identification of genes which have not yet been widely characterized. • Infinitely many possibilities
  • 5.
    Traditional Classification schemes • Basedon Phenotypic traits (Phenetic) and taxonomic classifiers (TU) • Low level of resolution • Not applicable to molecular data • Difficult to resolve taxonomic ambiguities at higher levels.
  • 6.
    From TUs toGenomic databases • DNA technology prompted a quantum shift in the resolving power of phylogenetics. • TU: < 100 classifiers • Amino Acids: Millions of combinations of AAs • Genomic level: Billions of bp of nucleotide data Does more information solve the problem?
  • 7.
  • 8.
    Species trees • Aspecies tree establishes the hierarchy of a species within a globally accepted framework of classification. • ITS:16s • ITS: rDNA • ITS: chloroplast and mitochondria • Genes: rbcL, ADH, cytC, Ig(SC)
  • 9.
    Crab rRNA sequencedata used to construct UPGMA tree, Note the out-group species that has been added to establish a perspective scale.
  • 10.
    Gene trees • Genetrees facilitate the understanding of evolutionary processes occurring within genes across taxa or within a species. • The rates of evolution offer insights into the manner in which genes evolve as a family. • Gene trees can be transformed into species trees if they conform to evolutionary criteria.
  • 11.
    Species v/s Genetrees • Which one do we select? The choice is determined by what we intend to characterize: Is it the organism within a genus / species? OR Is it a gene which is distributed across taxa?
  • 12.
    Molecular taxonomy based ongenes • Prokaryotes: 16s rDNA • Higher organisms: ITS rDNA, Cp, Mt • Do you want an evolutionary tree? • Does your “molecular tree” corroborate your “taxonomic tree”?
  • 13.
    D. affinidisjuncta D. heteroneura D.mimica D. adiastola D. nigra S. albovittata D. crassifemur S. lebanonensis D. mulleri D. melanogaster D. pseudoobscura 0.000.050.100.150.200.25 Gene tree constructed using the Alcohol Dehydrogenase (ADH) gene from Drosophila spp. (UPGMA)
  • 14.
    The molecular clock •A digital clock displays time as the cumulative function of the frequency of a silicon crystal. • A molecular clock graphically depicts evolution as the function of changing nucleotide / amino acid frequency versus time.
  • 15.
    A highly simplifiedand idealized molecular clock ! The red bar is a gene, the colored bars represent nucleotide positions which change as a function of time.
  • 16.
    Phylogenetic trees •Distance basedmethods: inclusive •Maximum parsimony methods: assumptive
  • 17.
    NJT • Constructed Purelyon the basis of pairwise genetic distance. • No prior assumptions are made pertaining to tree topology and branch lengths
  • 18.
    Japanese Korean Southern Chinese Australian Papuan North Amerind SouthAmerind Finn Italian German English San Bantu Pygmy Nigerian 0.01 Neighbor Joining Tree (NJT) based on human genetic distance matrix: compares Pairwise Genetic Distances only
  • 19.
    UPGMA • Originally developedfor Phenogram construction (Sokal & Michener, 1958) • Adapted for Dendrogram construction • Can be used when there is a correlation between the distance measure used and the evolutionary timescale.
  • 20.
    Japanese Korean Southern Chinese North Amerind SouthAmerind Italian Finn German English Australian Papuan San Pygmy Nigerian Bantu 0.000.010.020.030.040.05 UPGMA tree based on human genetic distance matrix: Assumes a constant rate molecular clock
  • 21.
    VALIDATION: Bootstrapping • The conceptof parsimony. • This is a re-sampling method by replacement with the same data matrix. • It allows calculation of standard deviations and variances.
  • 22.
  • 23.
  • 24.
    Why use MEGA6.0 ? • Single platform, combines the functions of BIOEDIT,CLUSTALW, PAUP and TREEDIST • Imports FASTA files directly from GenBank: No editing! • Publication quality output / statistical corroboration. • Executes on your laptop / desktop. • User friendly GUI • Versatile / Flexible • Highest number of citations • Open source / Freeware • No codes to memorize
  • 25.
    What can MEGA6.0 do for you? • Download data from a Database / File / Sequencer • Align data using CLUSTAL W • Perform phylogenetic analysis using various Algorithms • Graphically depict phylogenetic trees • Perform evolutionary tests: Tajima’s Molecular Clock, Tajima’s neutrality, Z-test, Fishers-exact test, Nei- Gojobori distance
  • 26.
    Getting started with MEGA •Input file • Processing commands • Output file
  • 28.
    THE INPUT FILE •FASTA format • ABI format • Distance matrix files
  • 29.
    THE ALIGNMENT COMMAND • Thisstep requires discretion. After sequences have been aligned using CLUSTALW, 5’ and 3’ ends must be trimmed to develop a blunt composite set. • Save your output as XXXXX.MAS file • Before exiting save as XXXXX.MEG file
  • 31.
    The ends ofthe composite sequence should be trimmed after CLUSTALW alignment as they can contribute significantly to error in determining true evolutionary divergence / sequence similarity
  • 32.
    DEFINING YOUR OUTPUT •Distance Matrix File • Phylogenies: NJT / UPGMA / MP / ME • Parsimony trees • Evolutionary parameters • Molecular clocks
  • 34.
    Some concepts tothink about: • Gene clusters • Genes across geographical boundaries • Why does genetic evolution transcend species boundaries? • Why do some genes evolve faster that others? • Why do some genes evolve concurrently?
  • 35.
    Some concepts tothink about: • RNA families: clustering of ESTs • Comparative genomics within a supra genome • Evolutionary linkages within human genes
  • 36.
    CITATION MEGA should becited as: Tamura K, Dudley J, Nei M & Kumar S (2007) MEGA4: Molecular Evolutionary Genetics Analysis (MEGA) software version 4.0. Molecular Biology and Evolution 24:1596-1599. (Publication PDF at http://www.kumarlab.net/publications)
  • 37.
    BIOINFORMATICS SESSION Follow the instructionson the screen and obtain your tree. If you have WIFI access to NCBI, you can develop your own unique alignments
  • 38.
    THANK YOU “In thegreater scheme of things, all systems tend to unity… all of human understanding and logic is based on this underlying principle.. and the genome is no exception… “