Download as PDF, PPTX
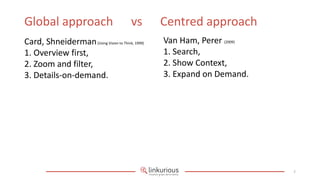
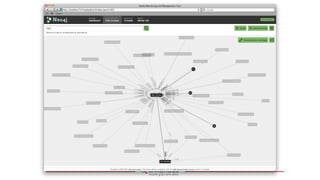
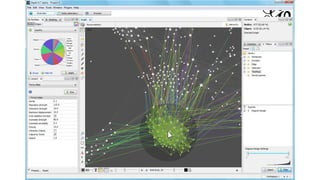
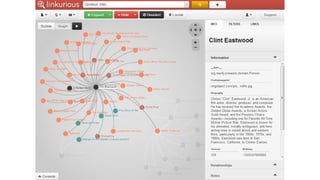
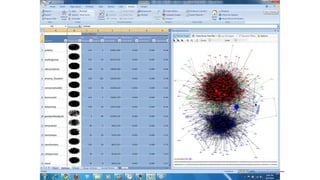
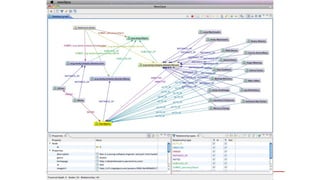
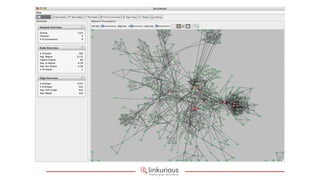
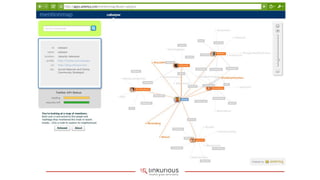
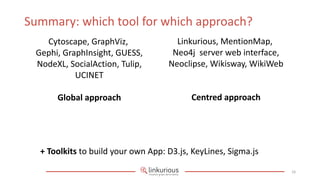
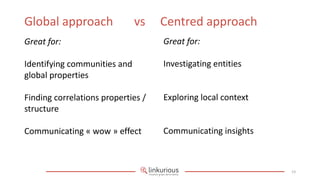
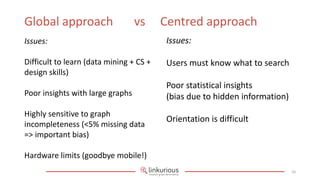
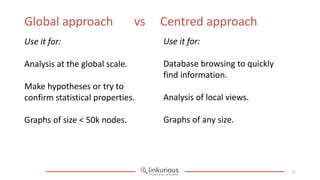
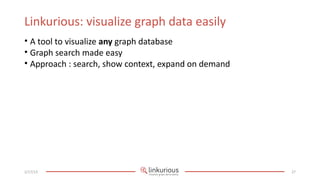
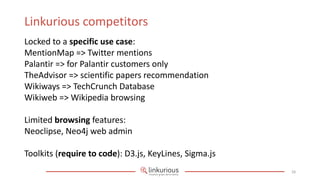


This document discusses graph visualization tools and approaches. It describes two main approaches to graph visualization - the global approach which provides an overview first before allowing zooming and filtering for details, and the centered approach which allows searching first before showing context and expanding on demand. Several graph visualization tools are described and it is noted which approach they best support. Linkurious is presented as a tool that can visualize any graph database and supports the centered approach through search, context, and expansion.