Downloaded 404 times
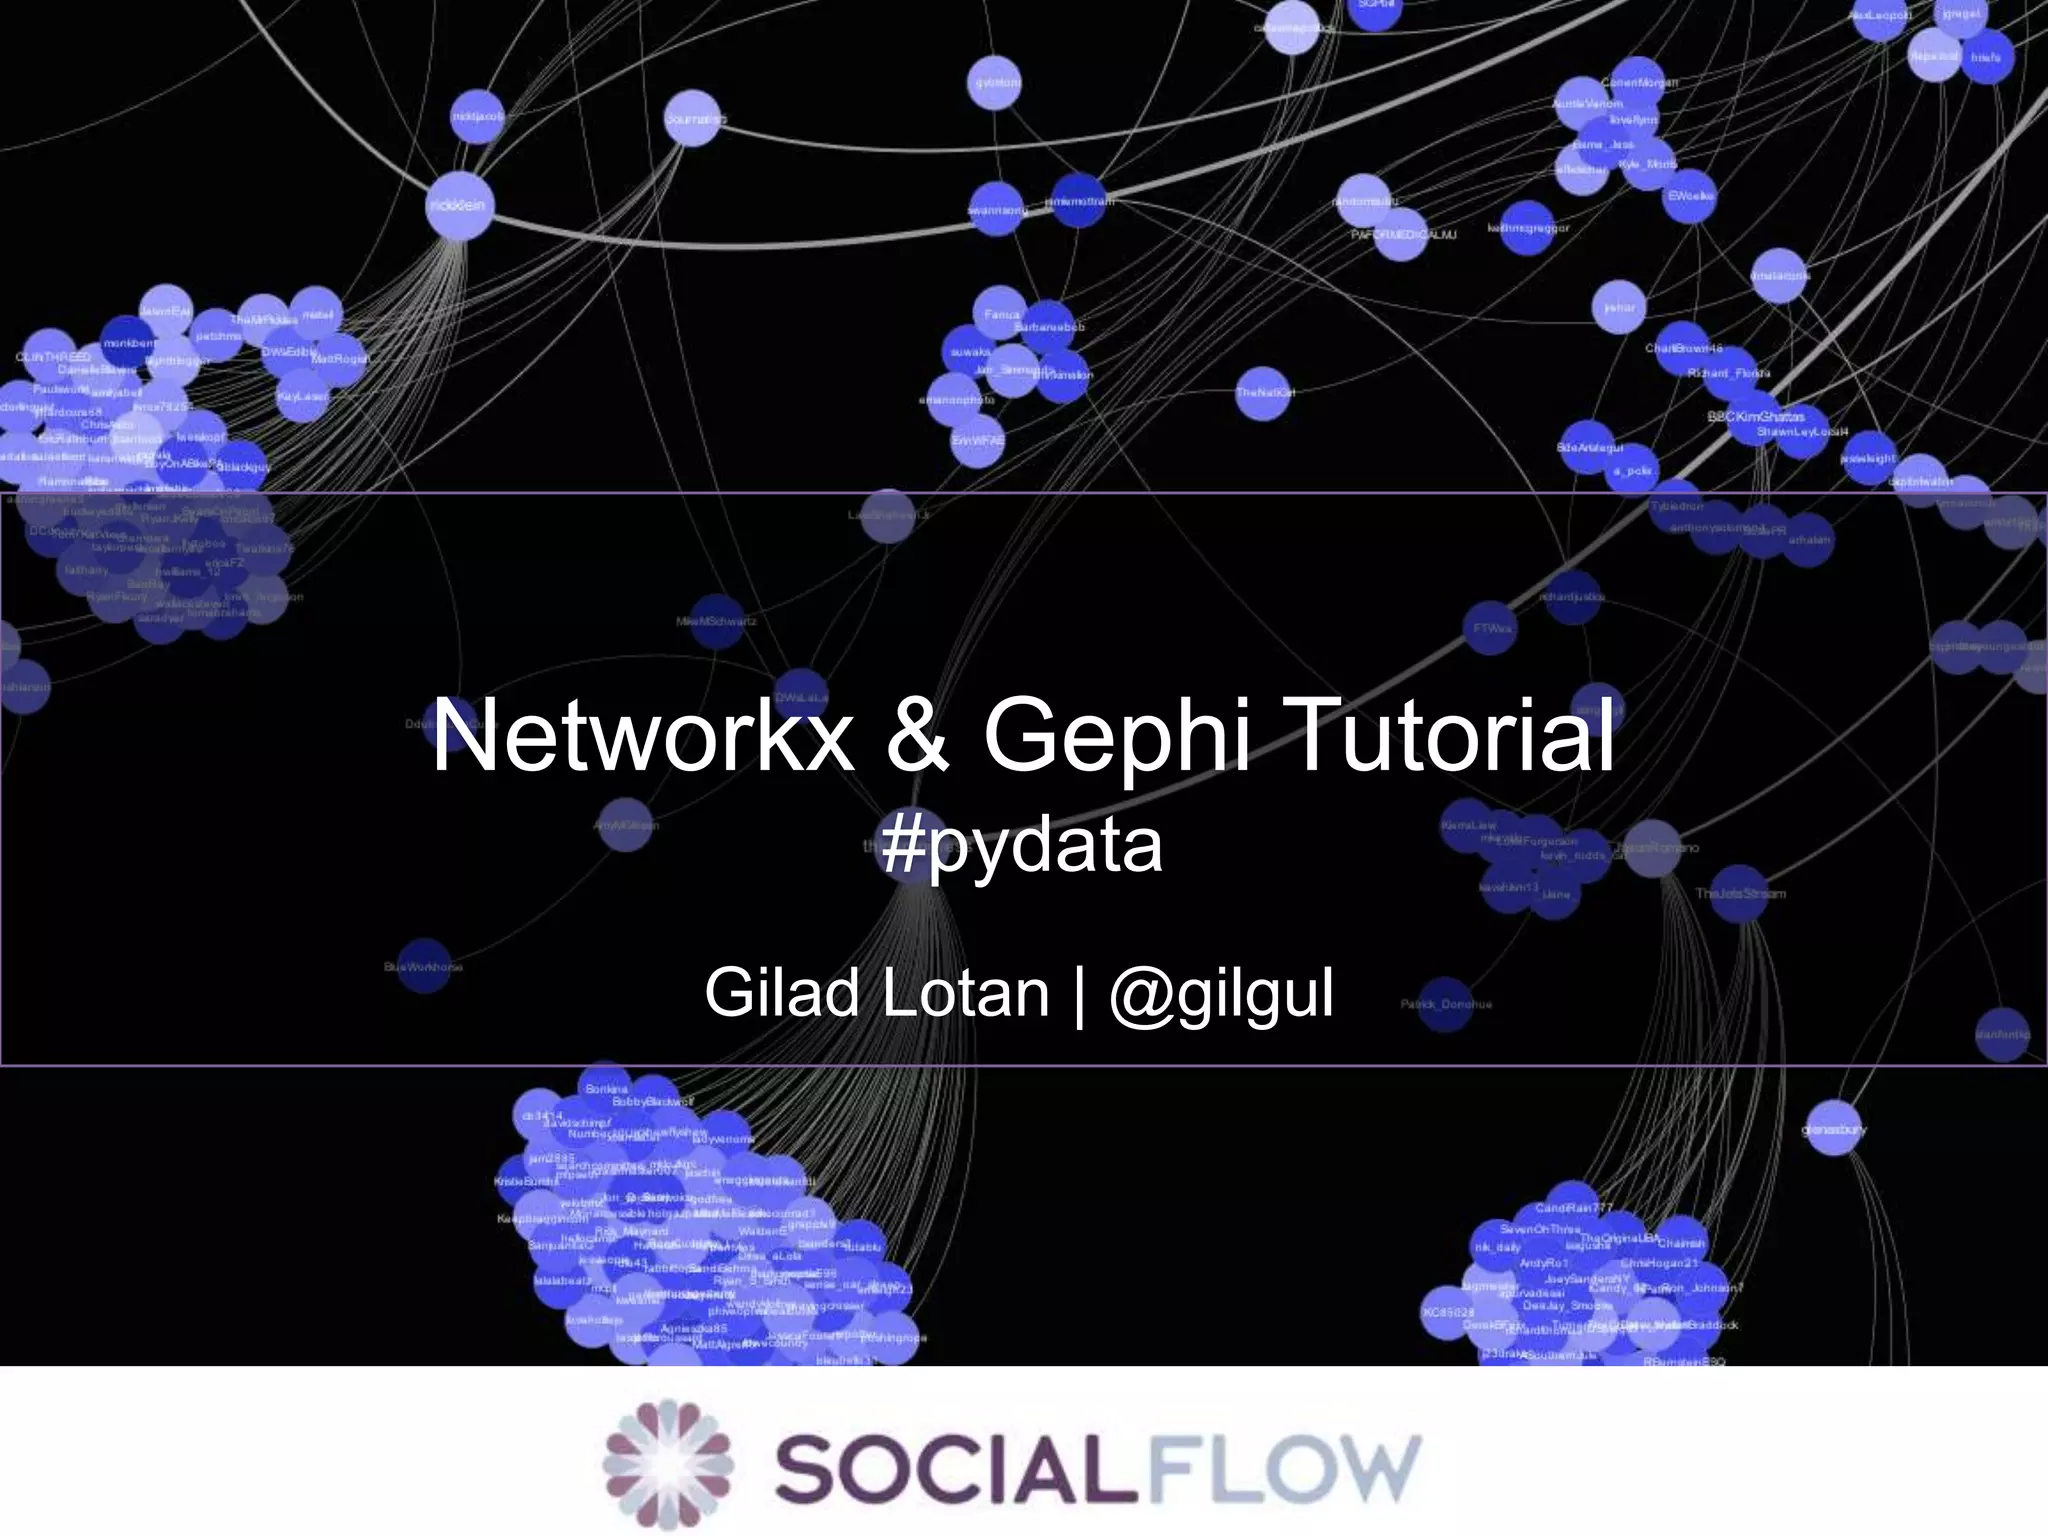
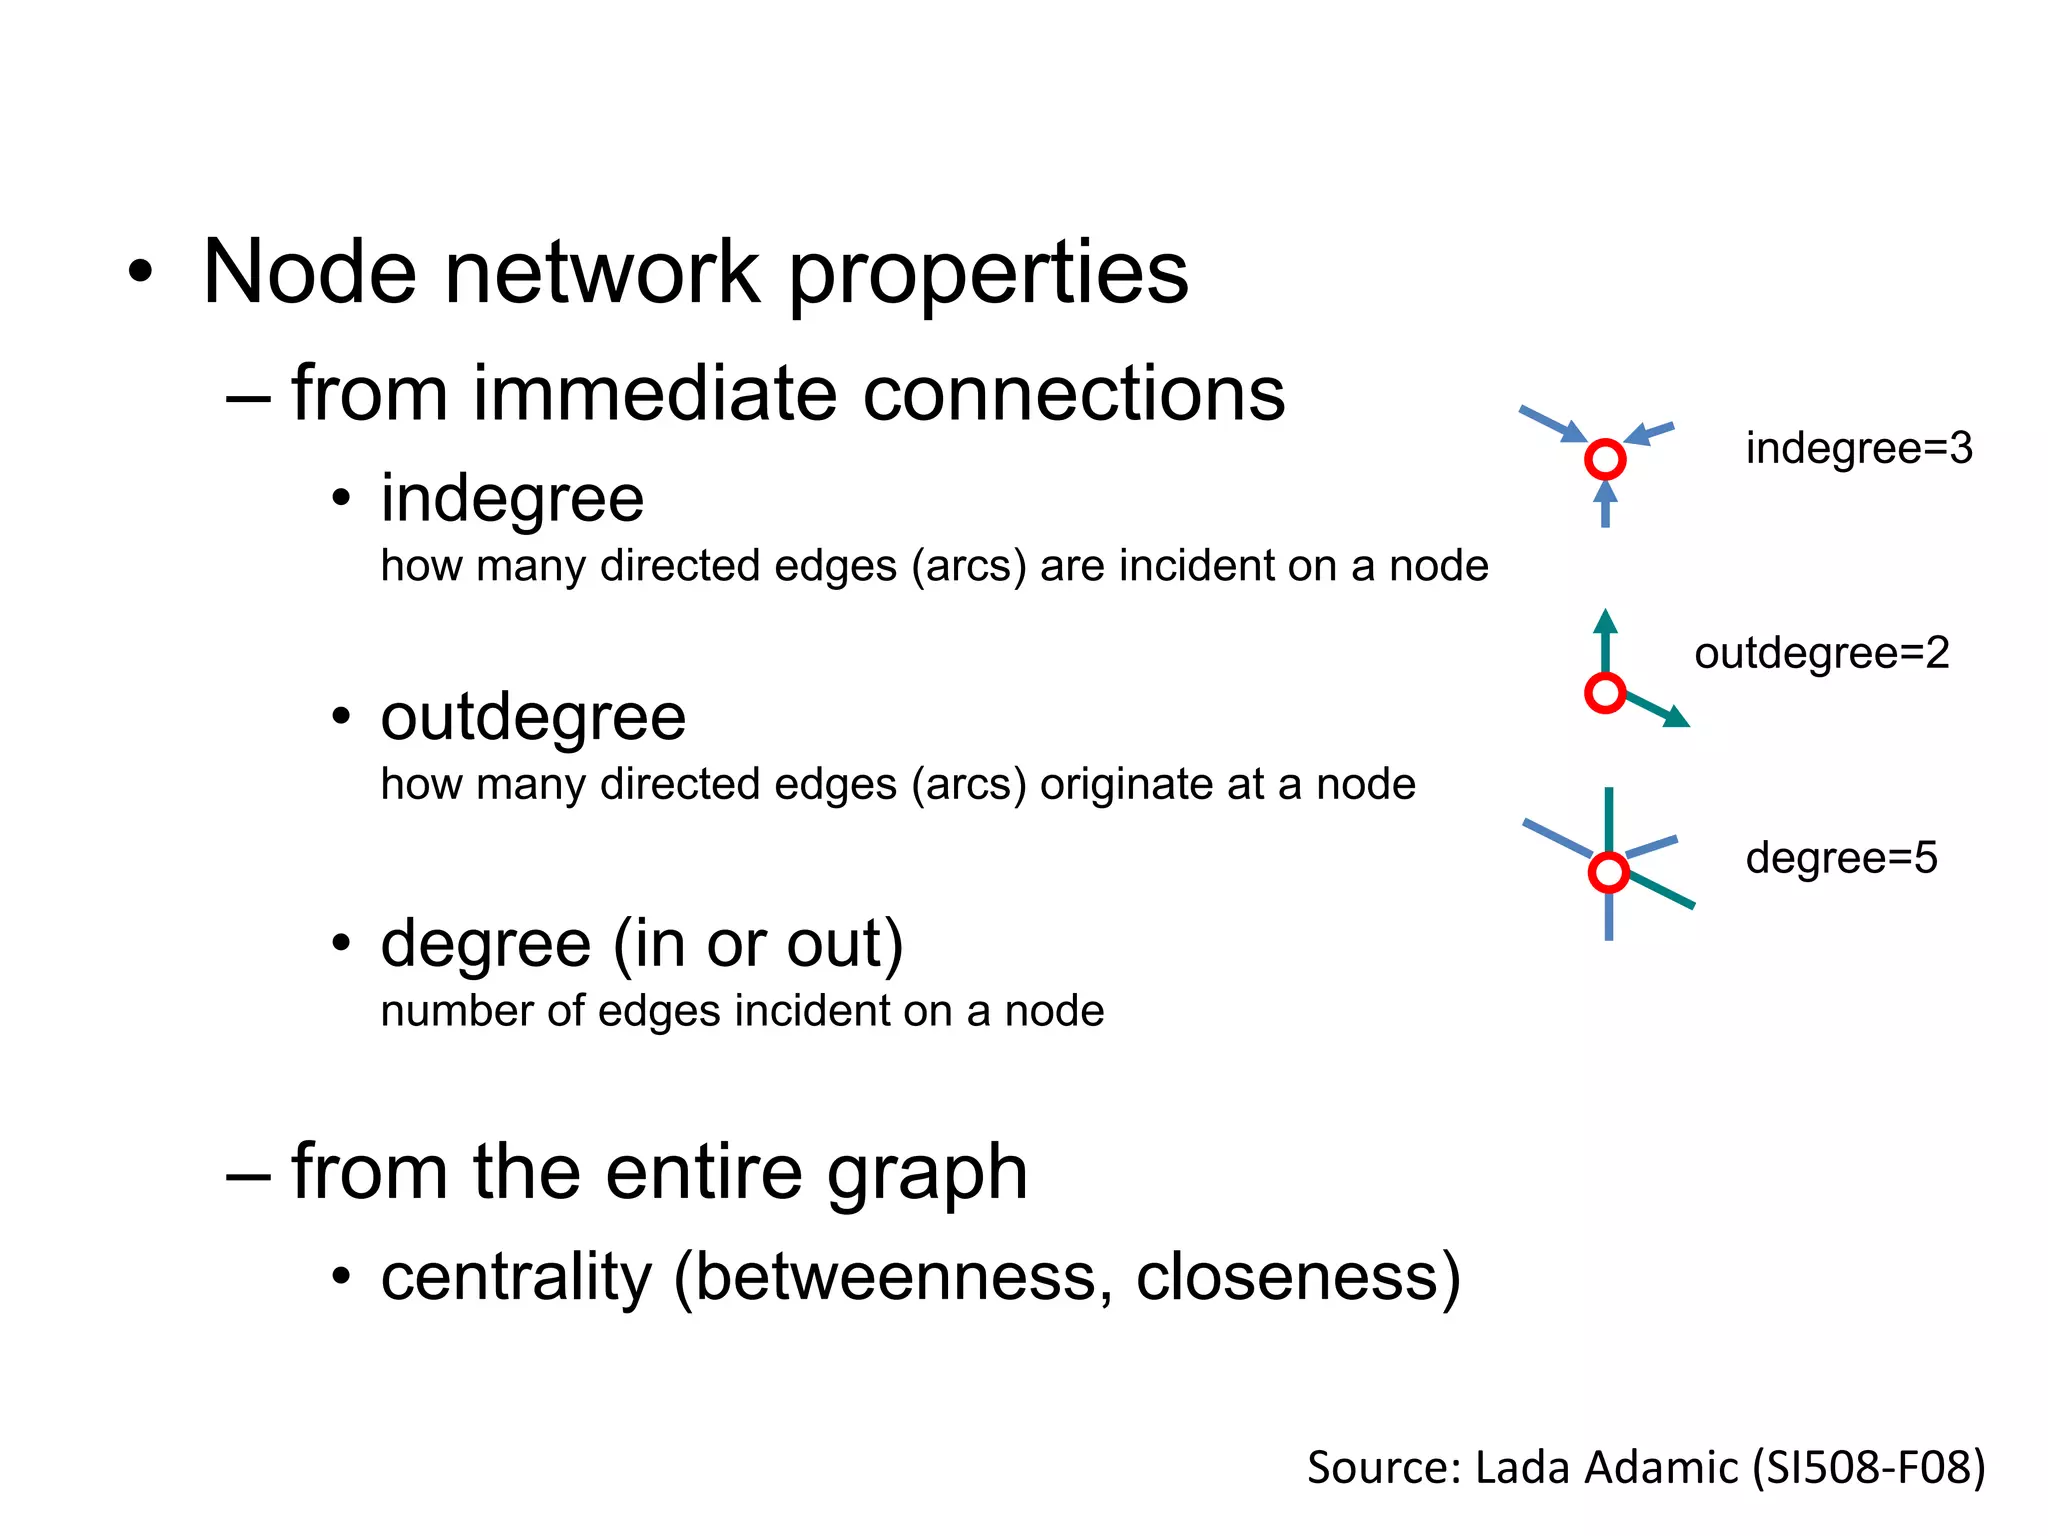
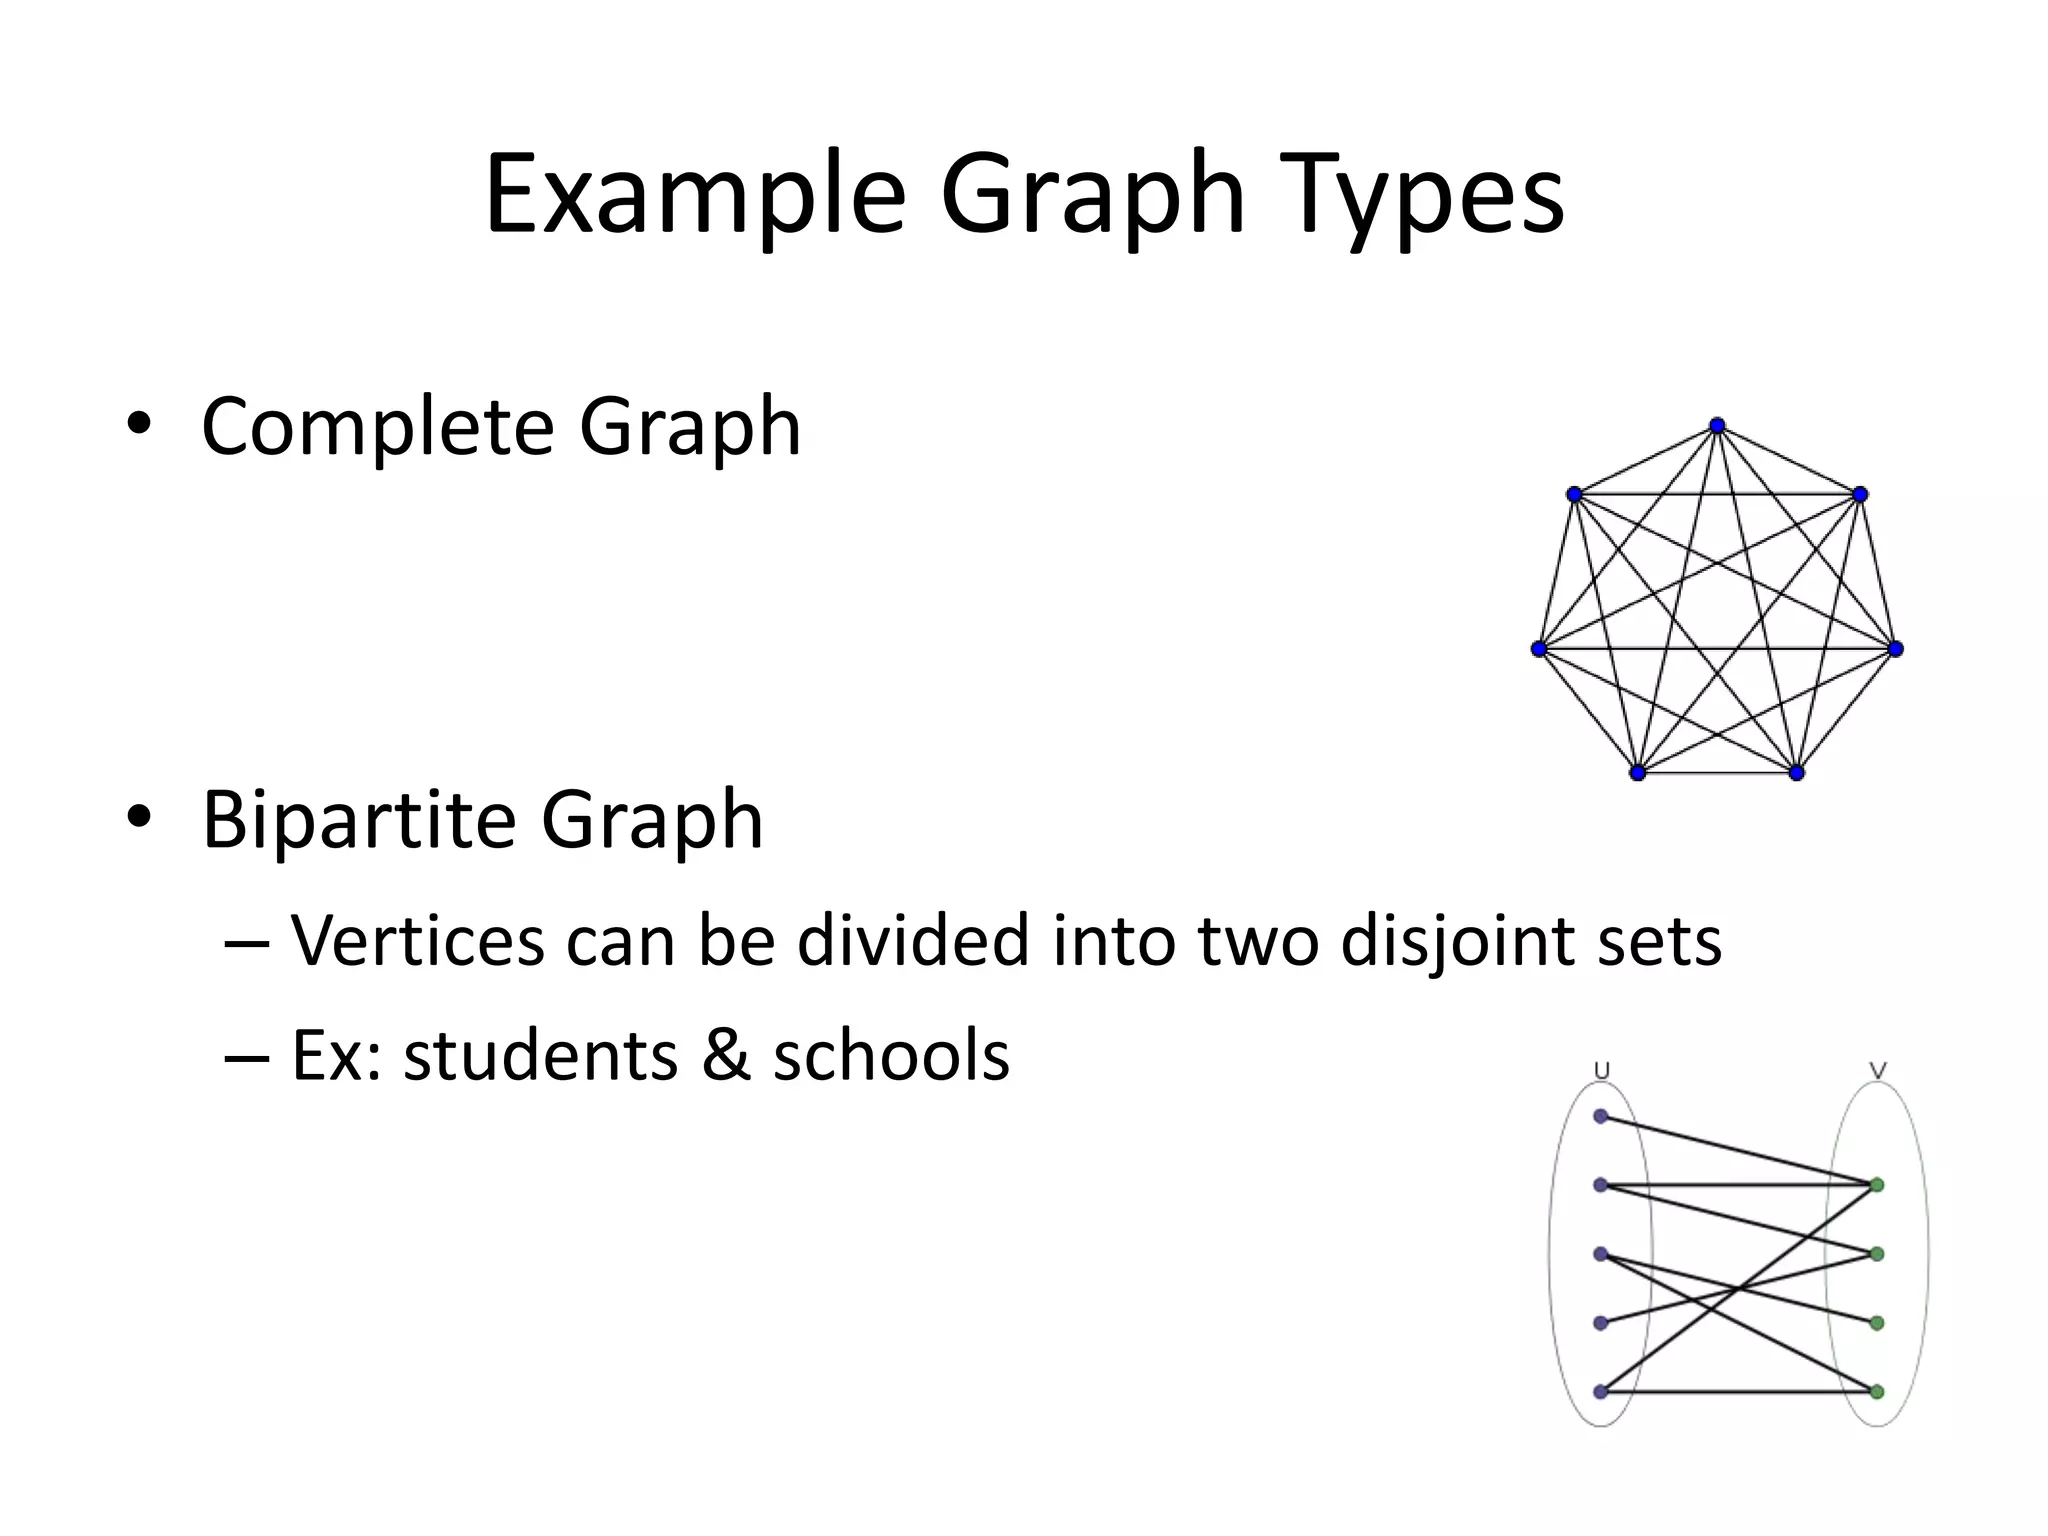
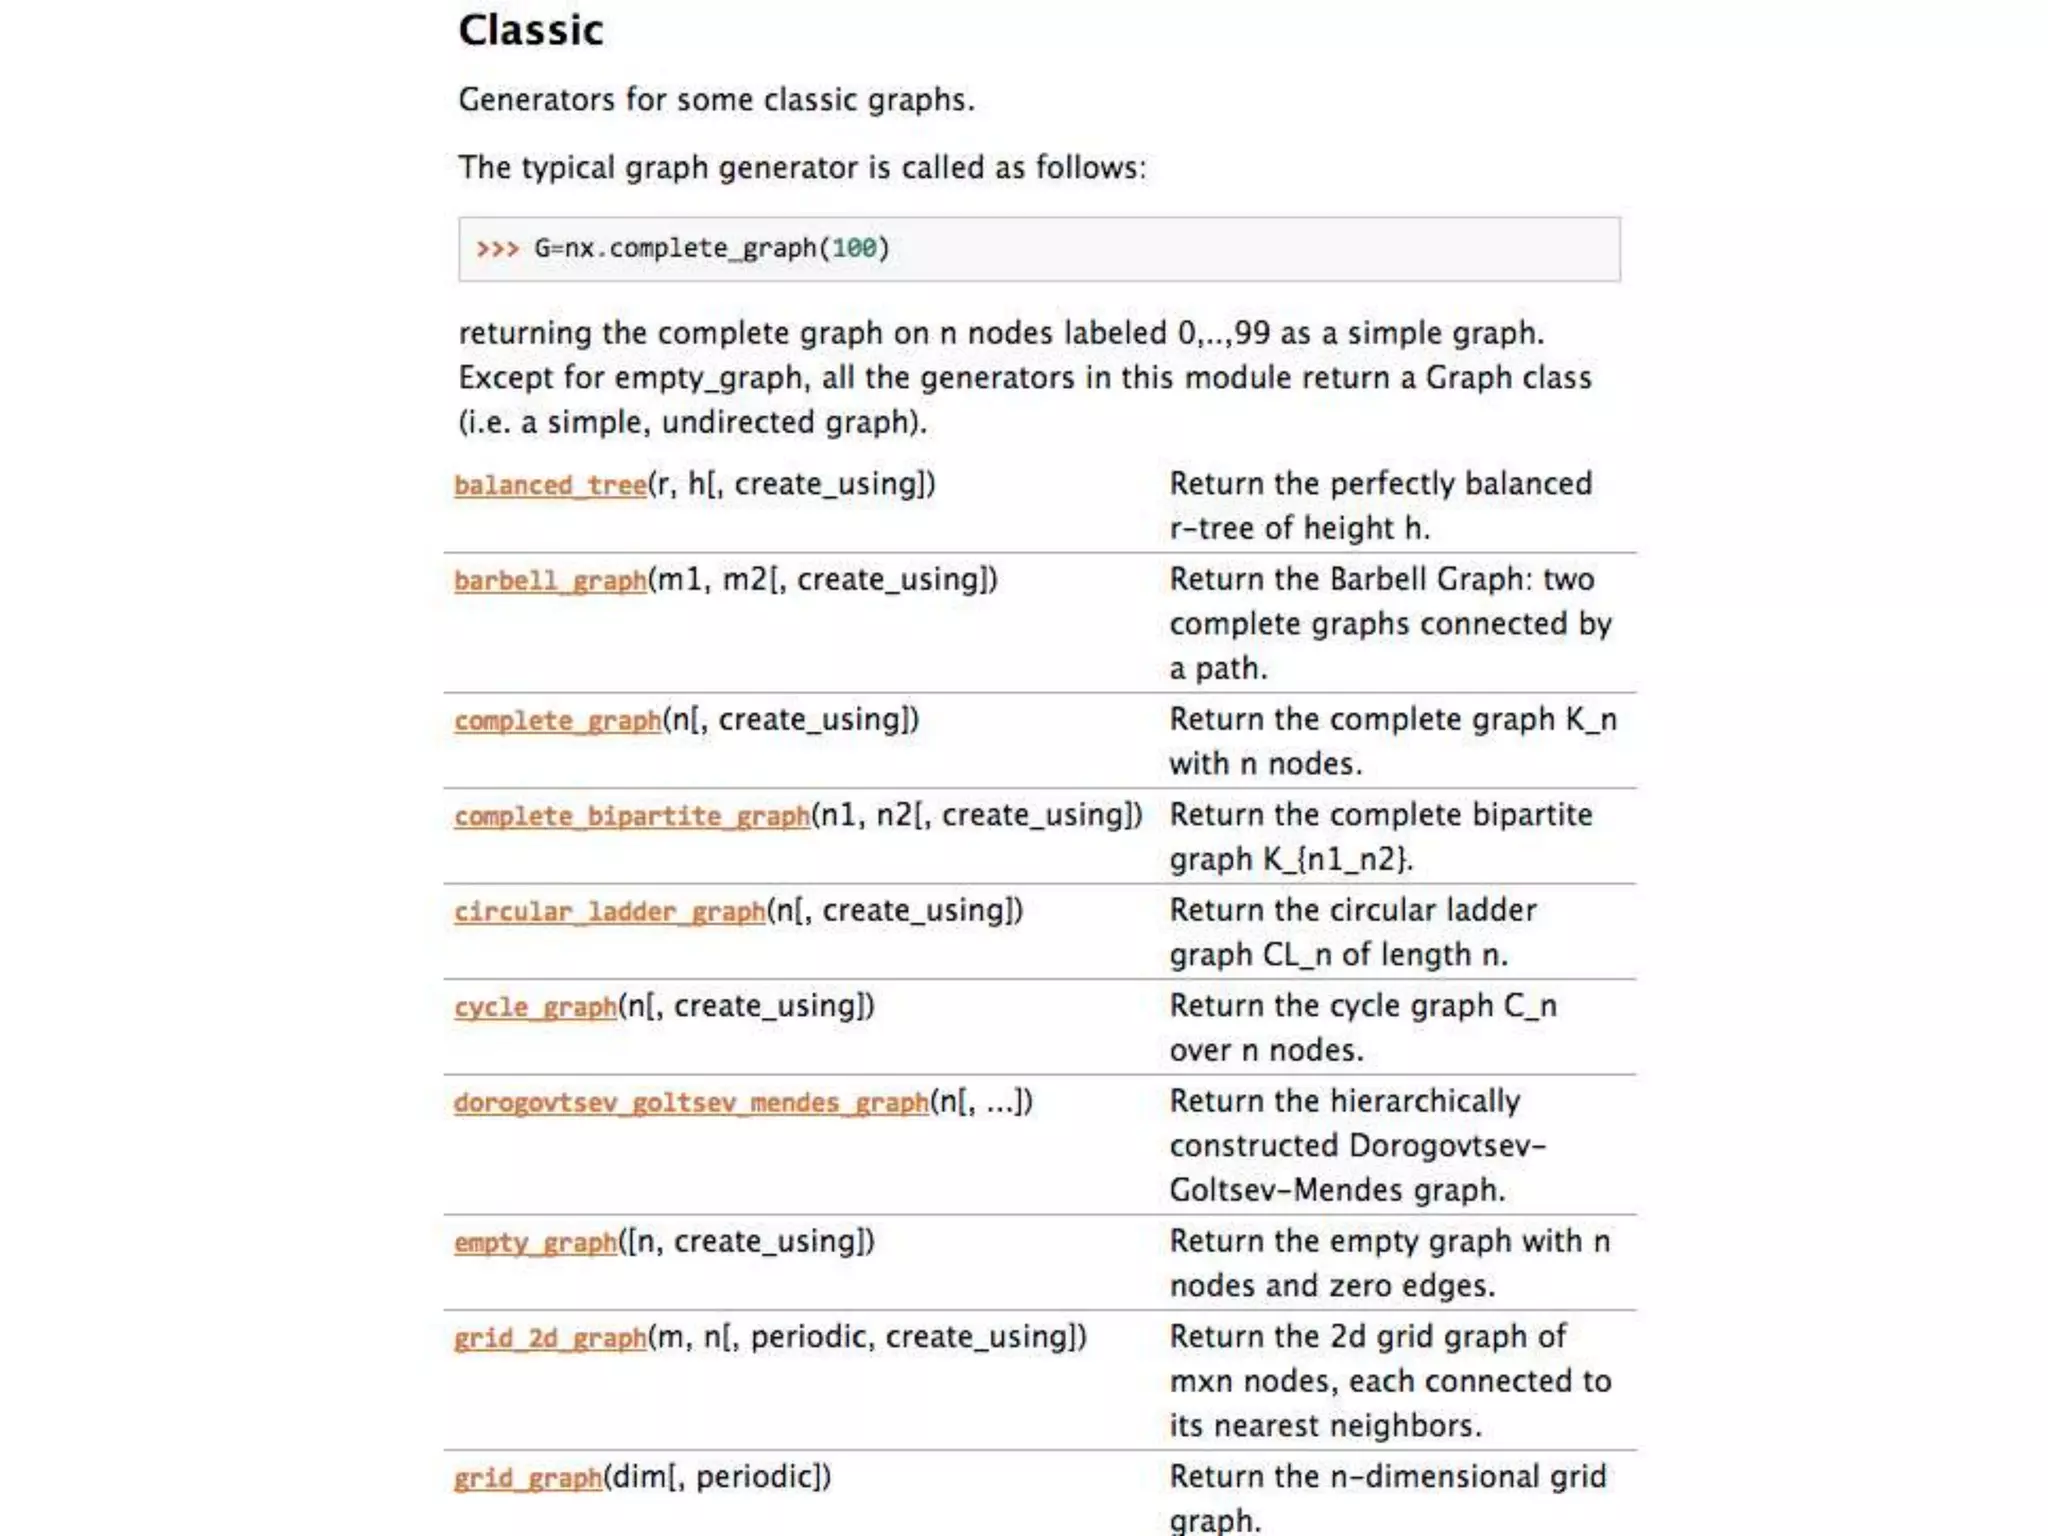
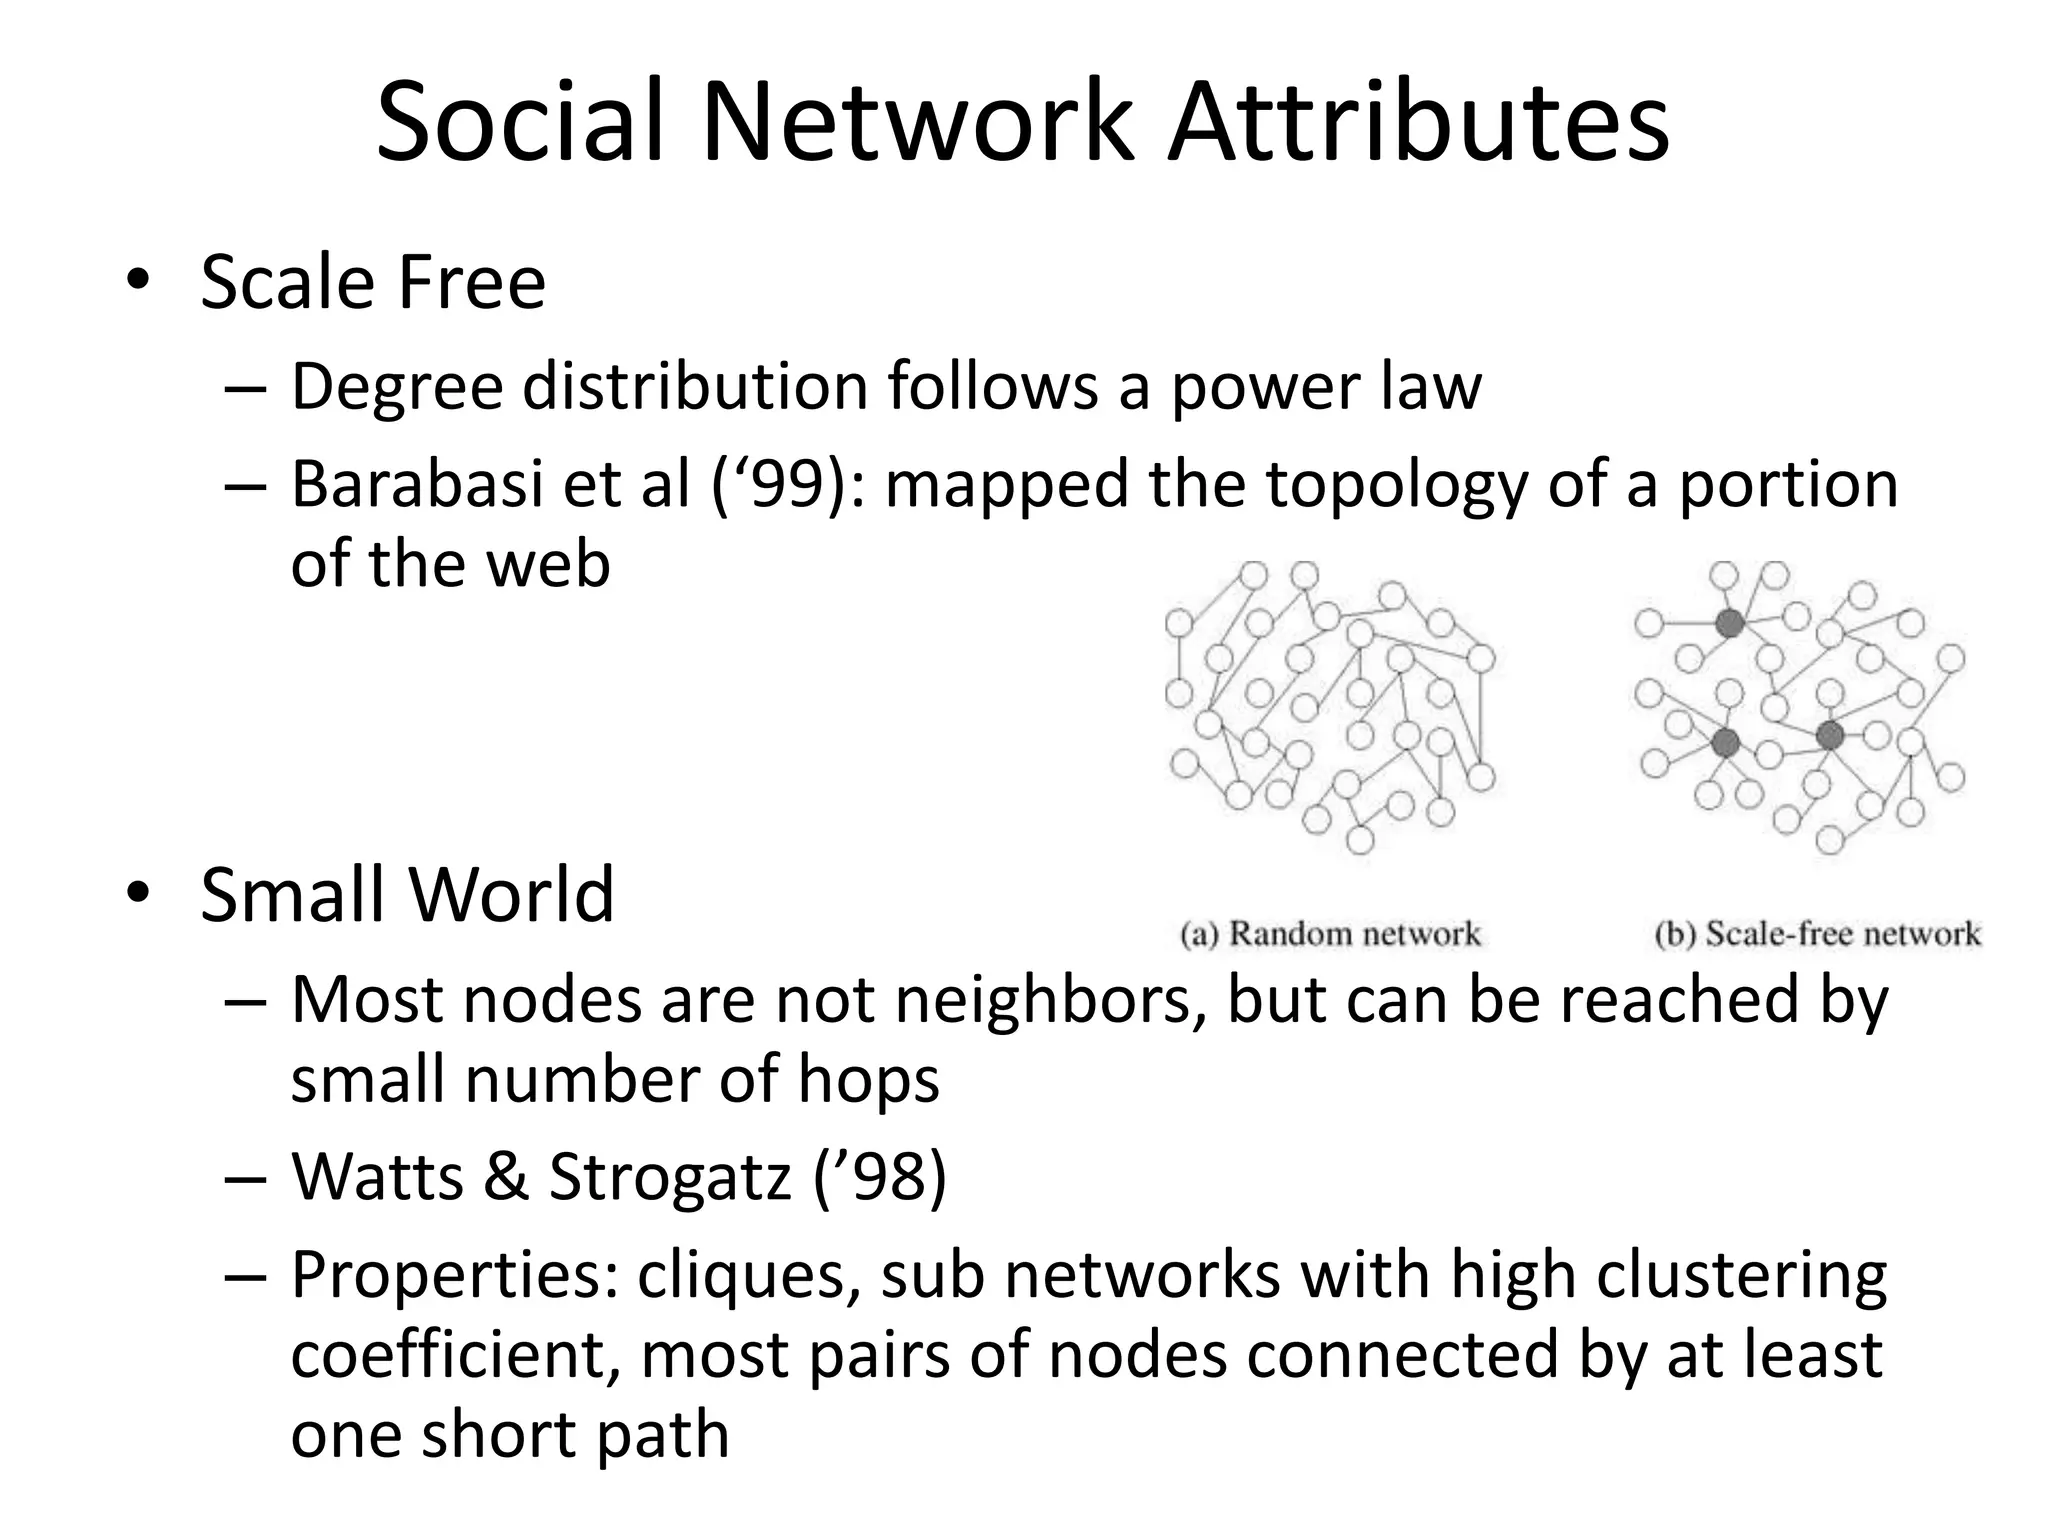
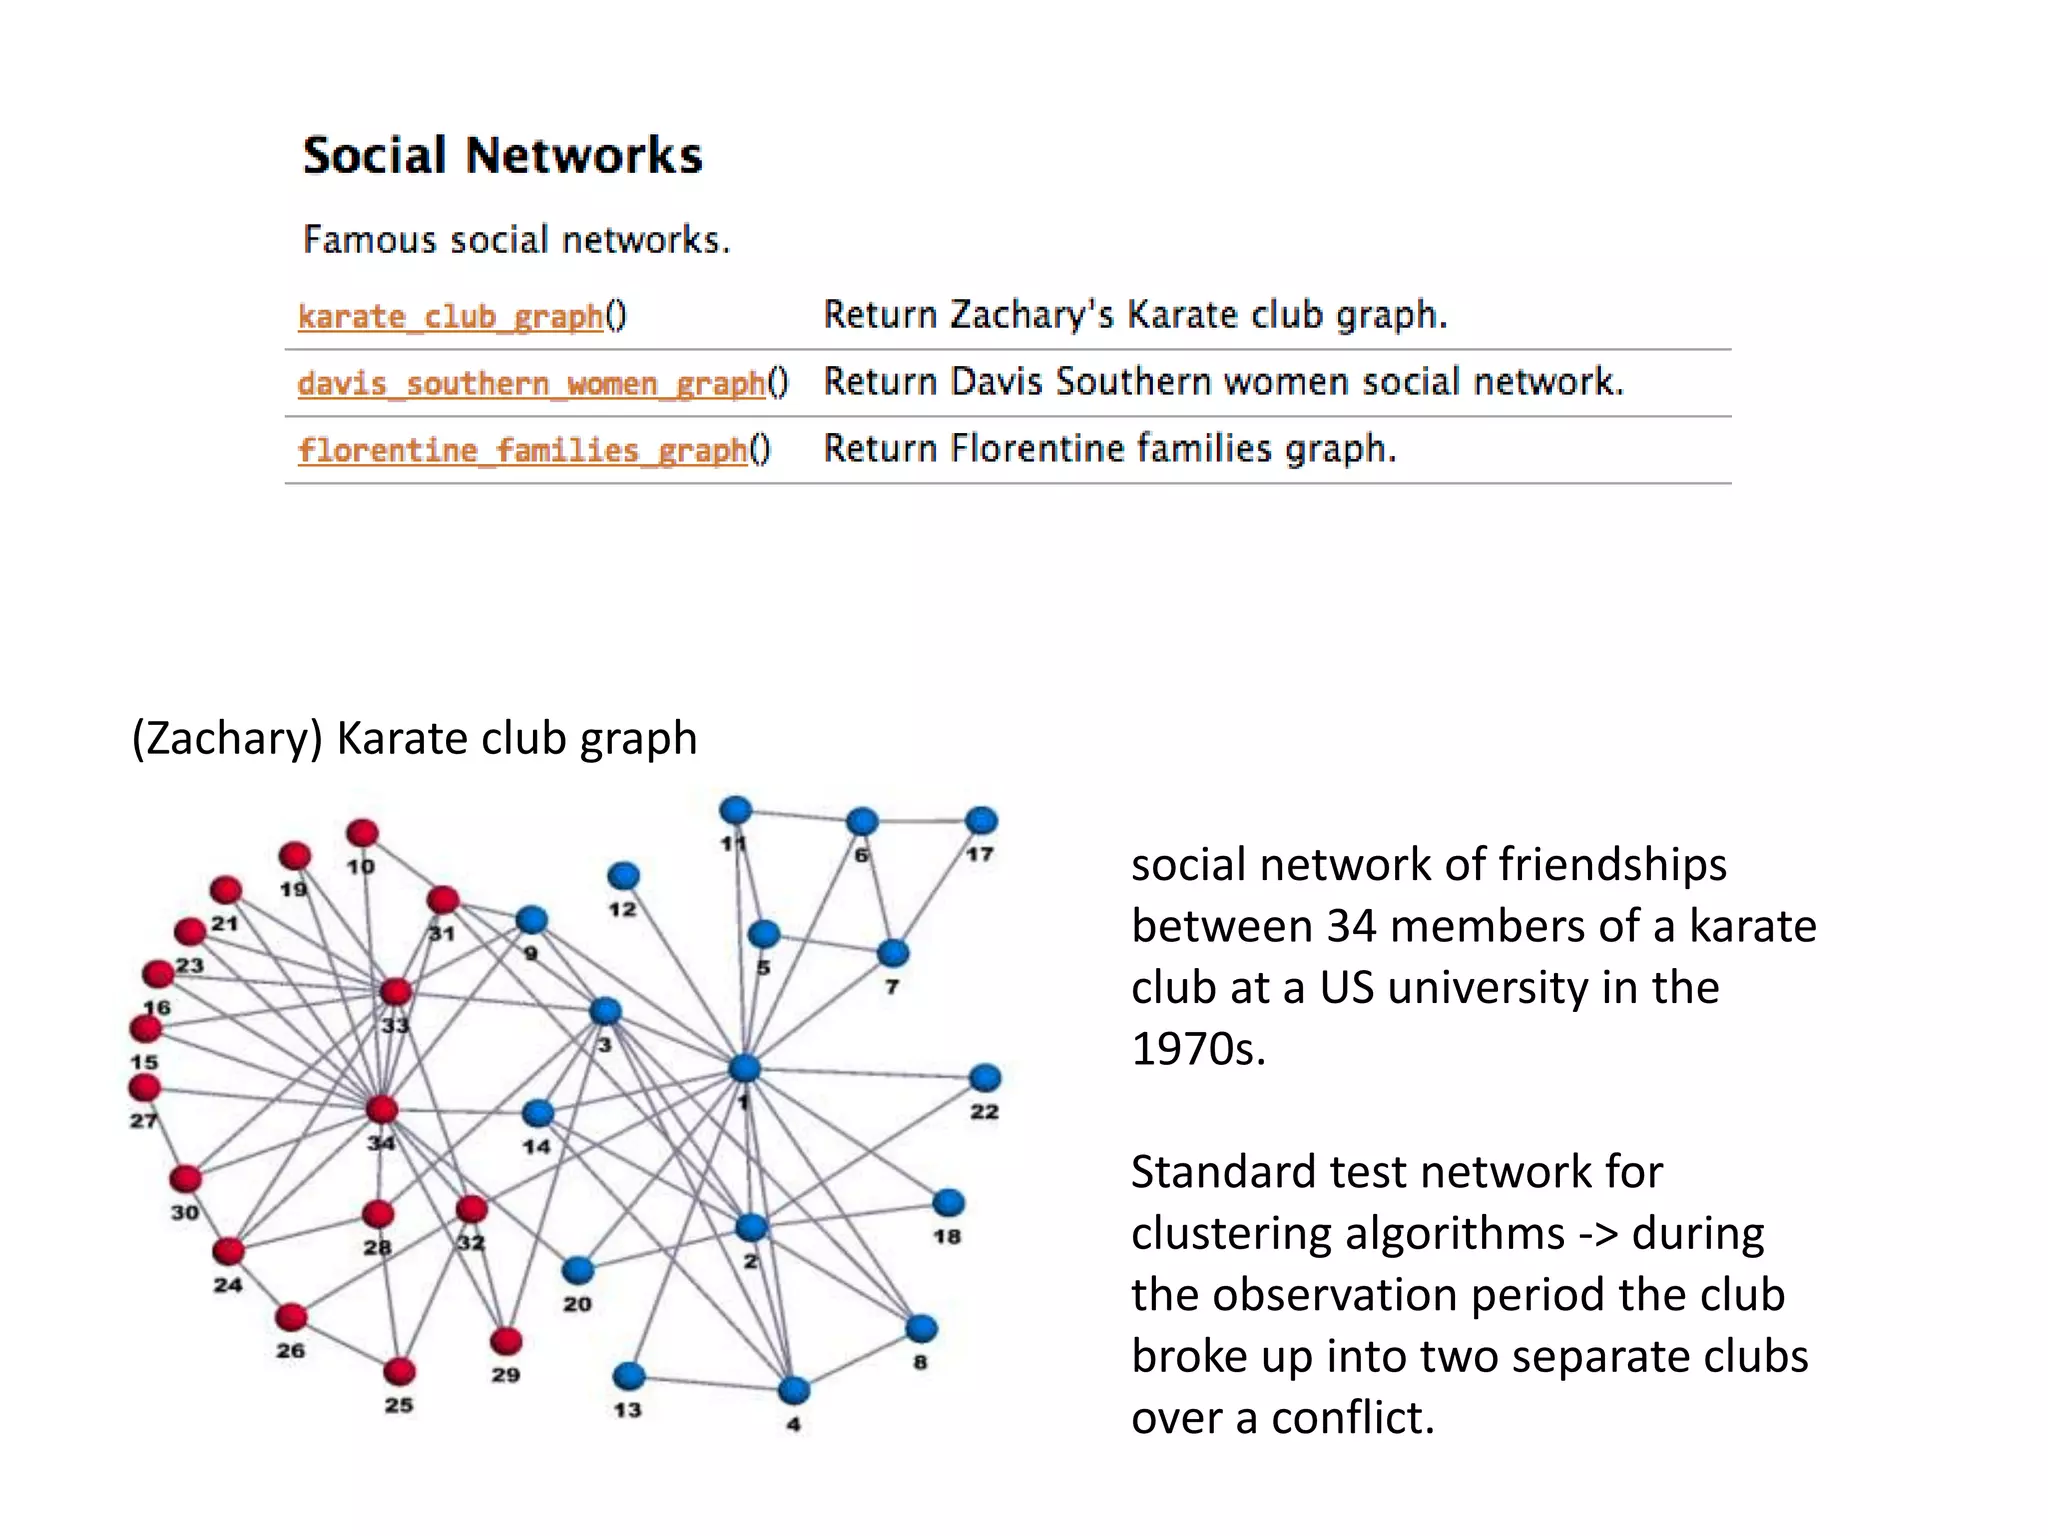
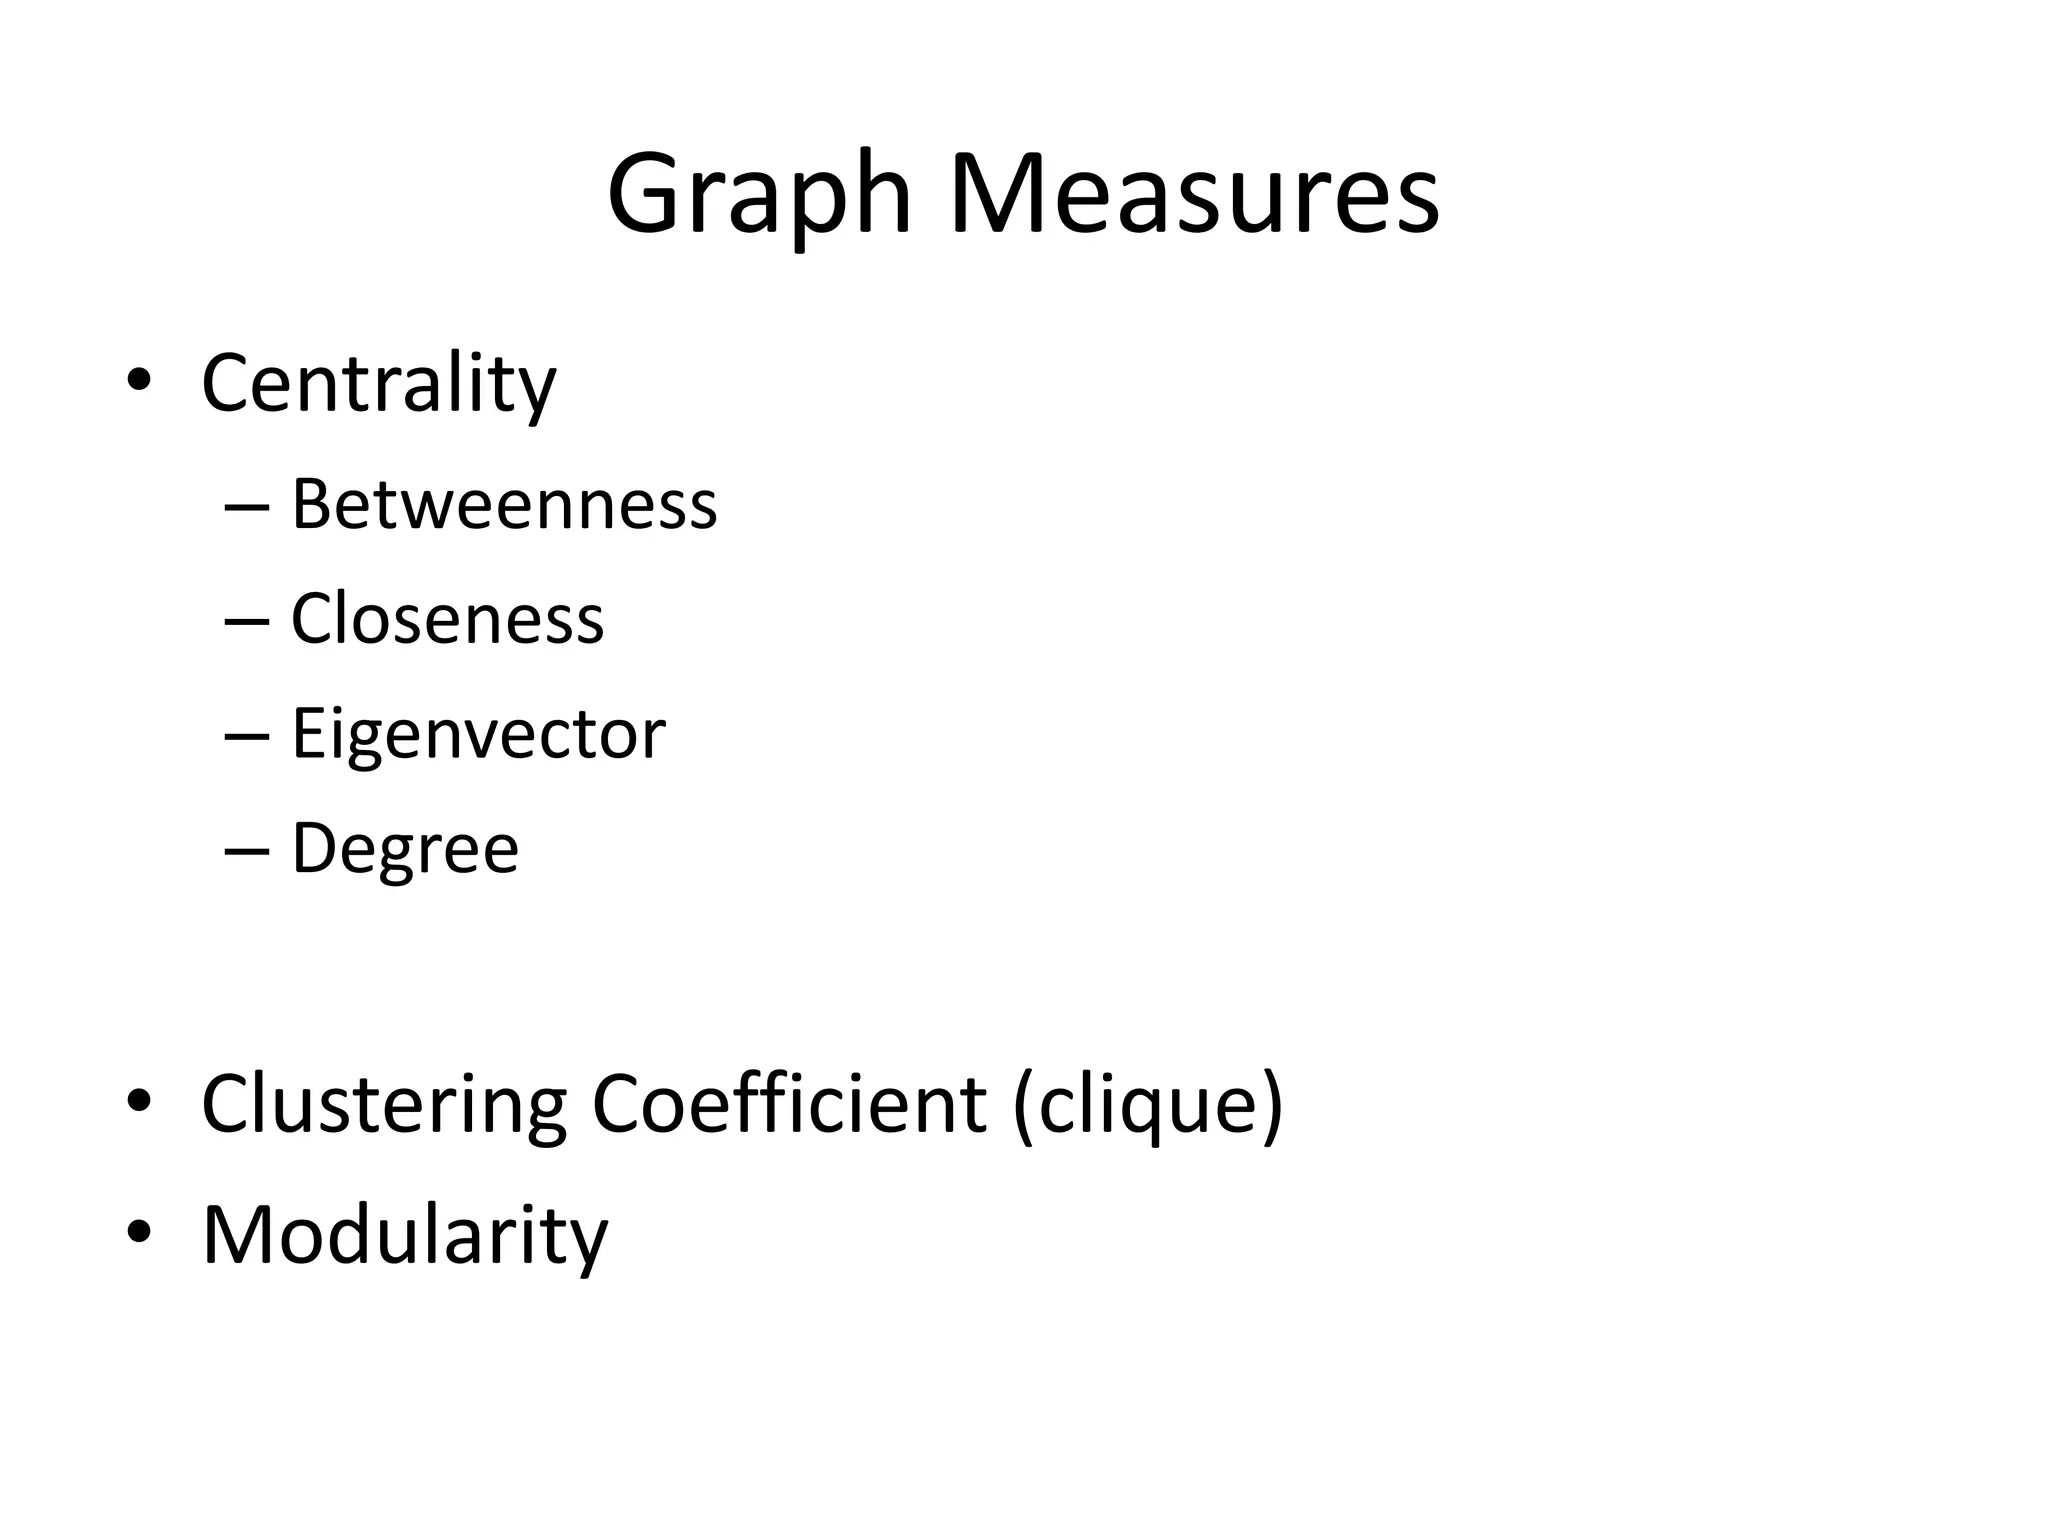
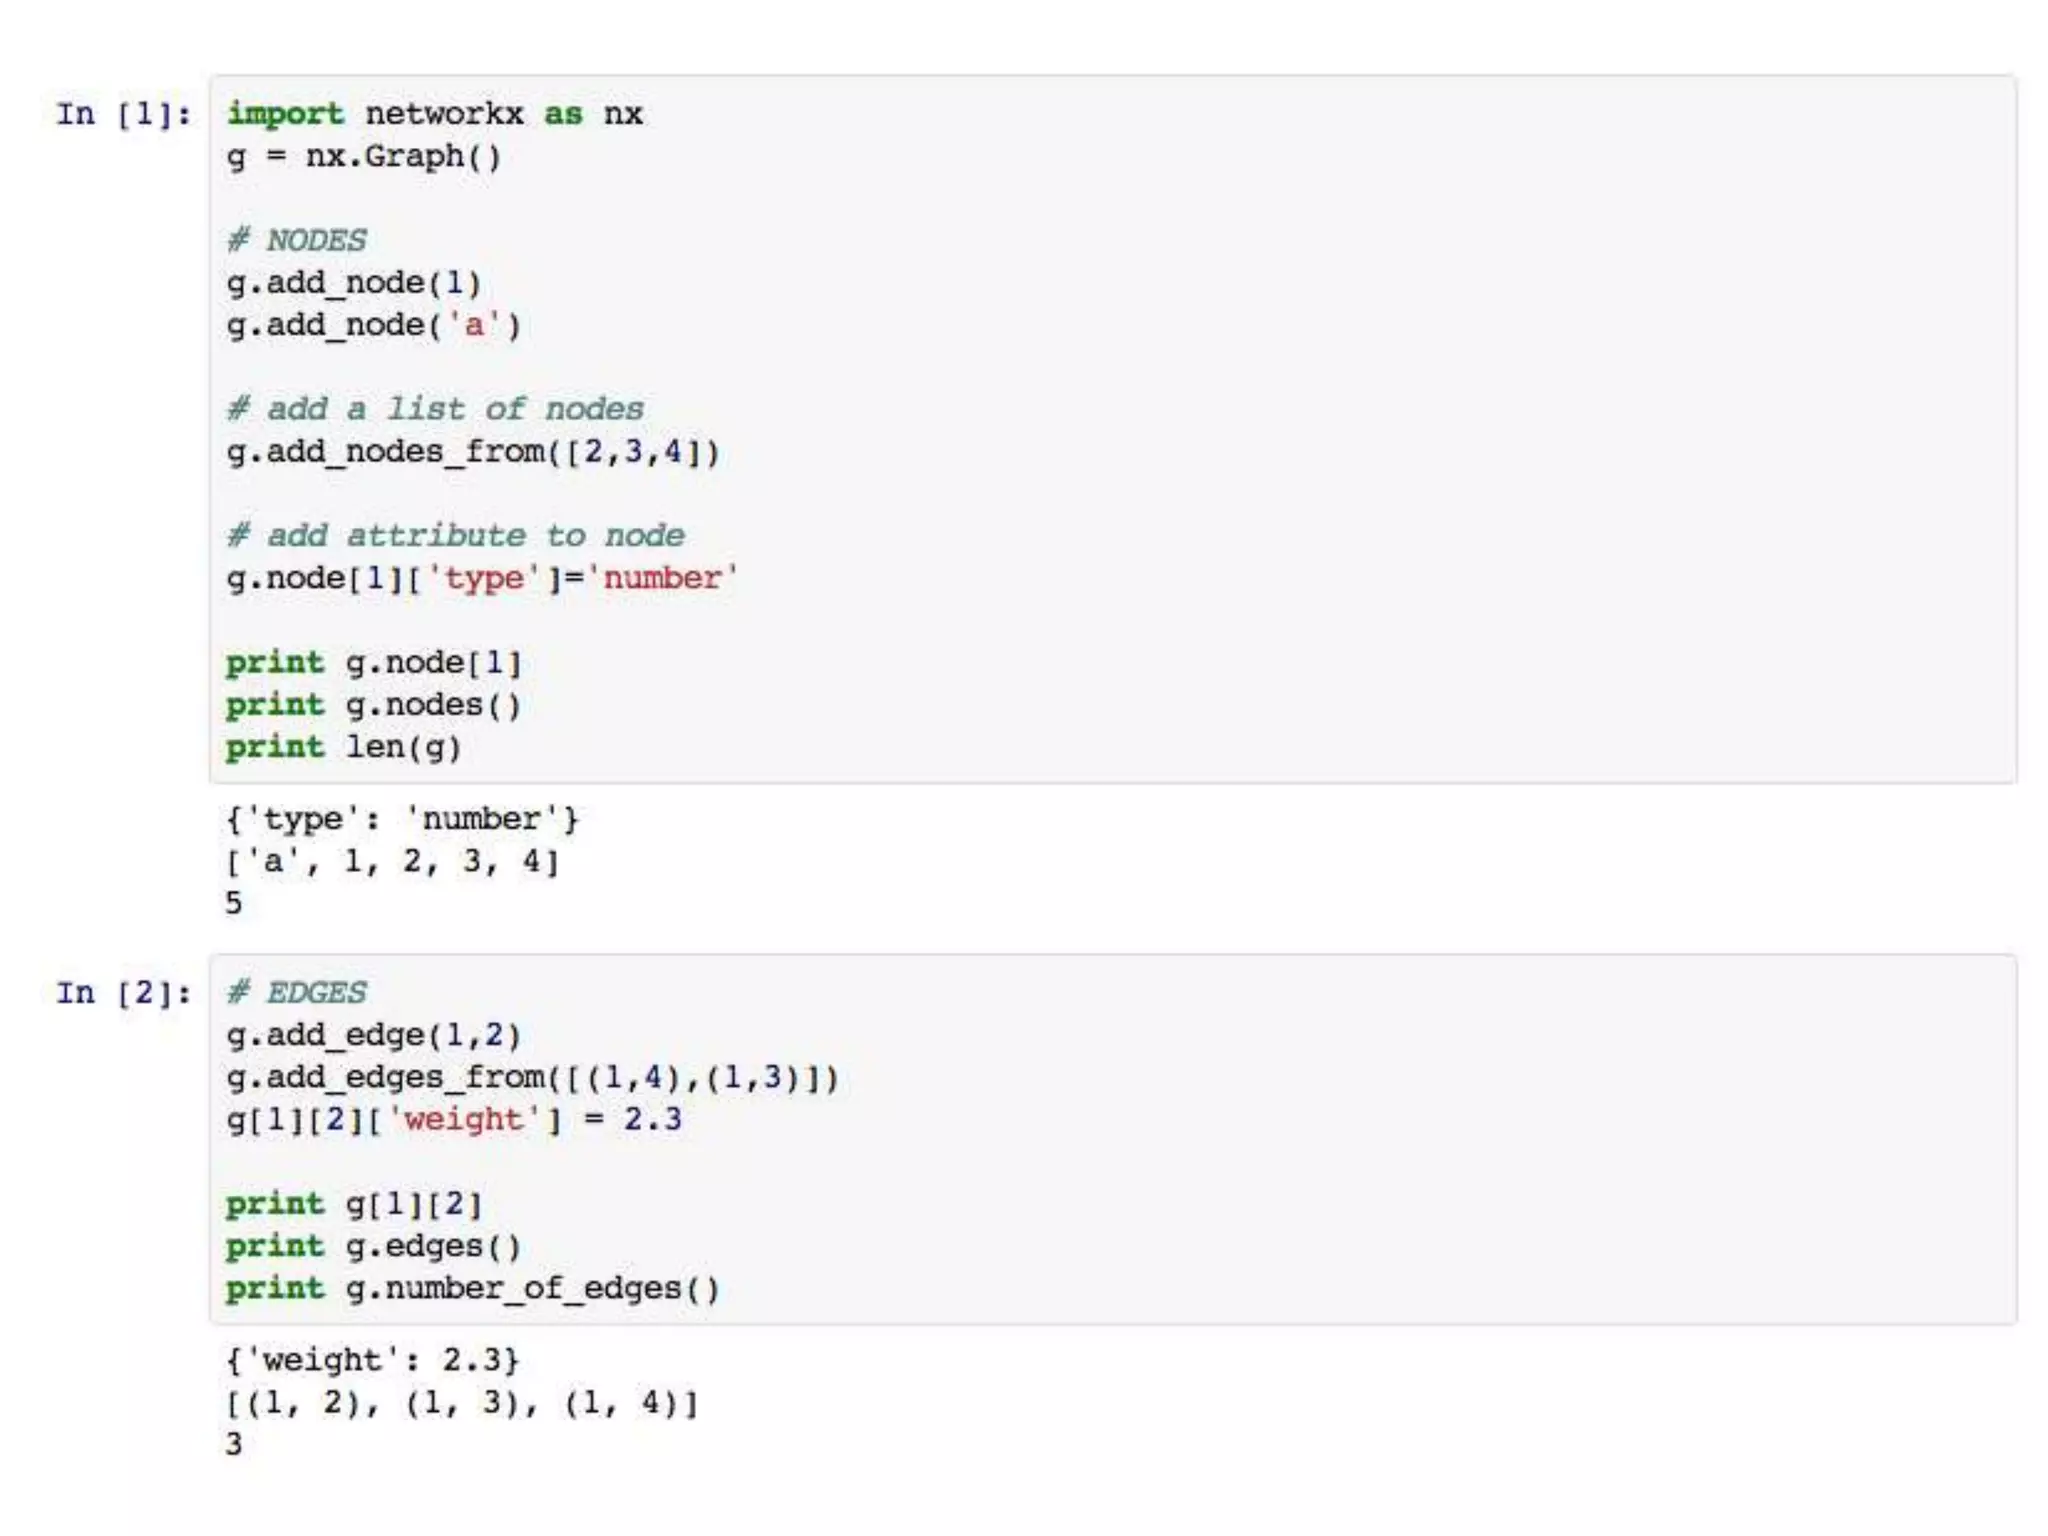
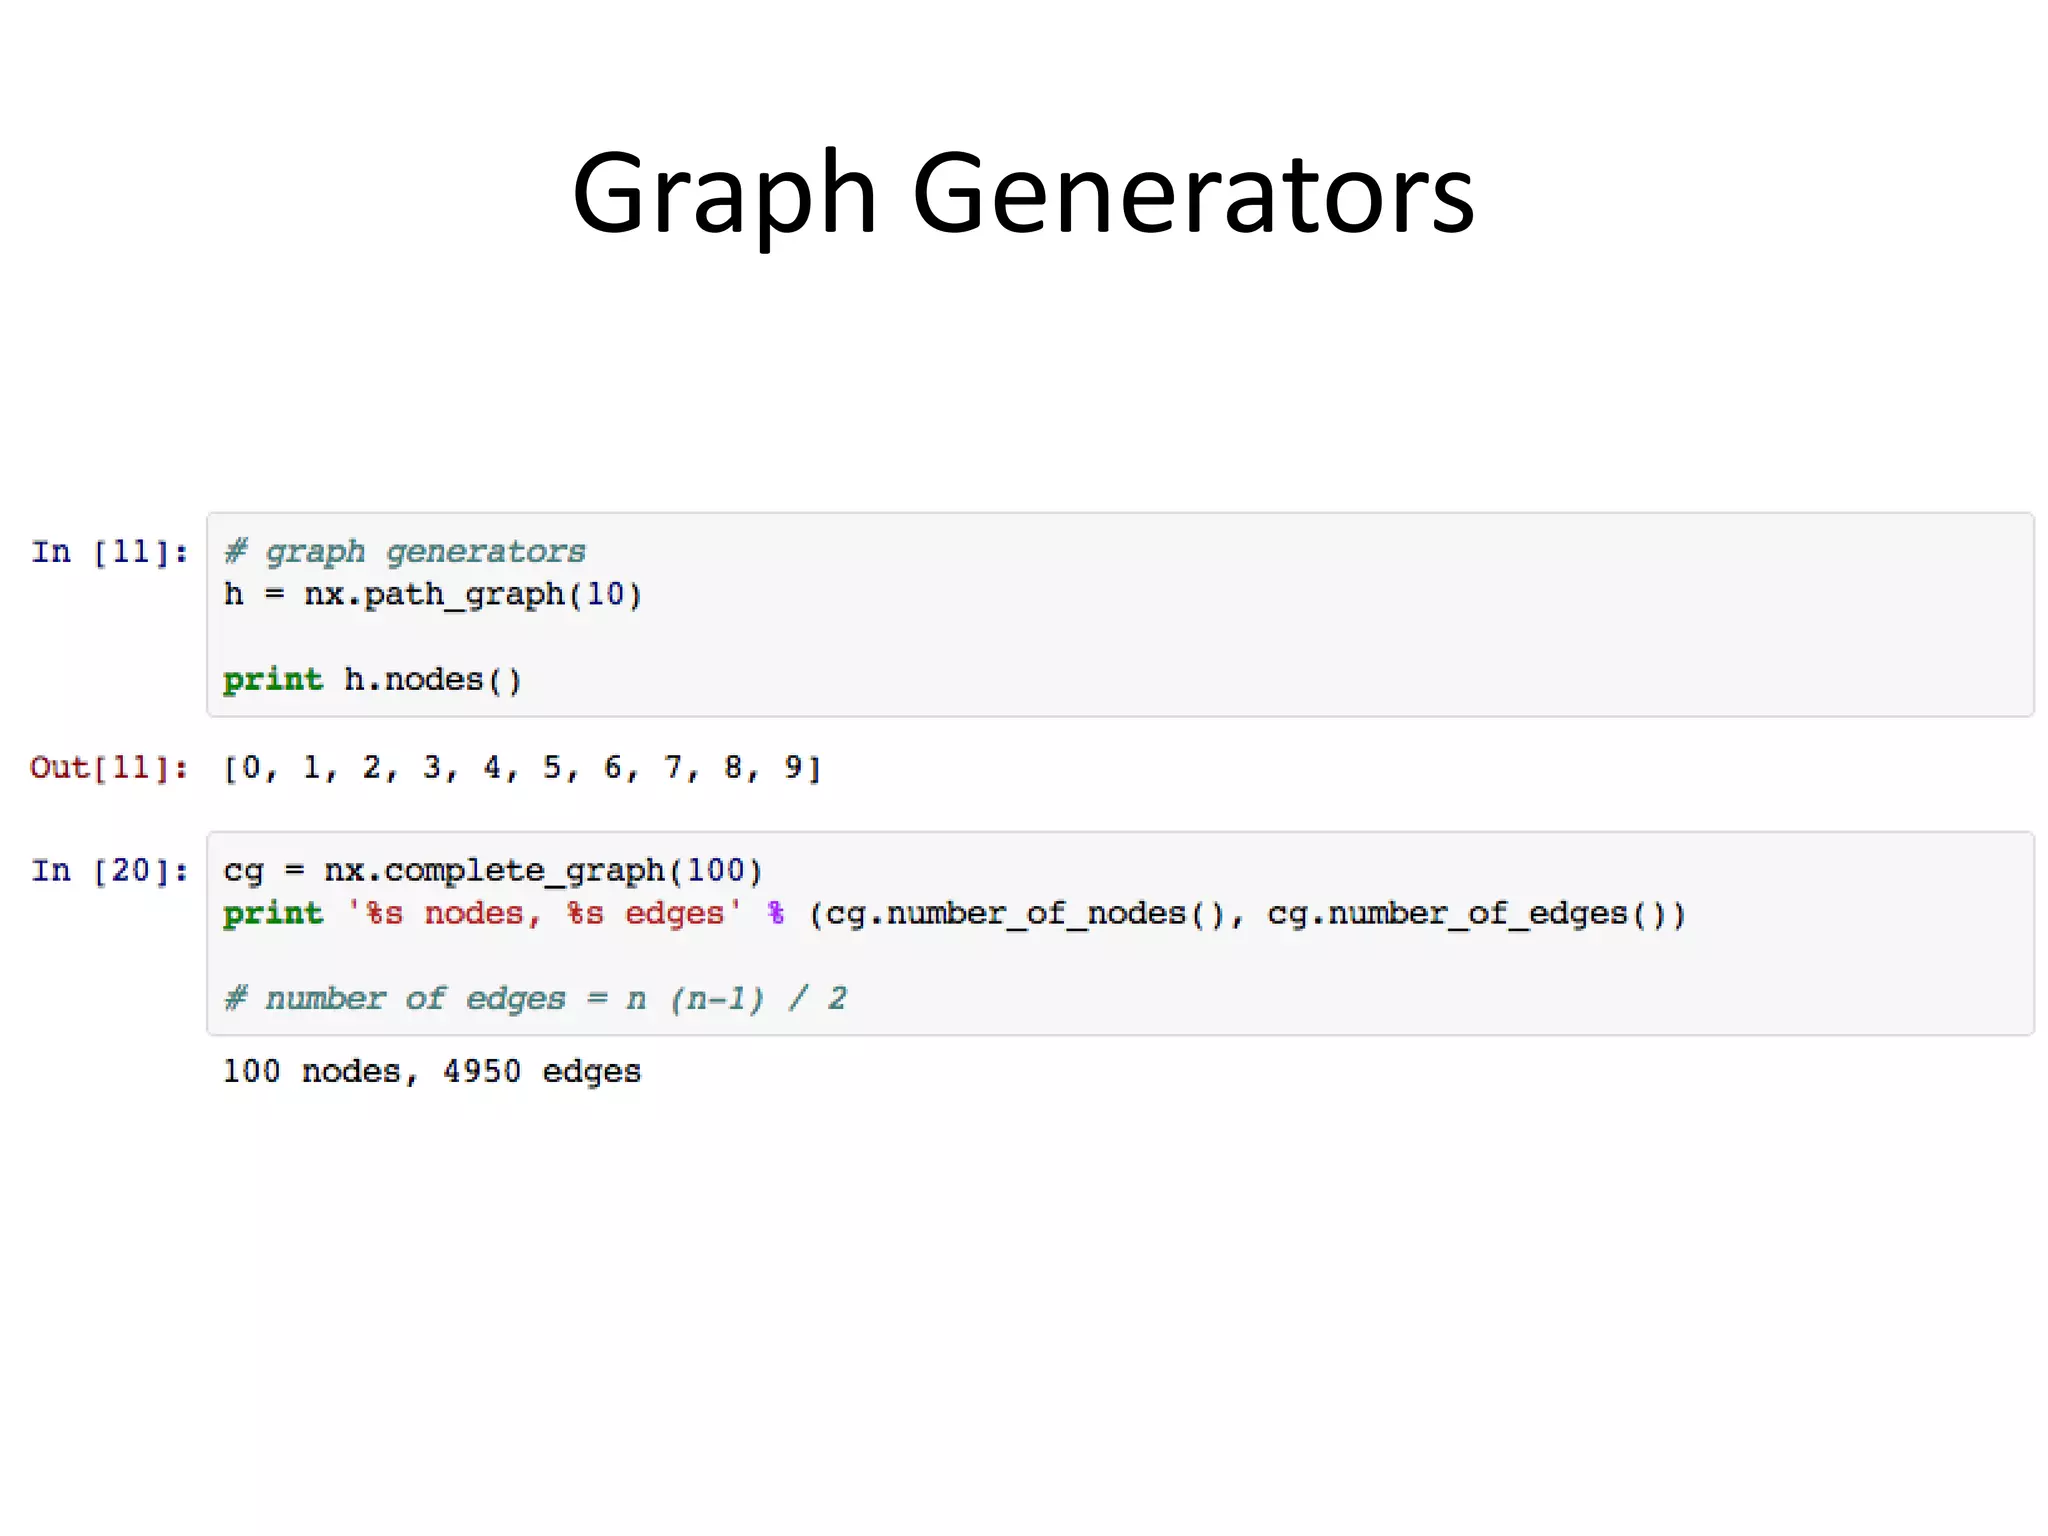
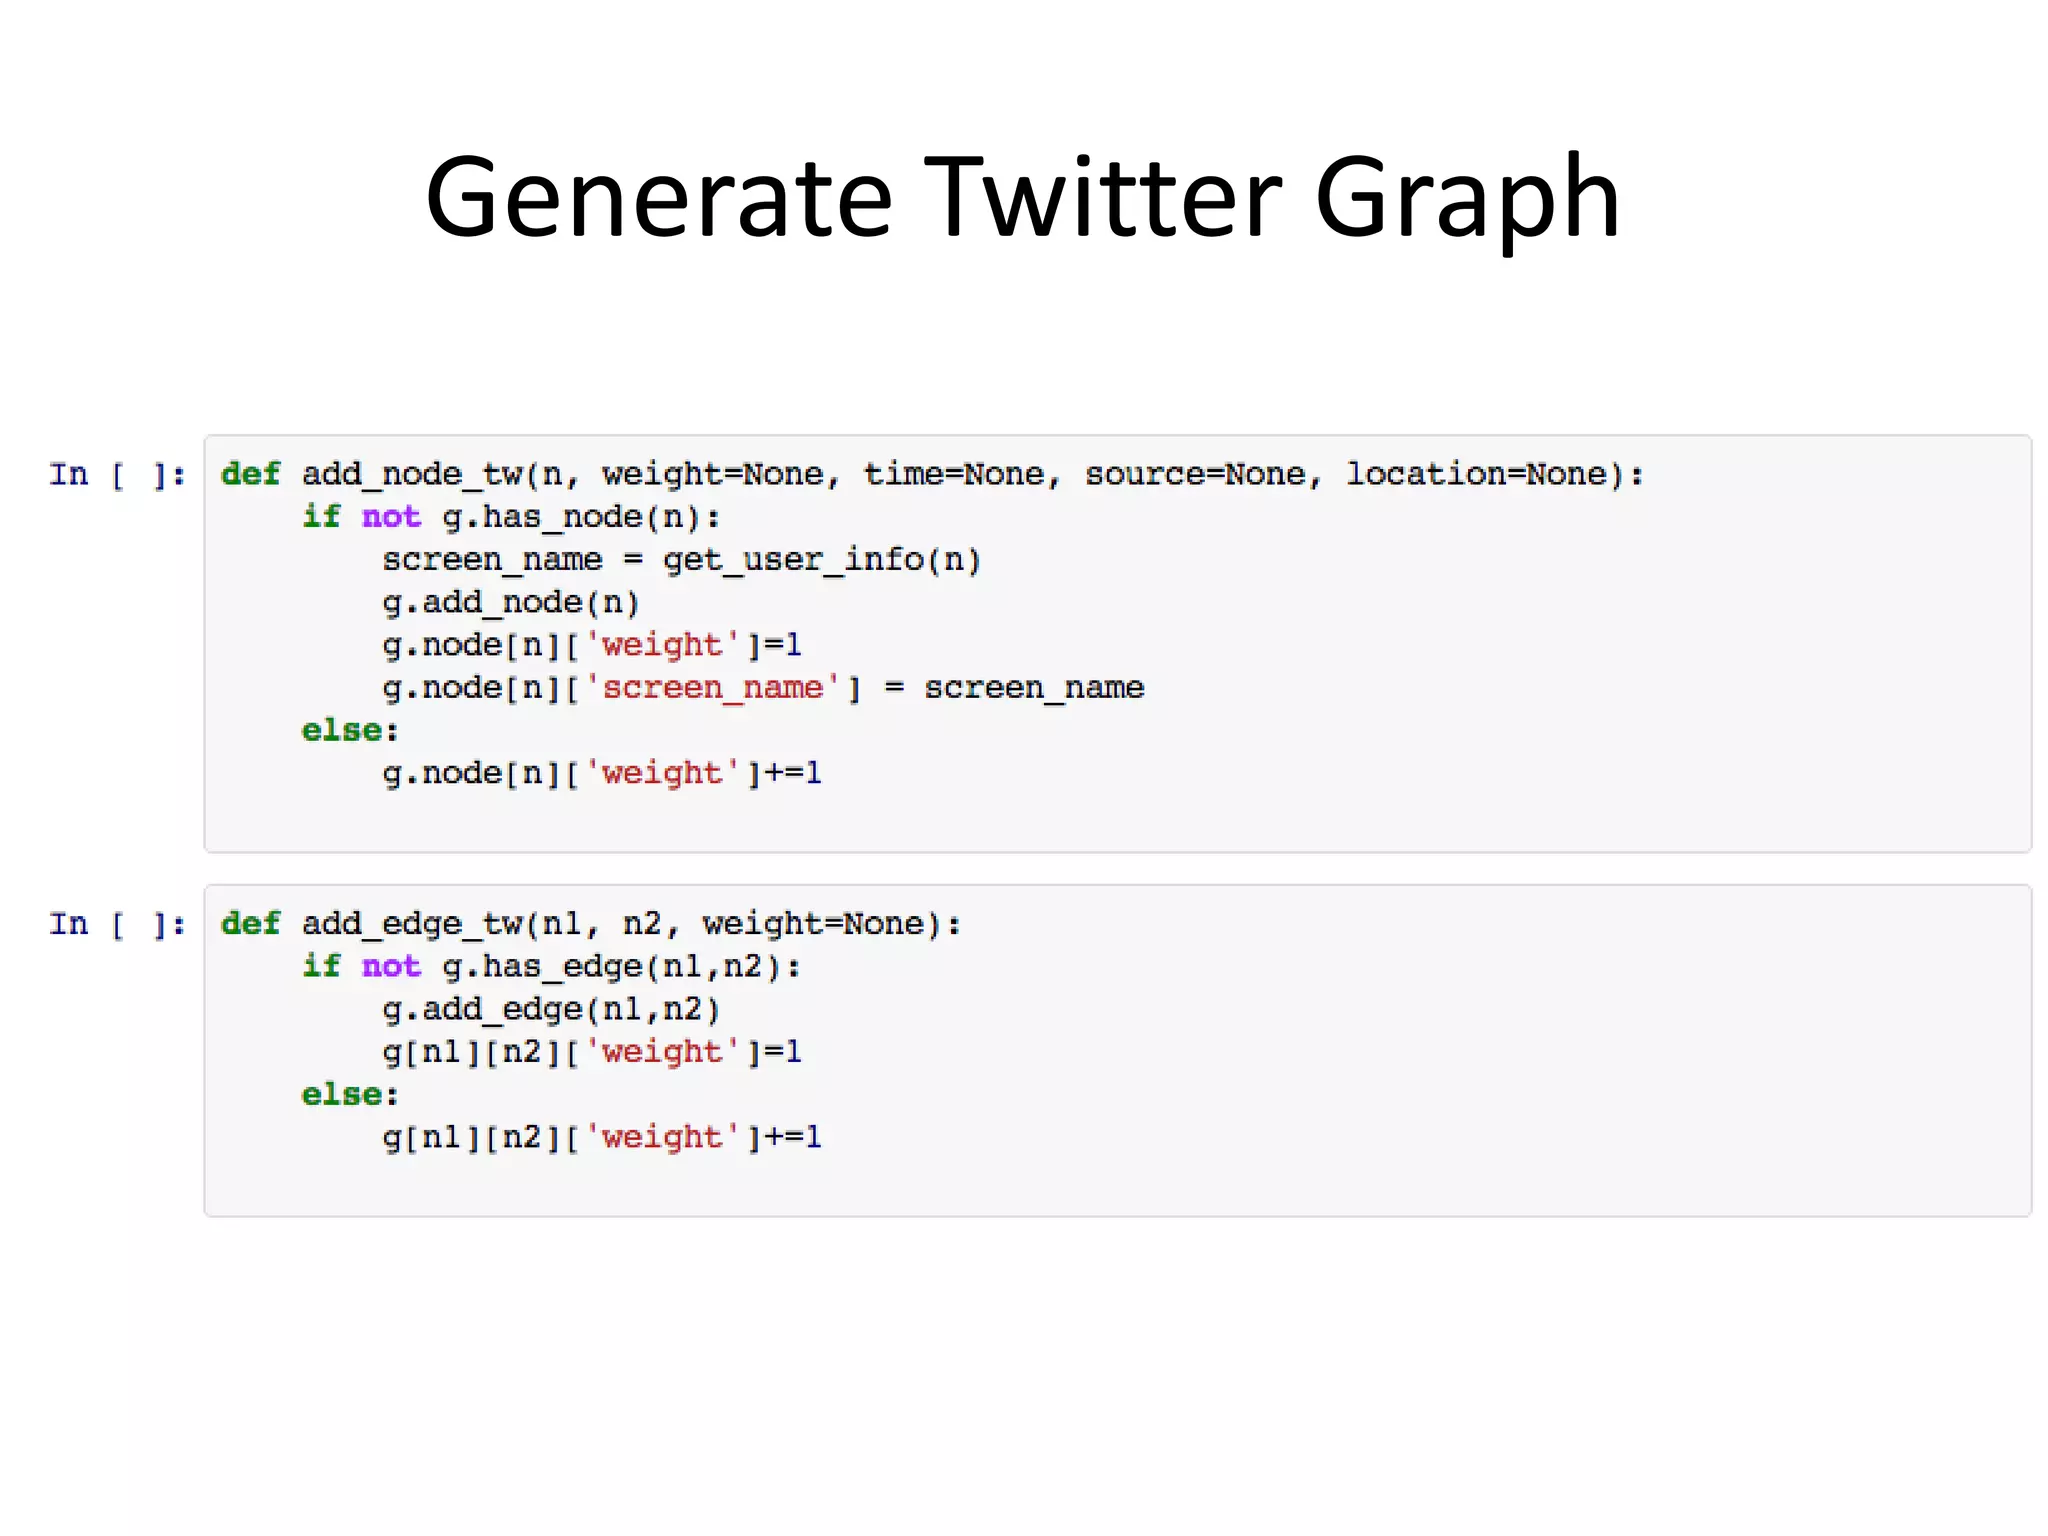
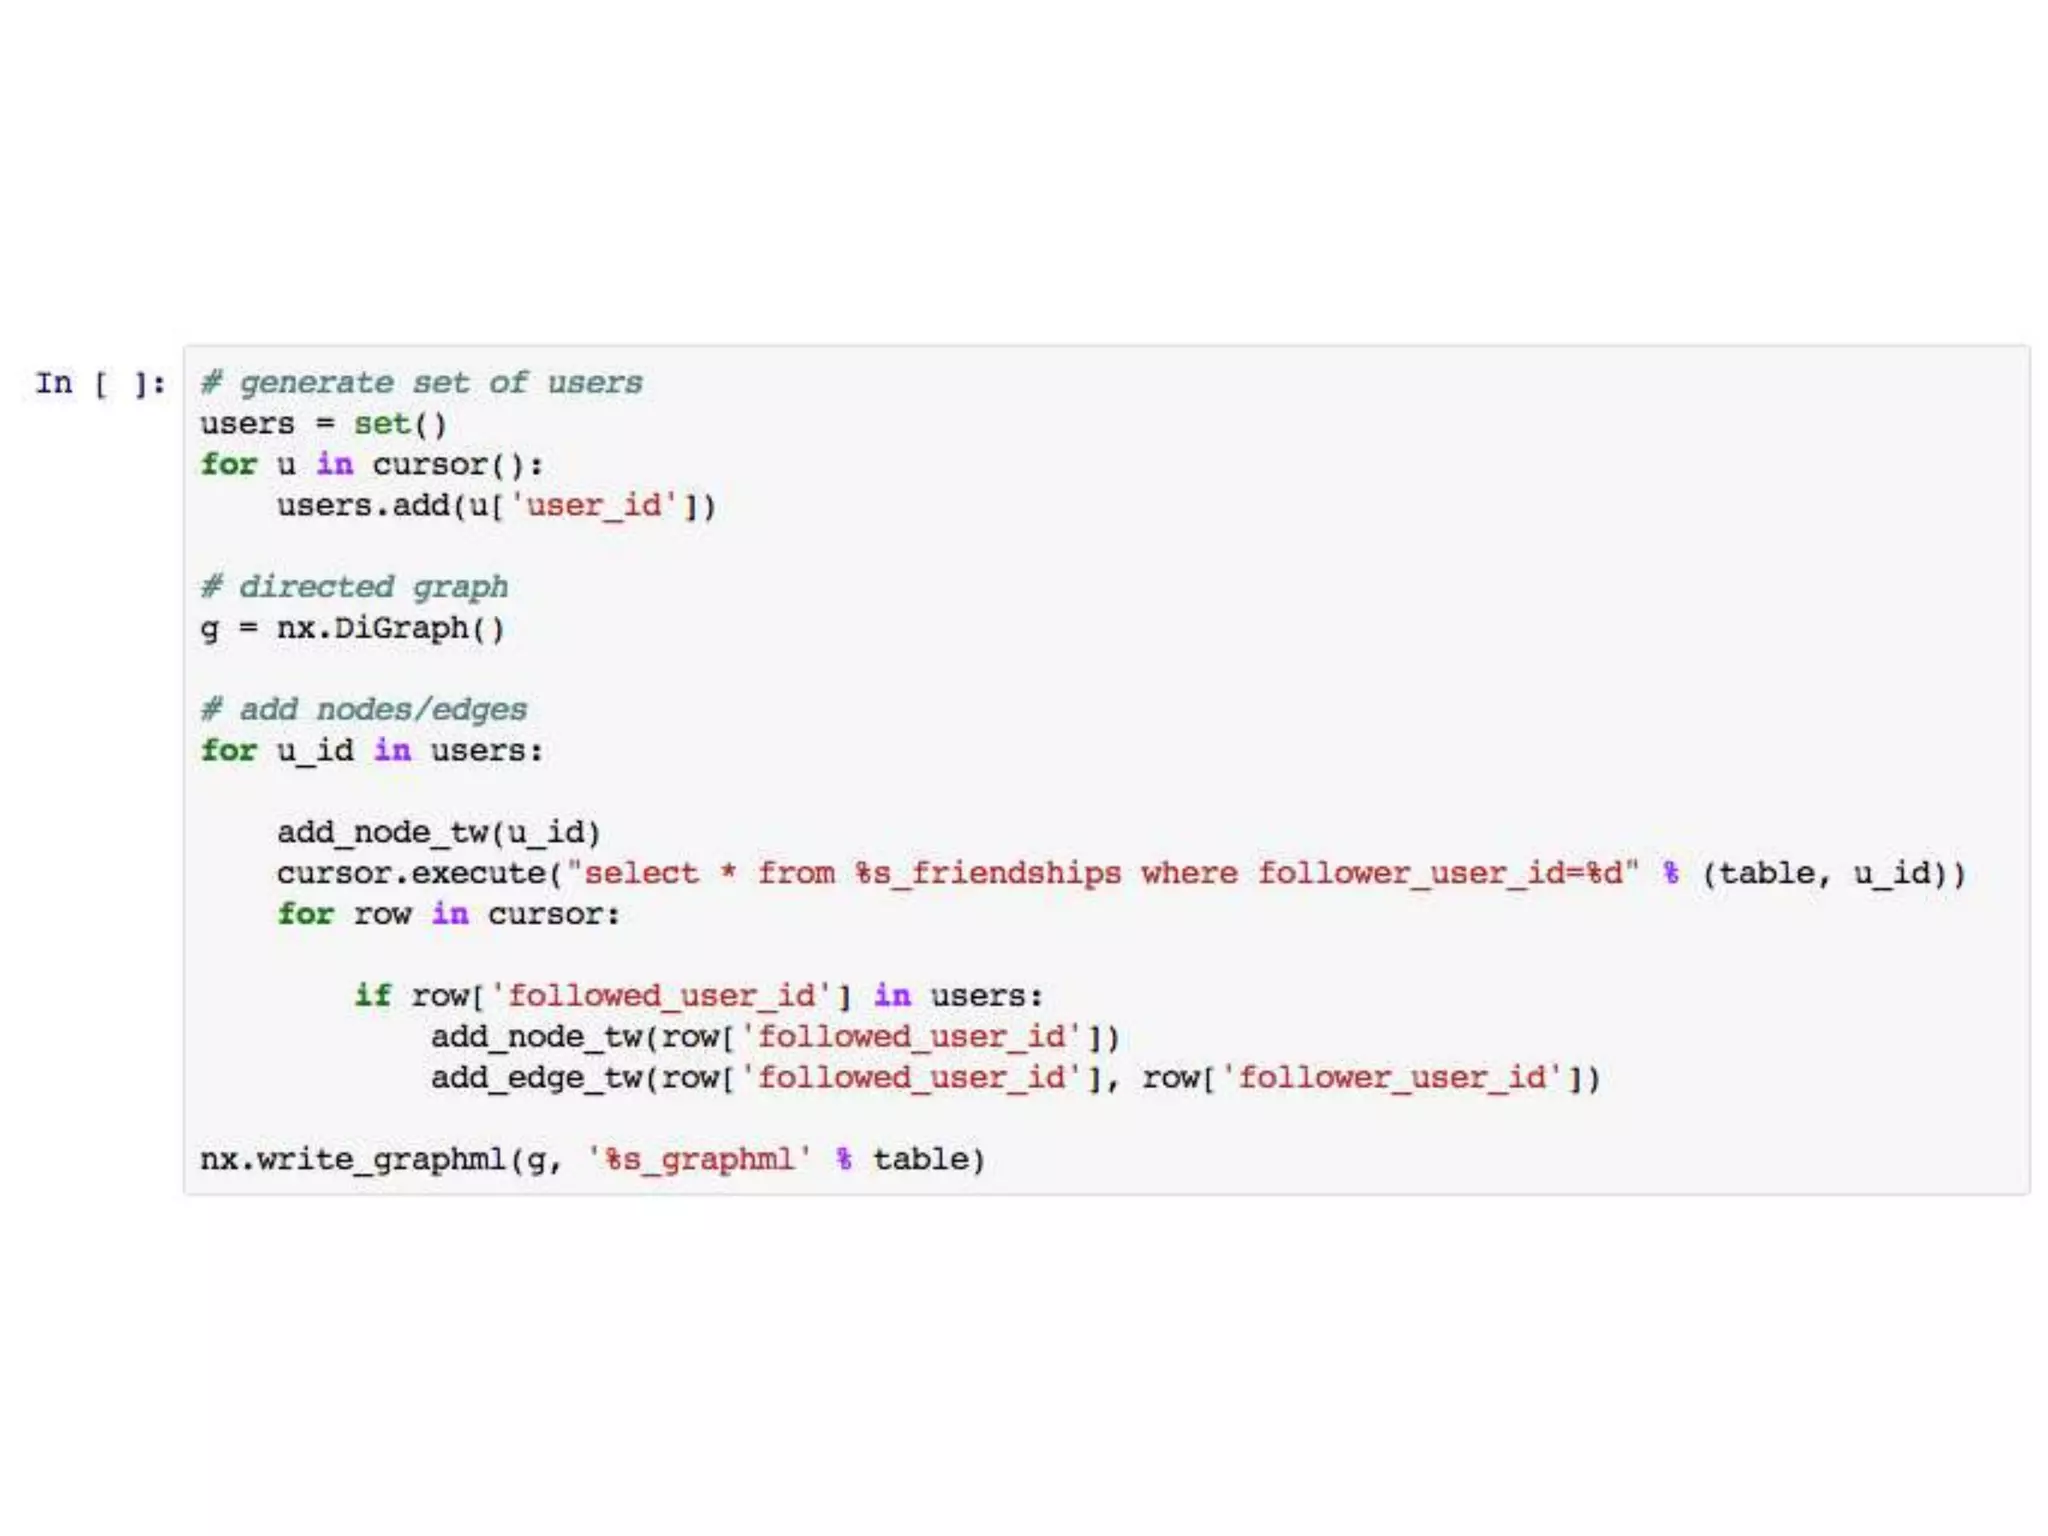
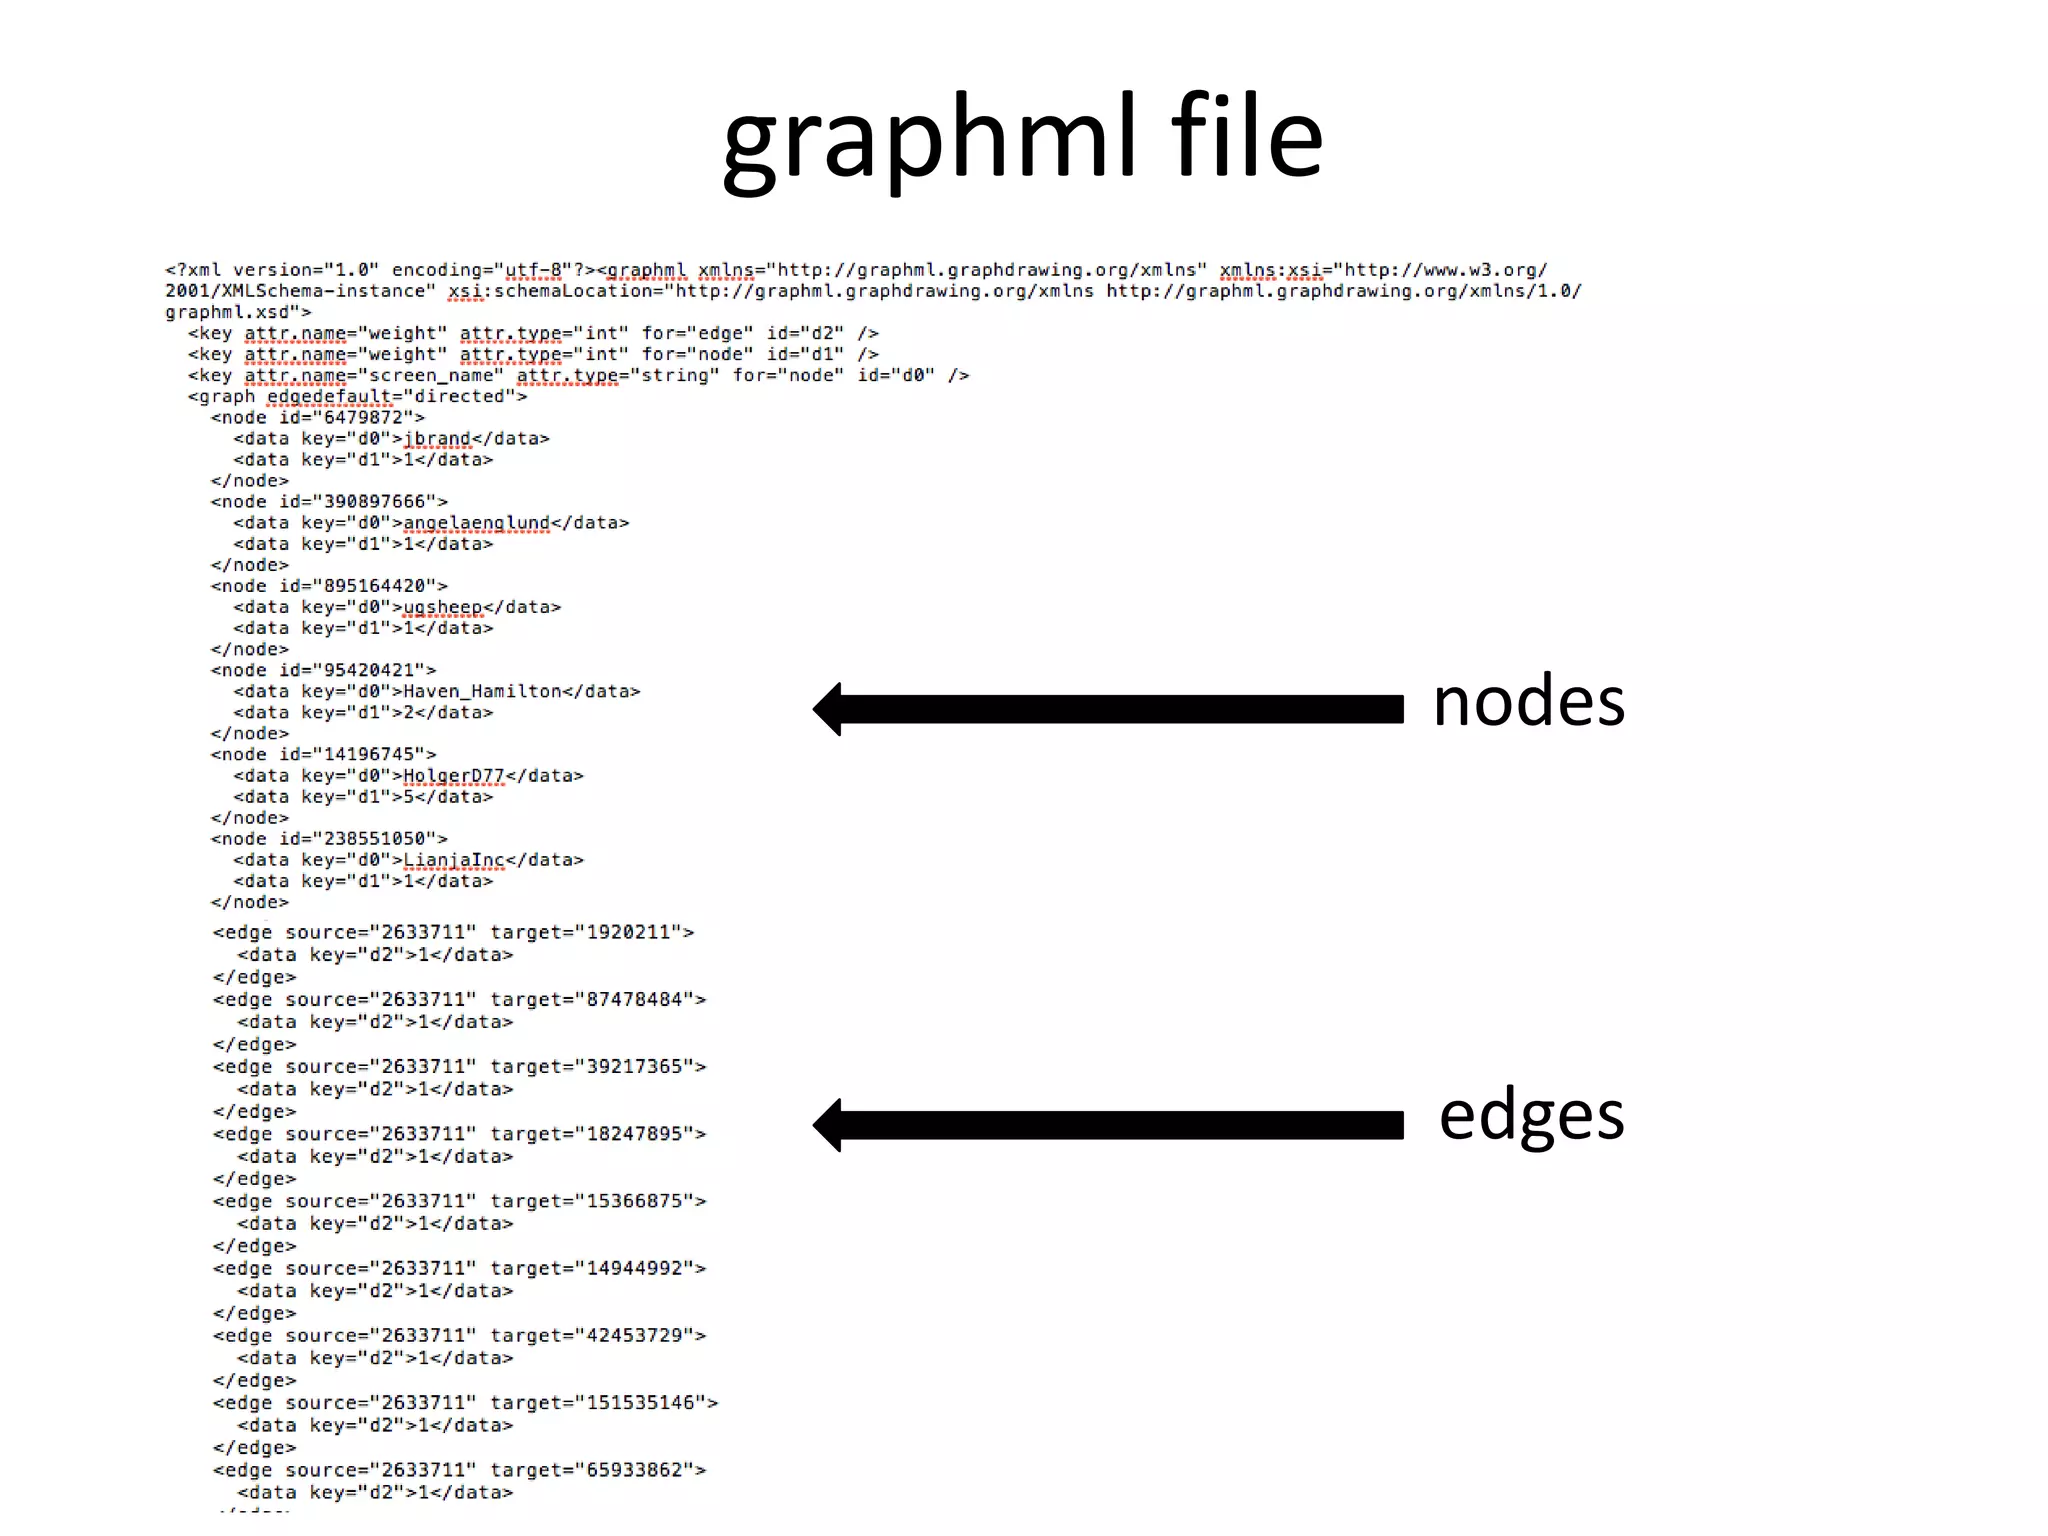
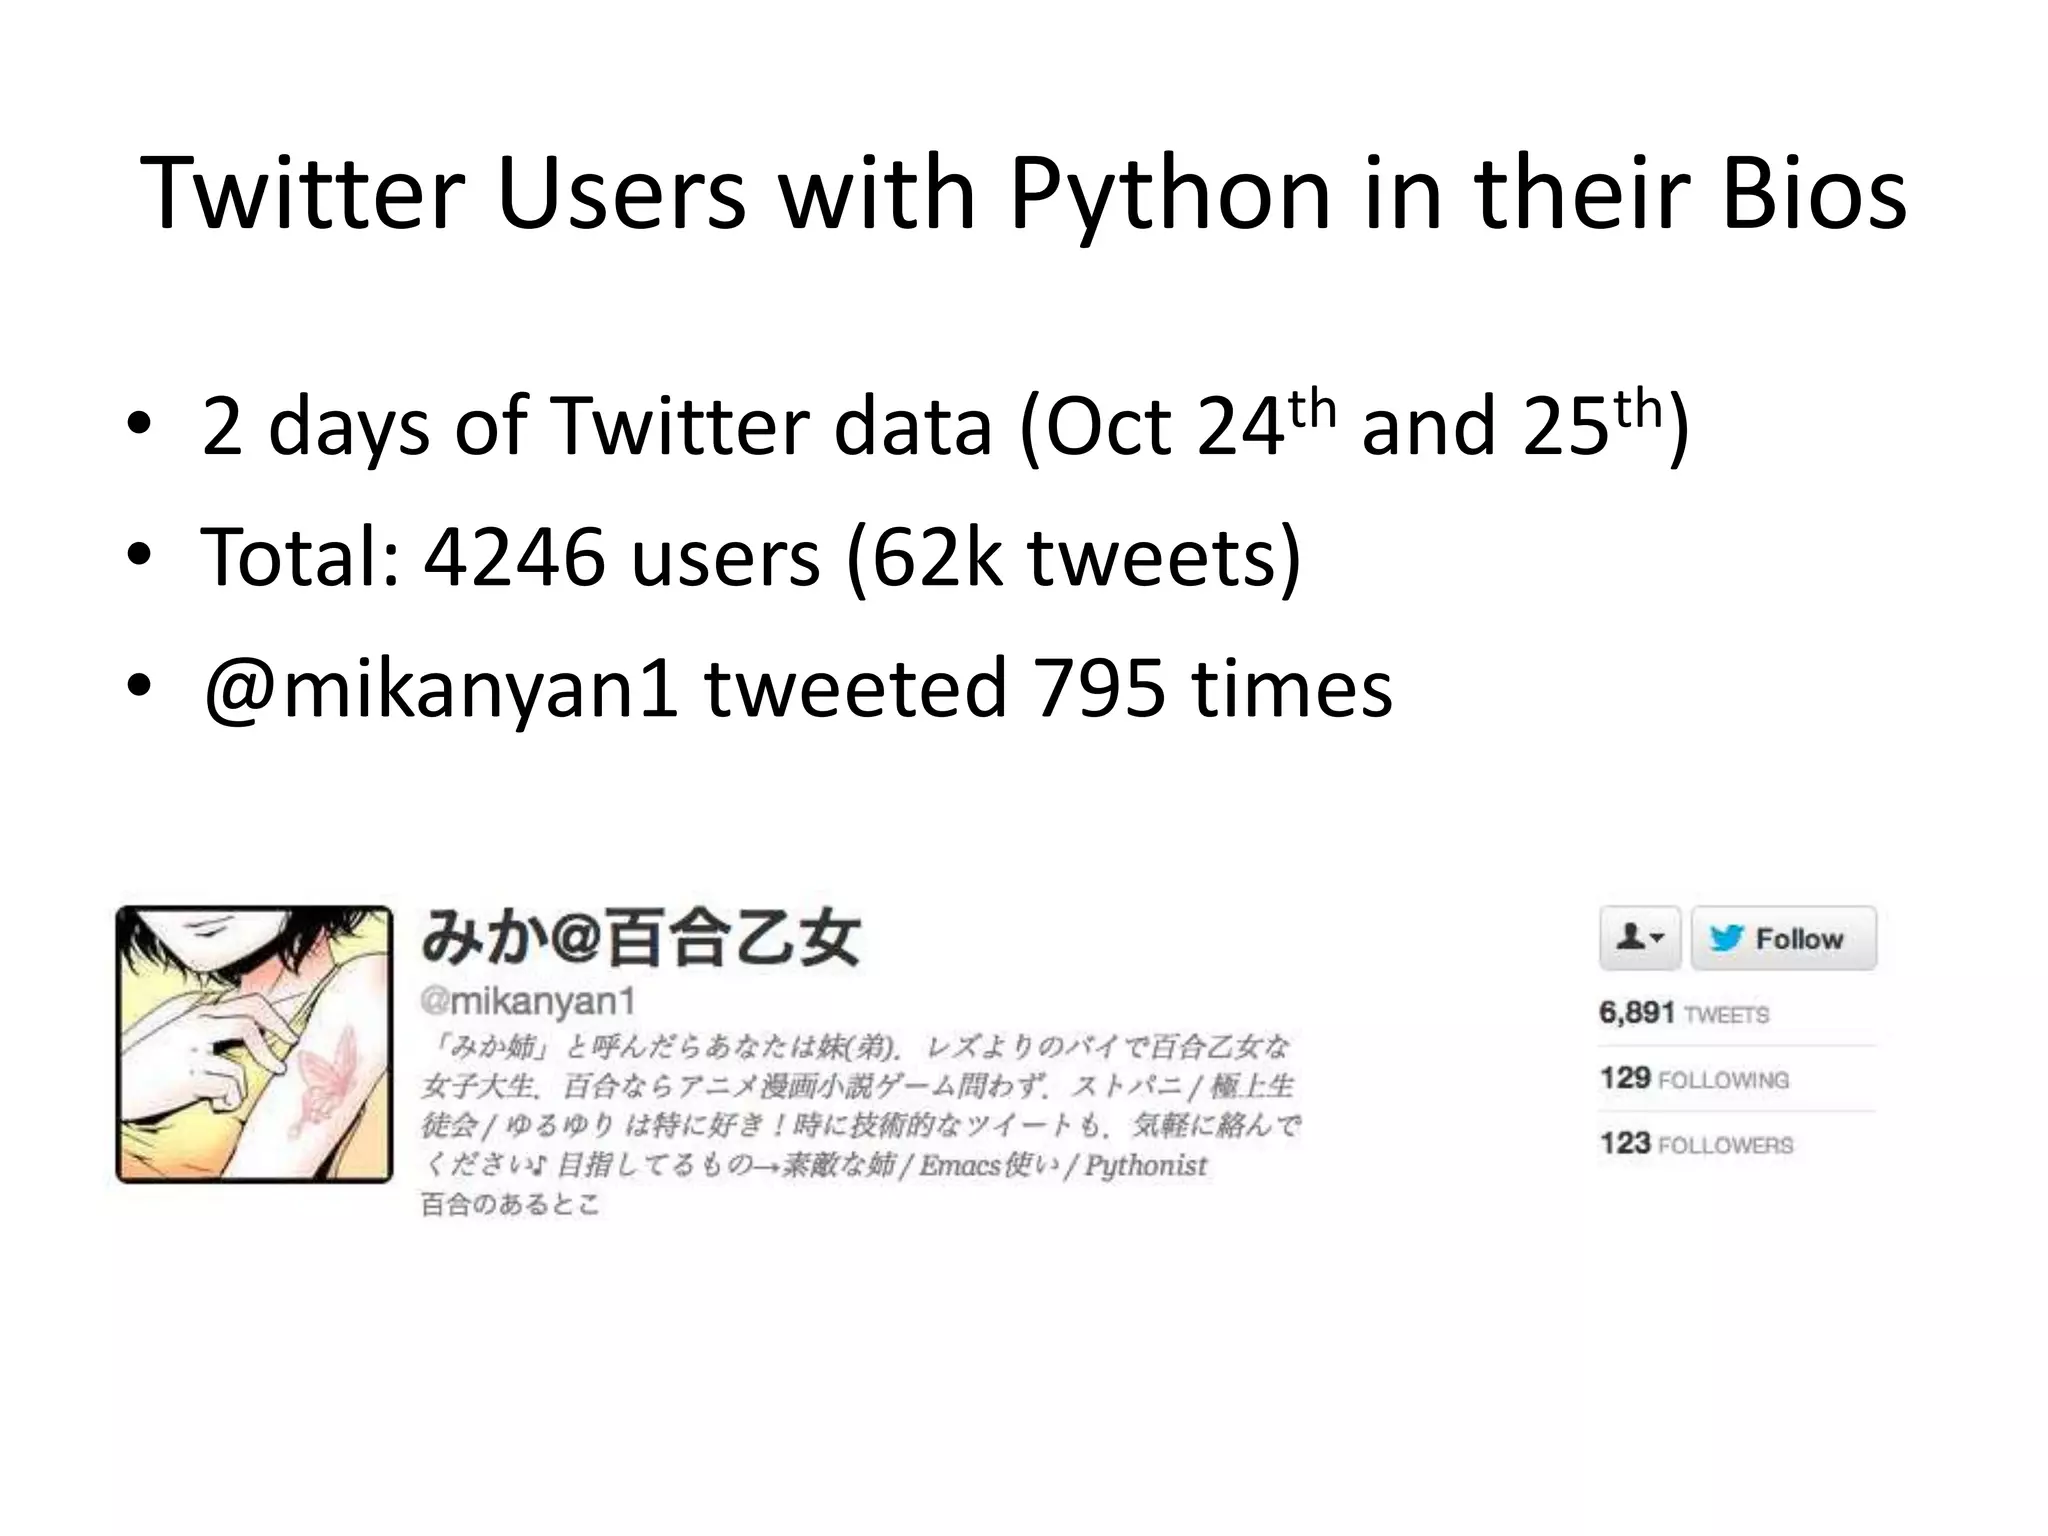
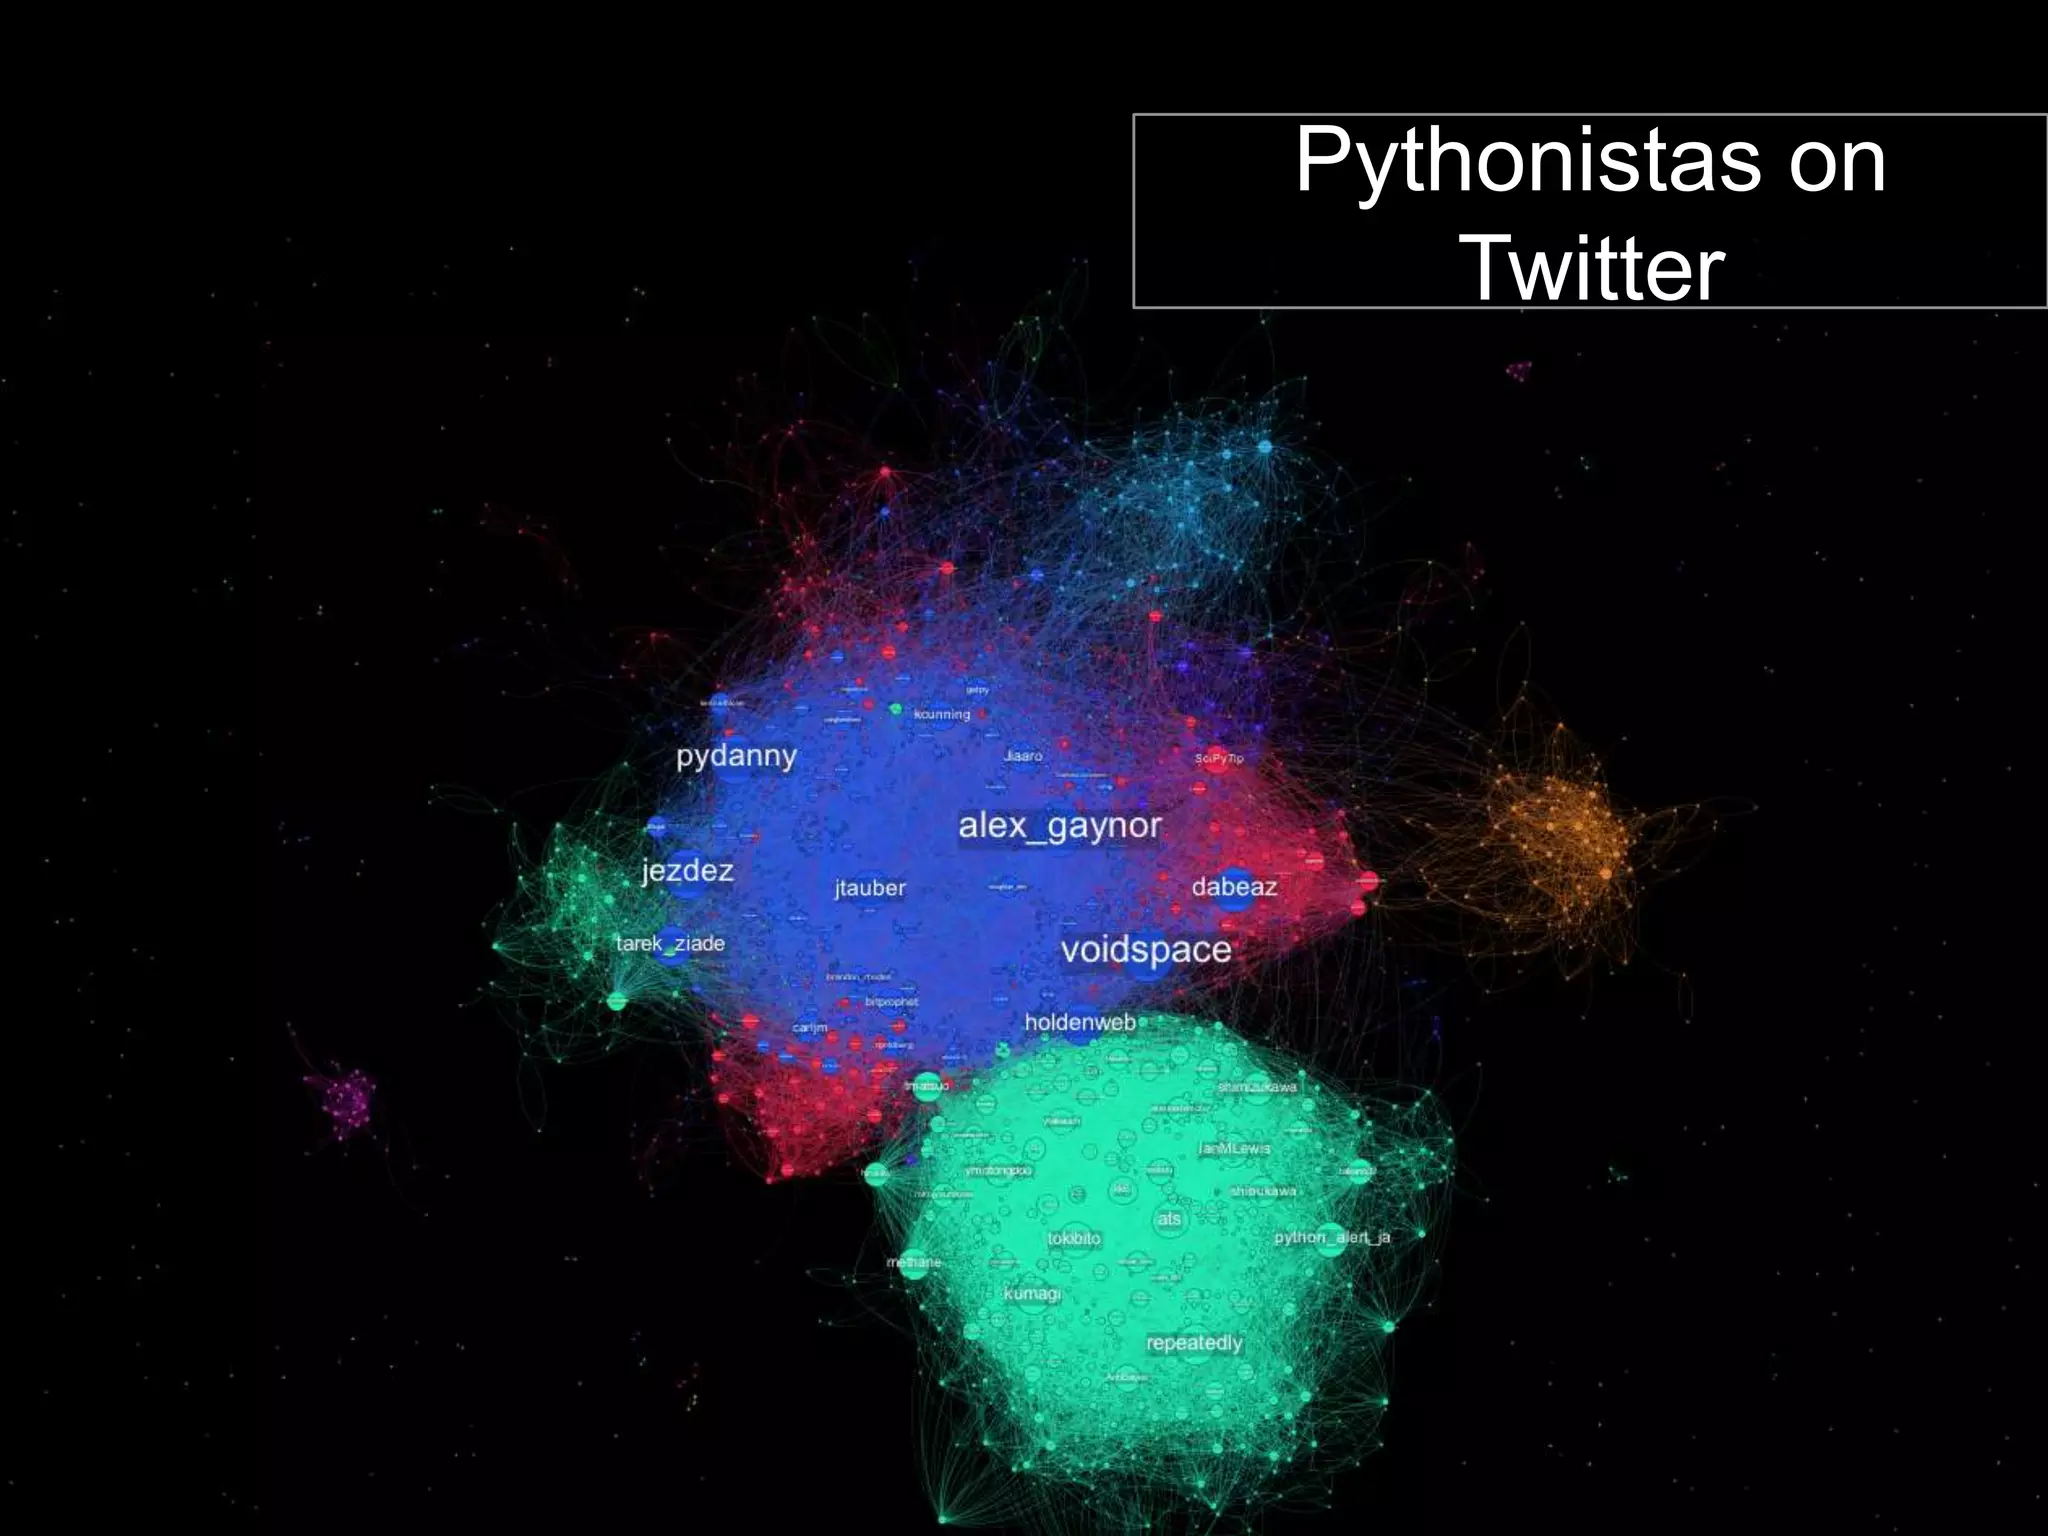
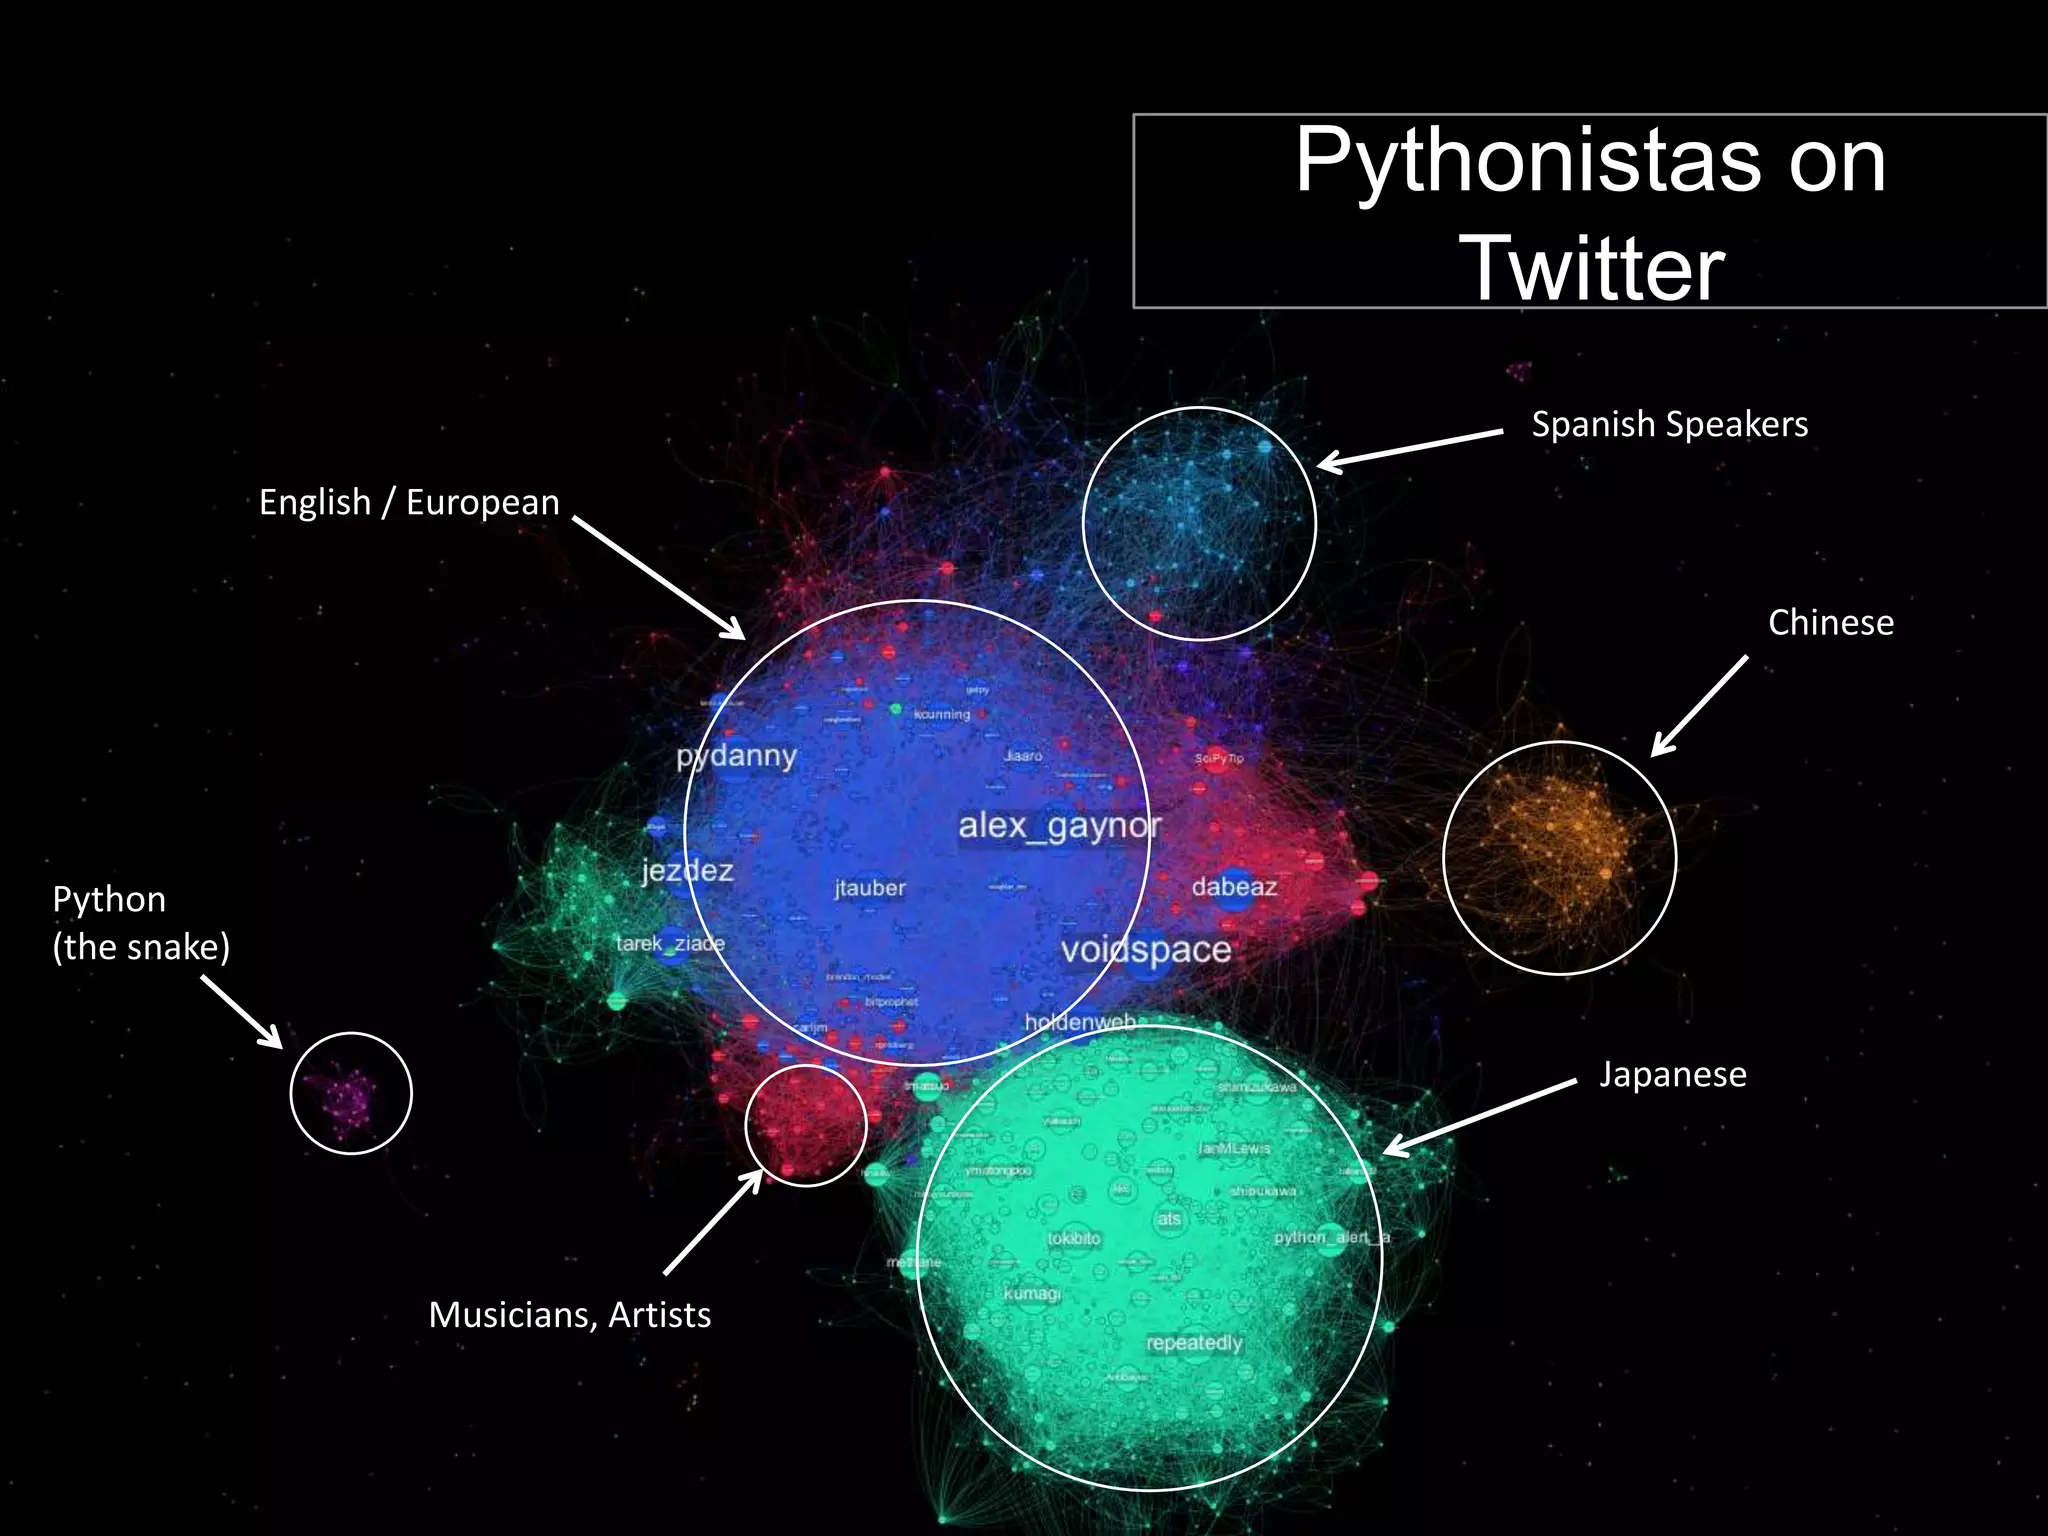
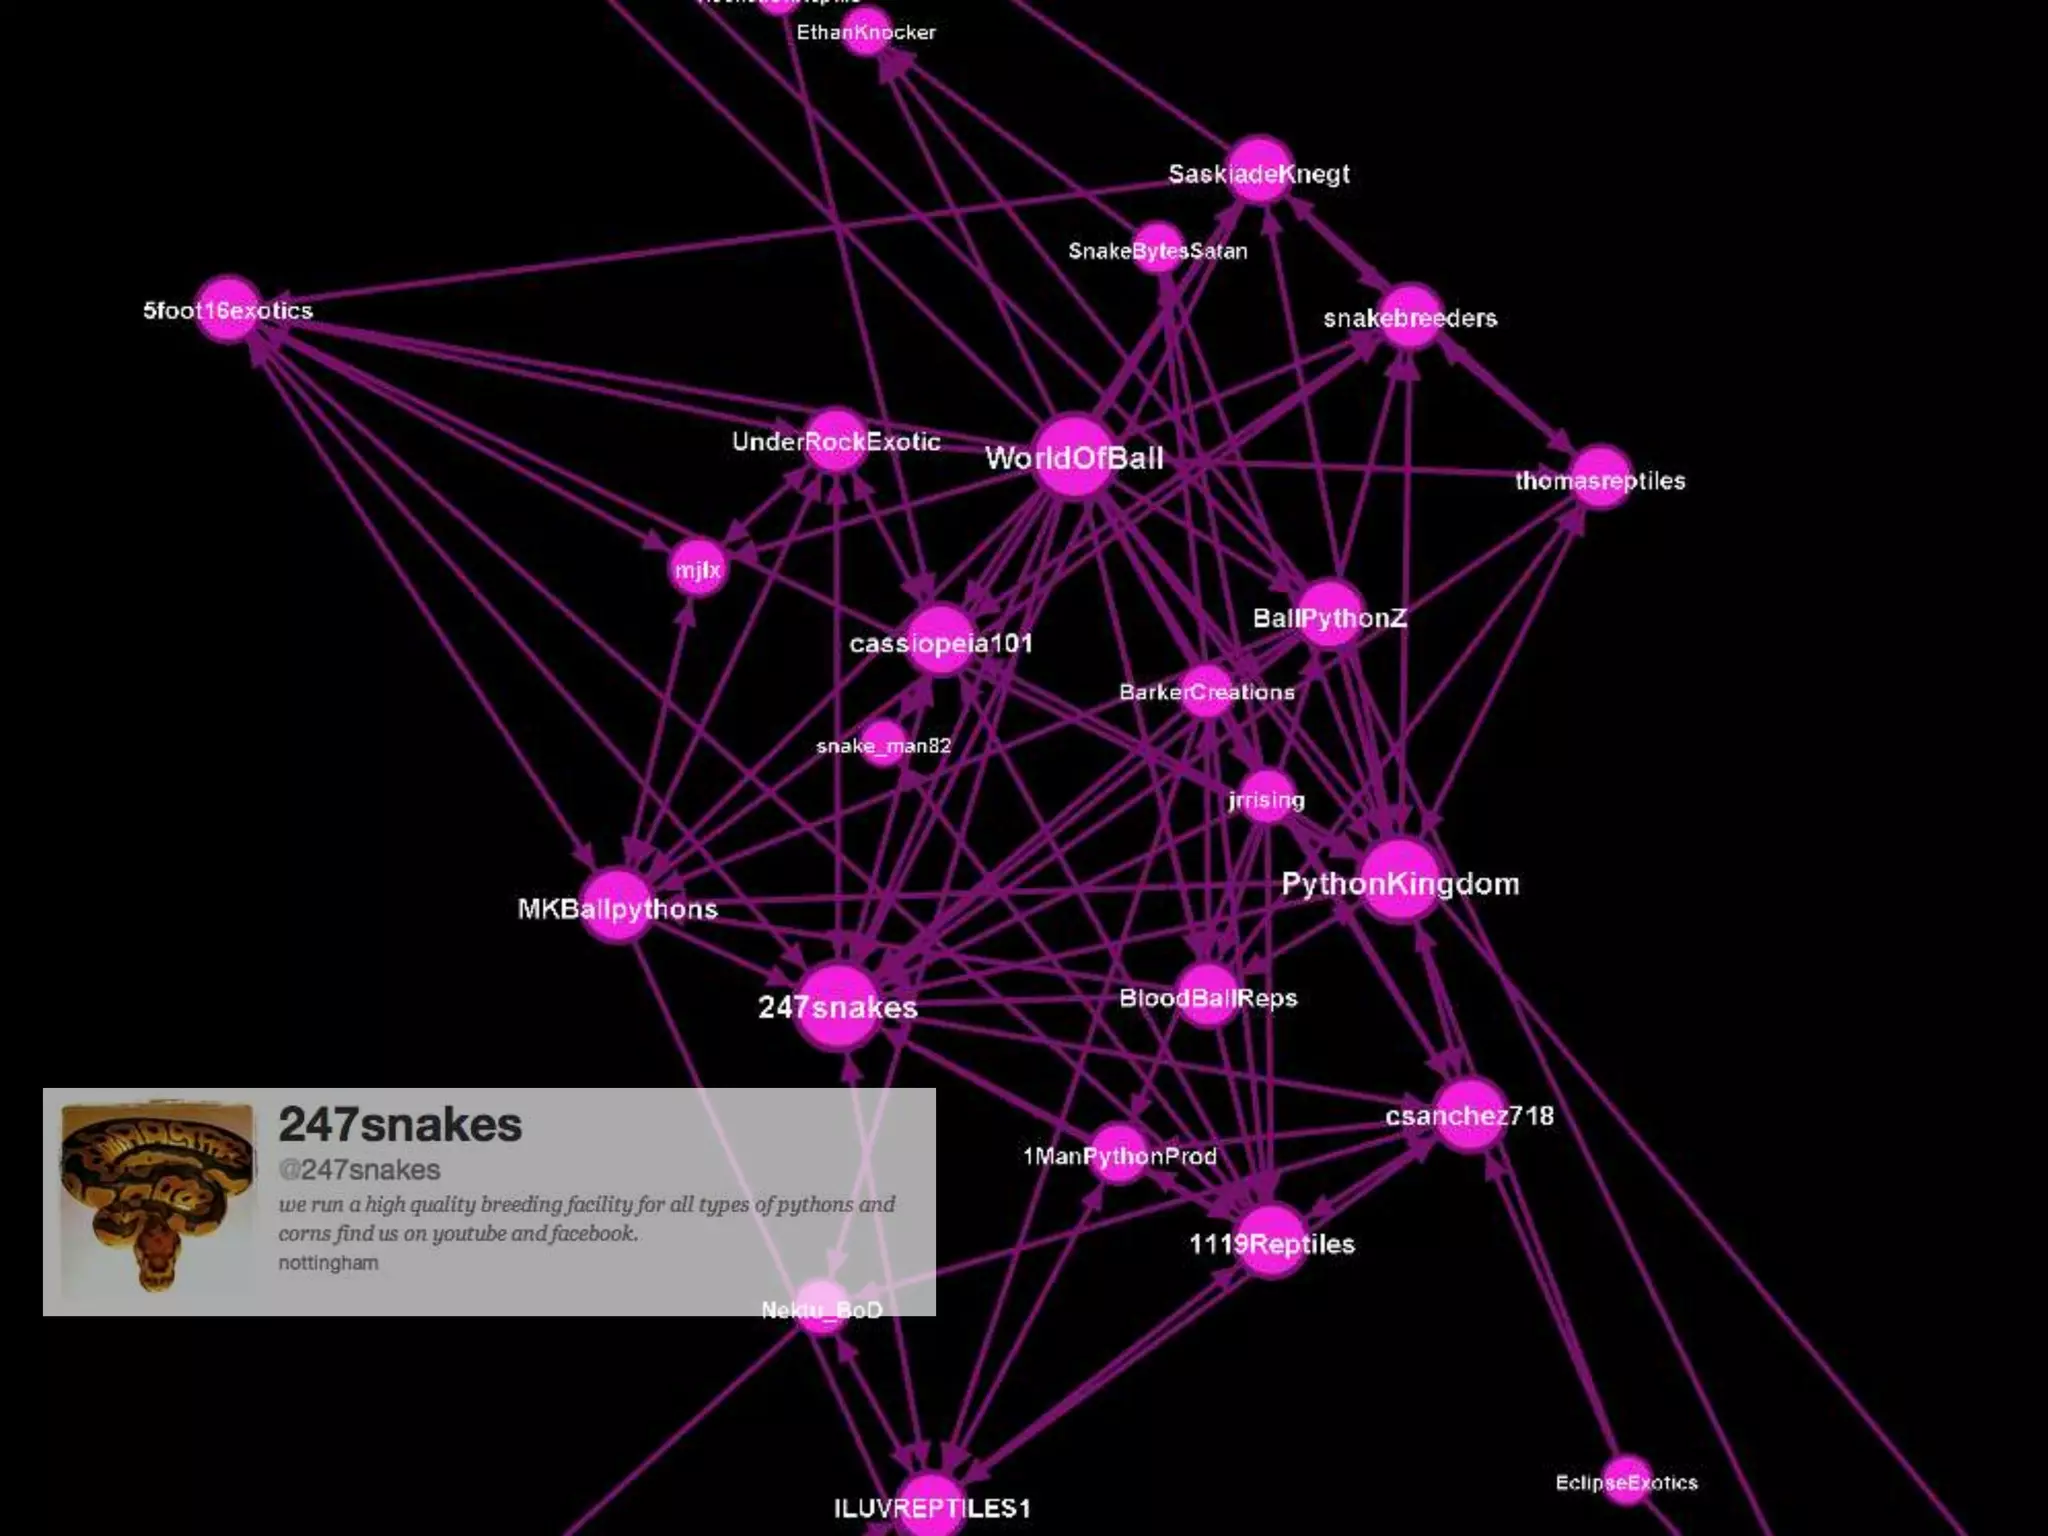

The document discusses network analysis using tools like NetworkX and Gephi, focusing on graph properties such as indegree, outdegree, and centrality measures. It highlights various graph types and their characteristics, including complete graphs, bipartite graphs, and small-world networks, using social networks as examples. Additionally, it provides insights into Twitter data collection and analysis related to the 'data science' community on the platform.


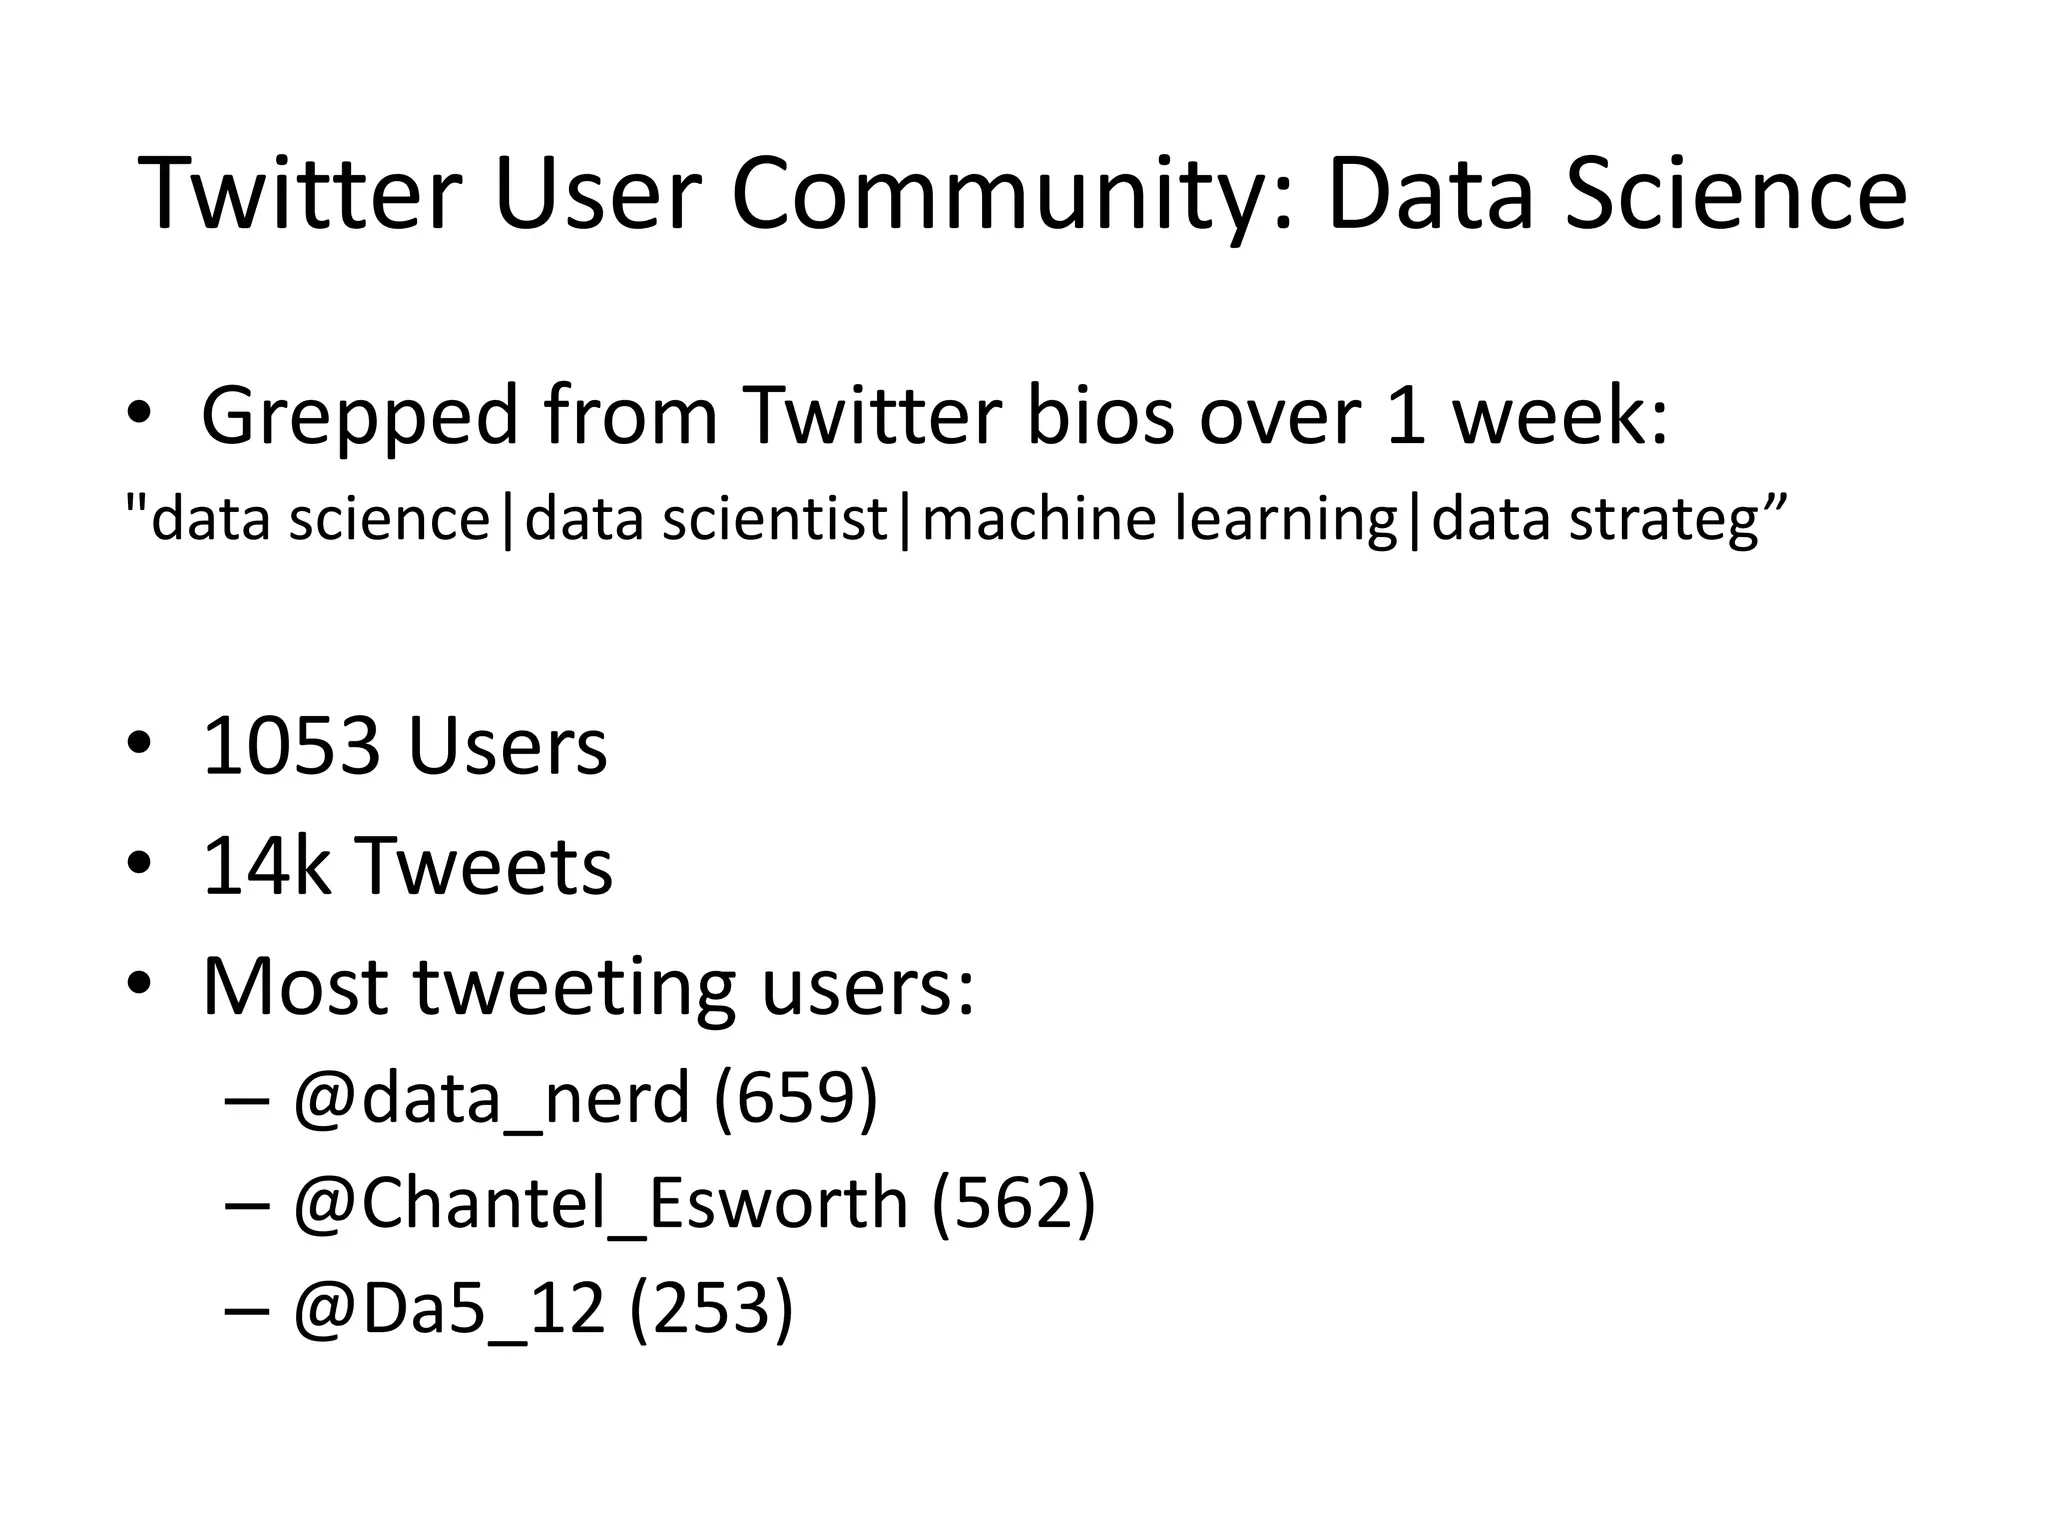
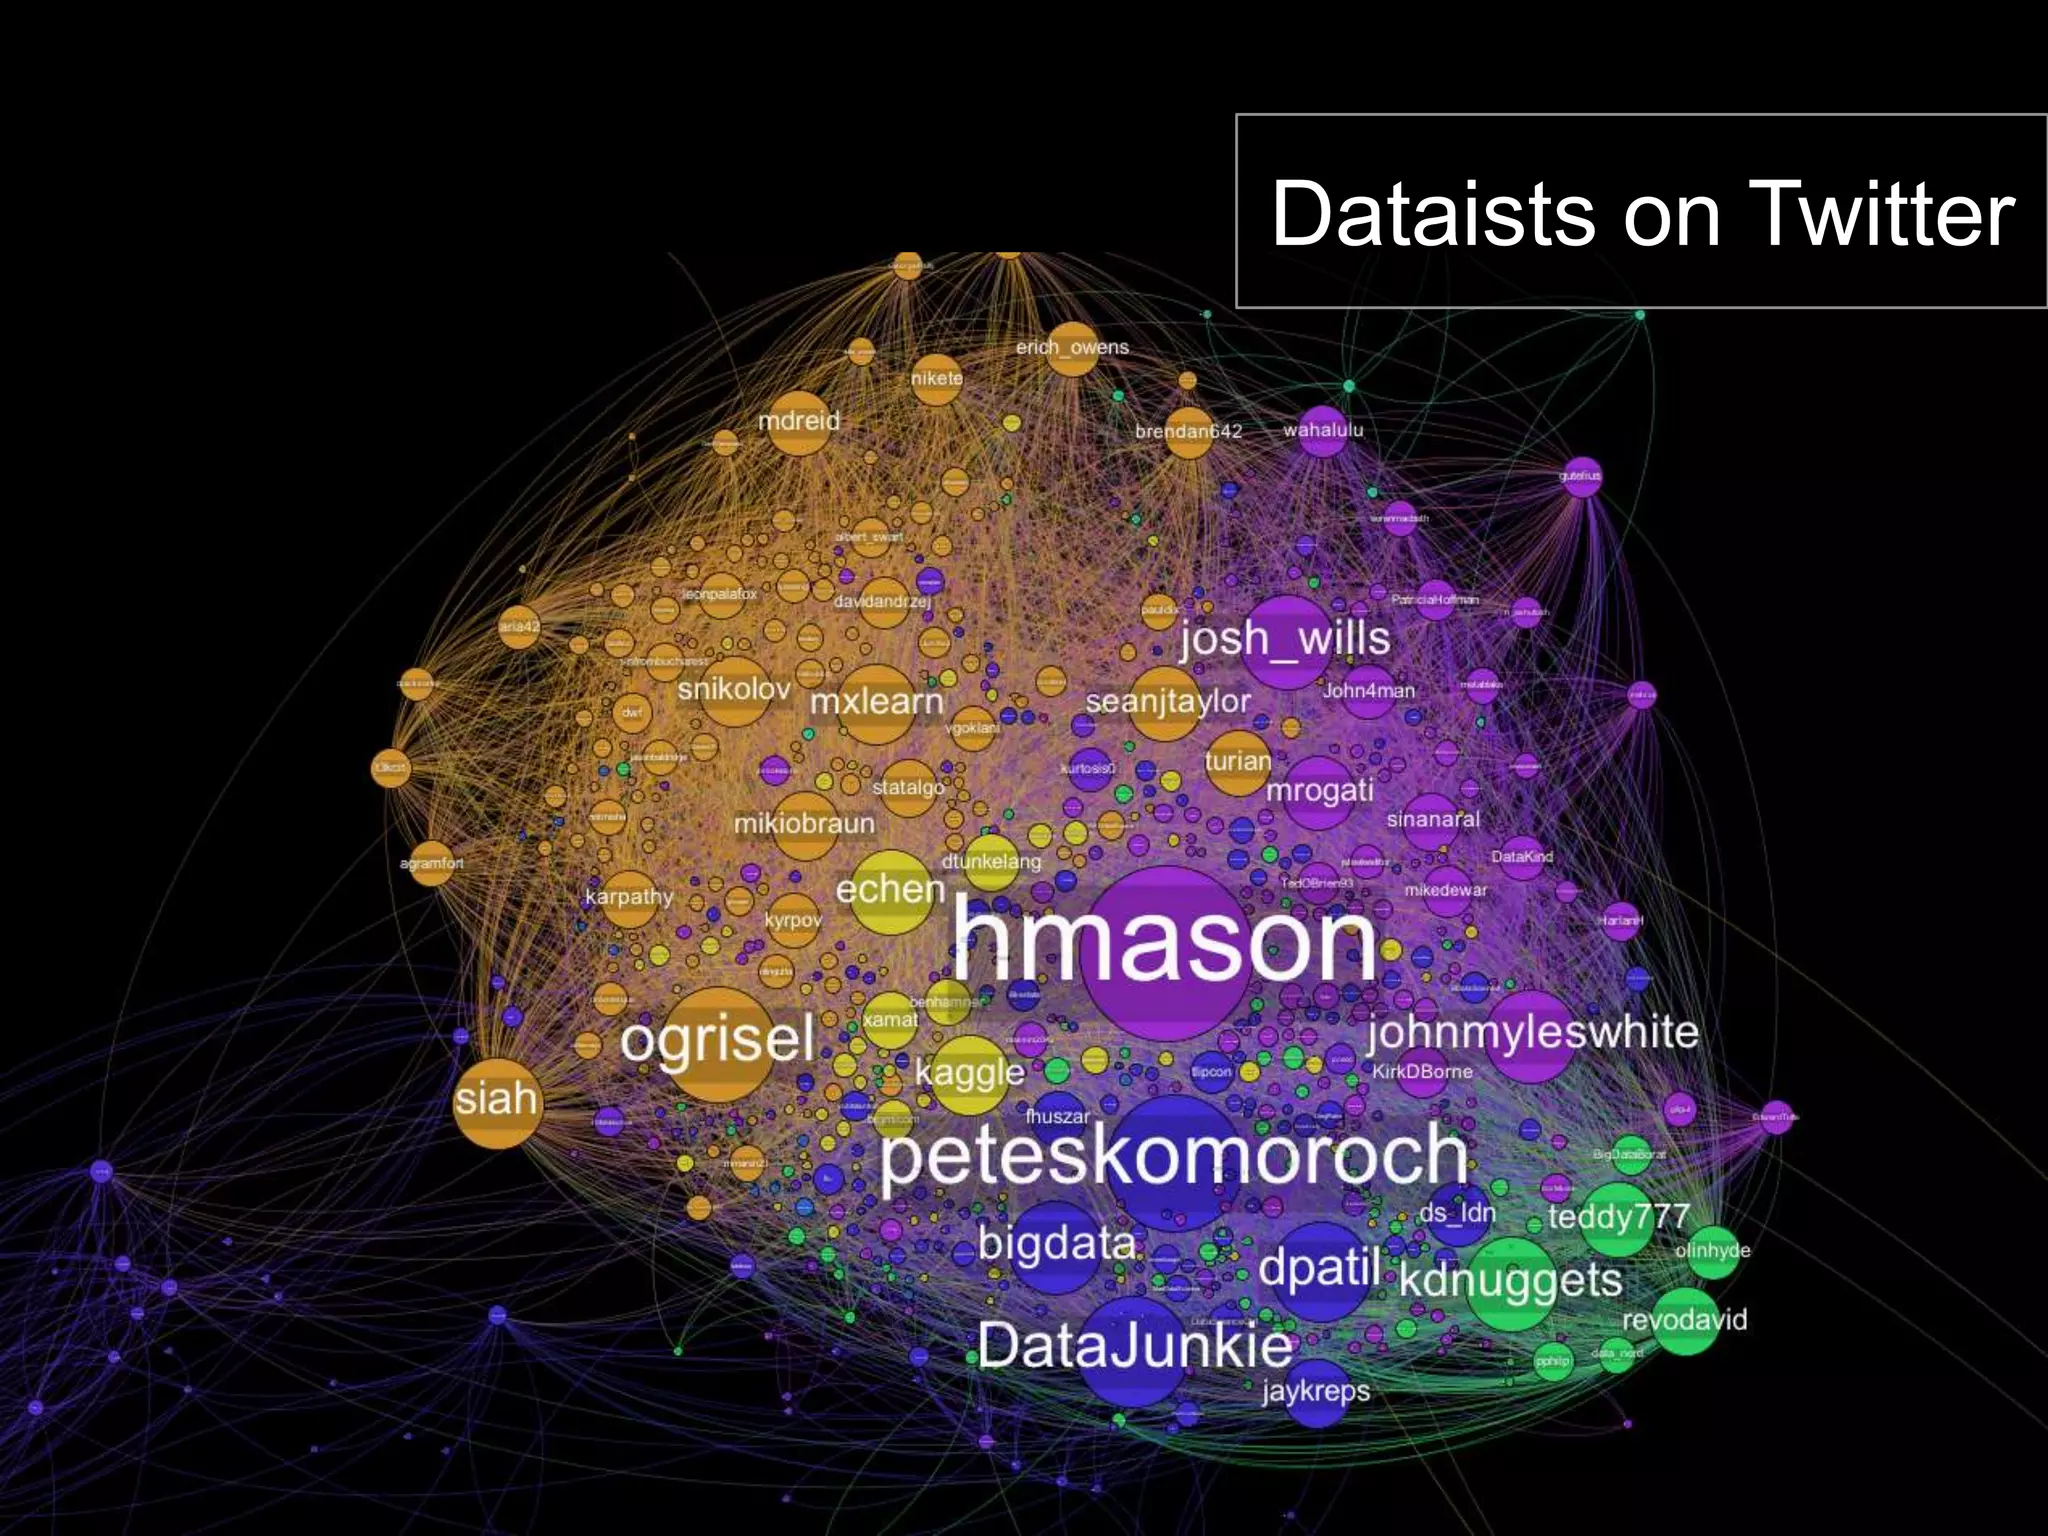
![[20140830, Pycon2014] NetworkX를 이용한 네트워크 분석](https://cdn.slidesharecdn.com/ss_thumbnails/20140830pyconnetworkx-140830071831-phpapp01-thumbnail.jpg?width=640&height=640&fit=bounds)

![Ch01 네트워크와+소켓+프로그래밍+[호환+모드]](https://cdn.slidesharecdn.com/ss_thumbnails/ch01-130506215541-phpapp01-thumbnail.jpg?width=640&height=640&fit=bounds)


![Vibe Coding vs. Spec-Driven Development [Free Meetup]](https://cdn.slidesharecdn.com/ss_thumbnails/vibecodingvsspecdrivendevelopment-251209105622-43f455e7-thumbnail.jpg?width=640&height=640&fit=bounds)


