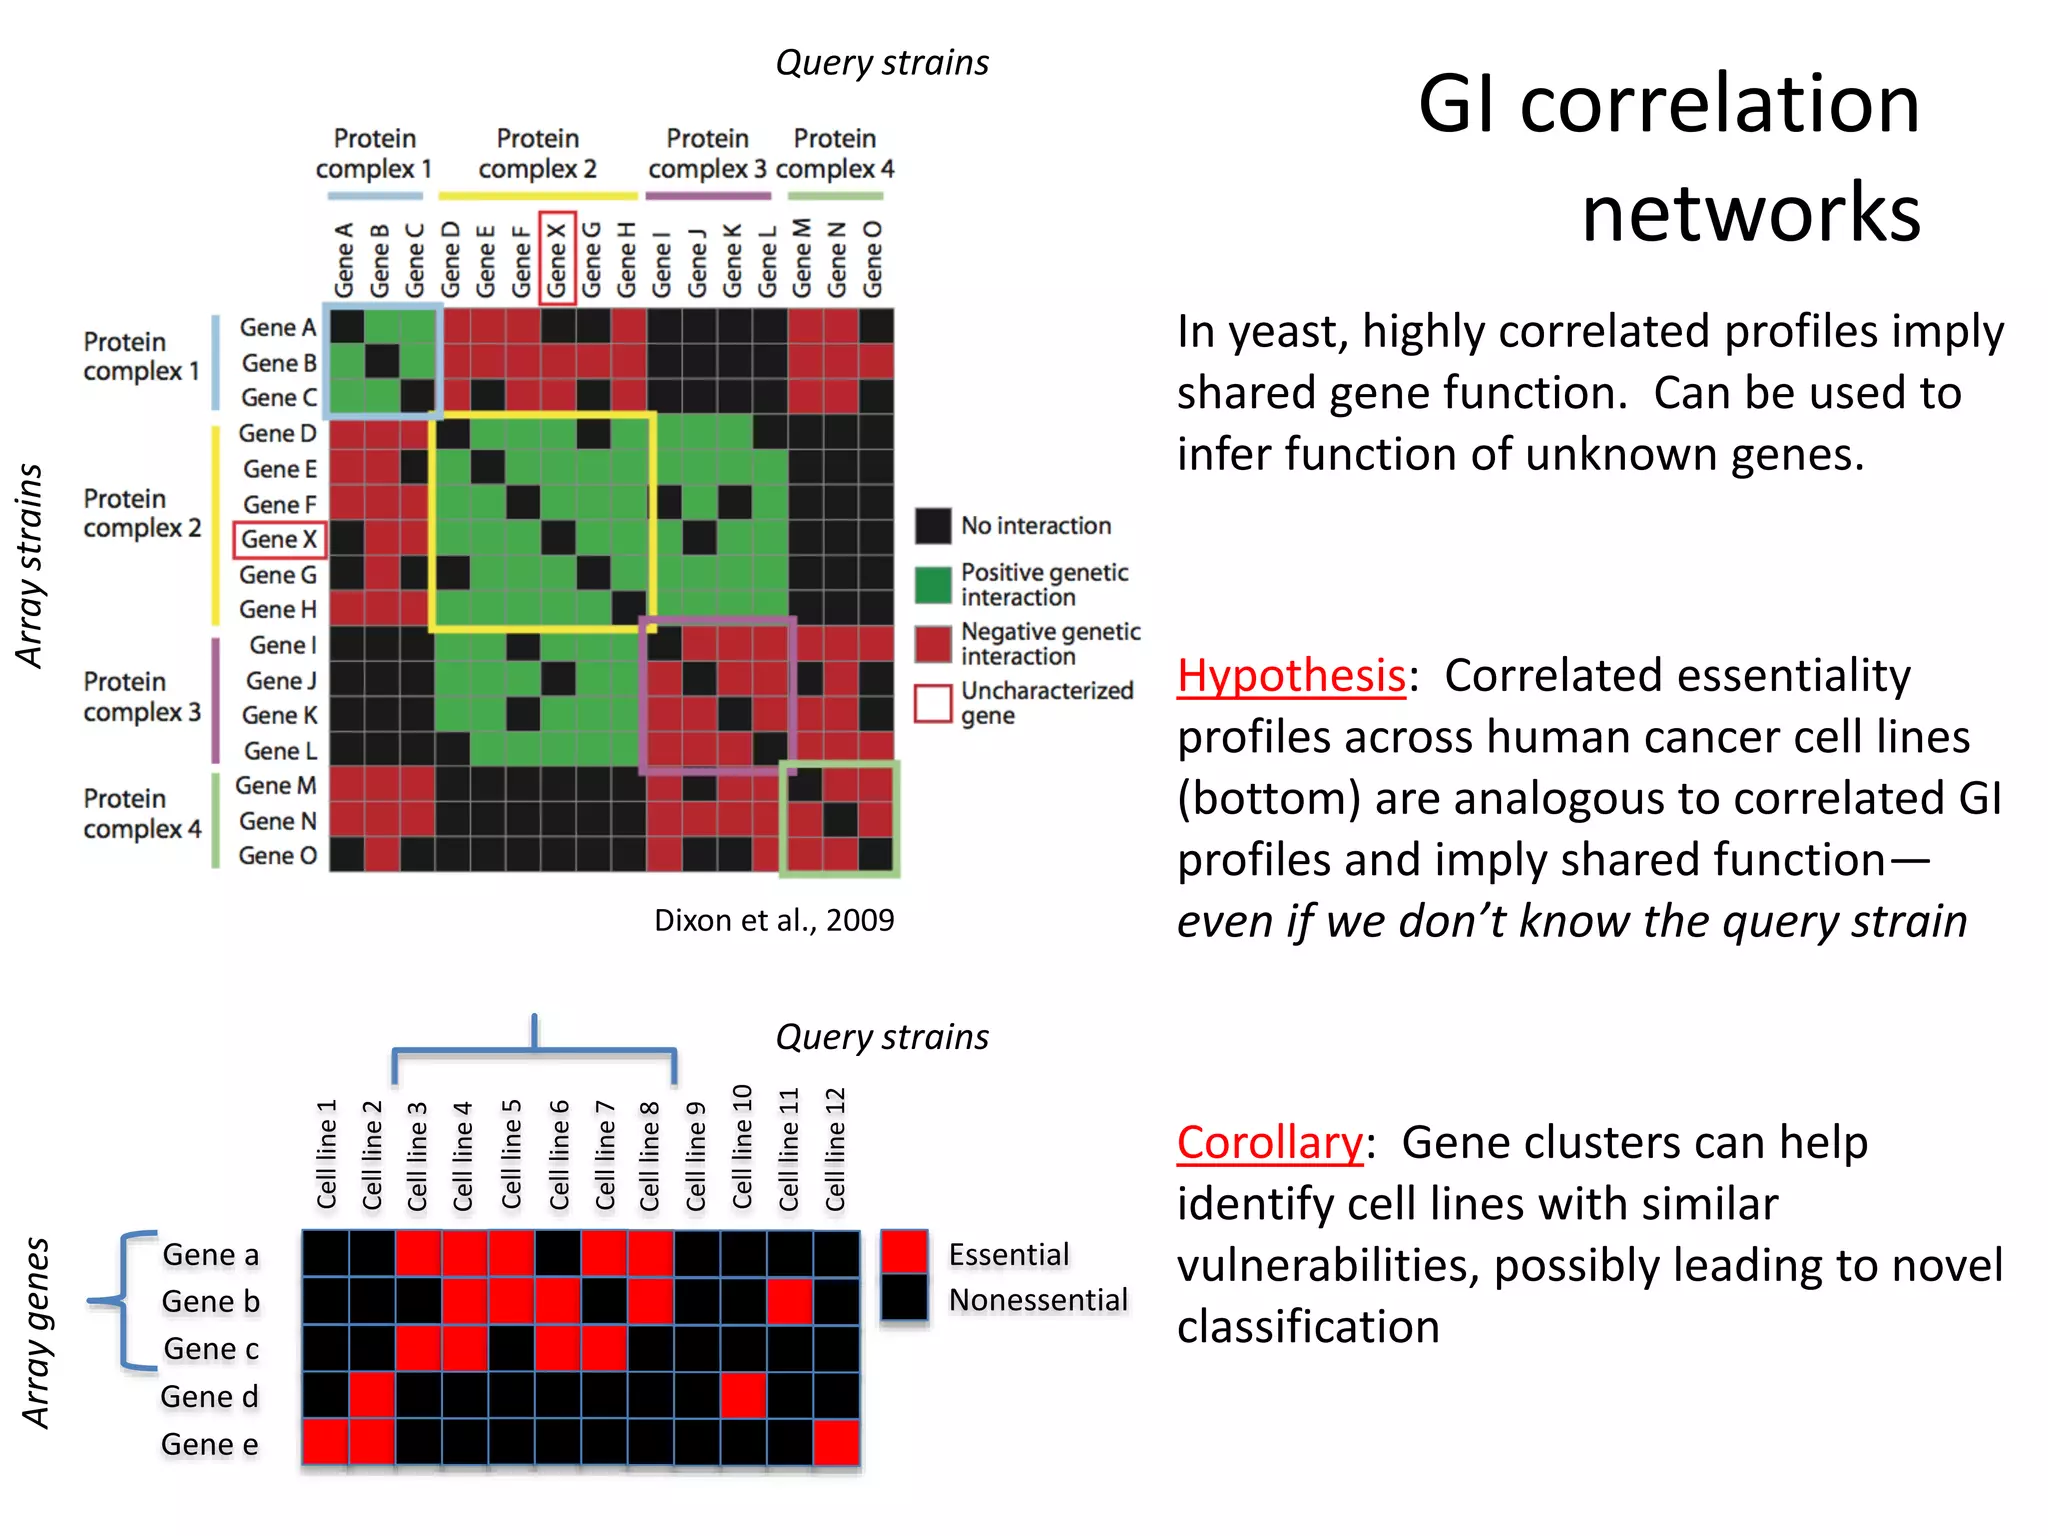
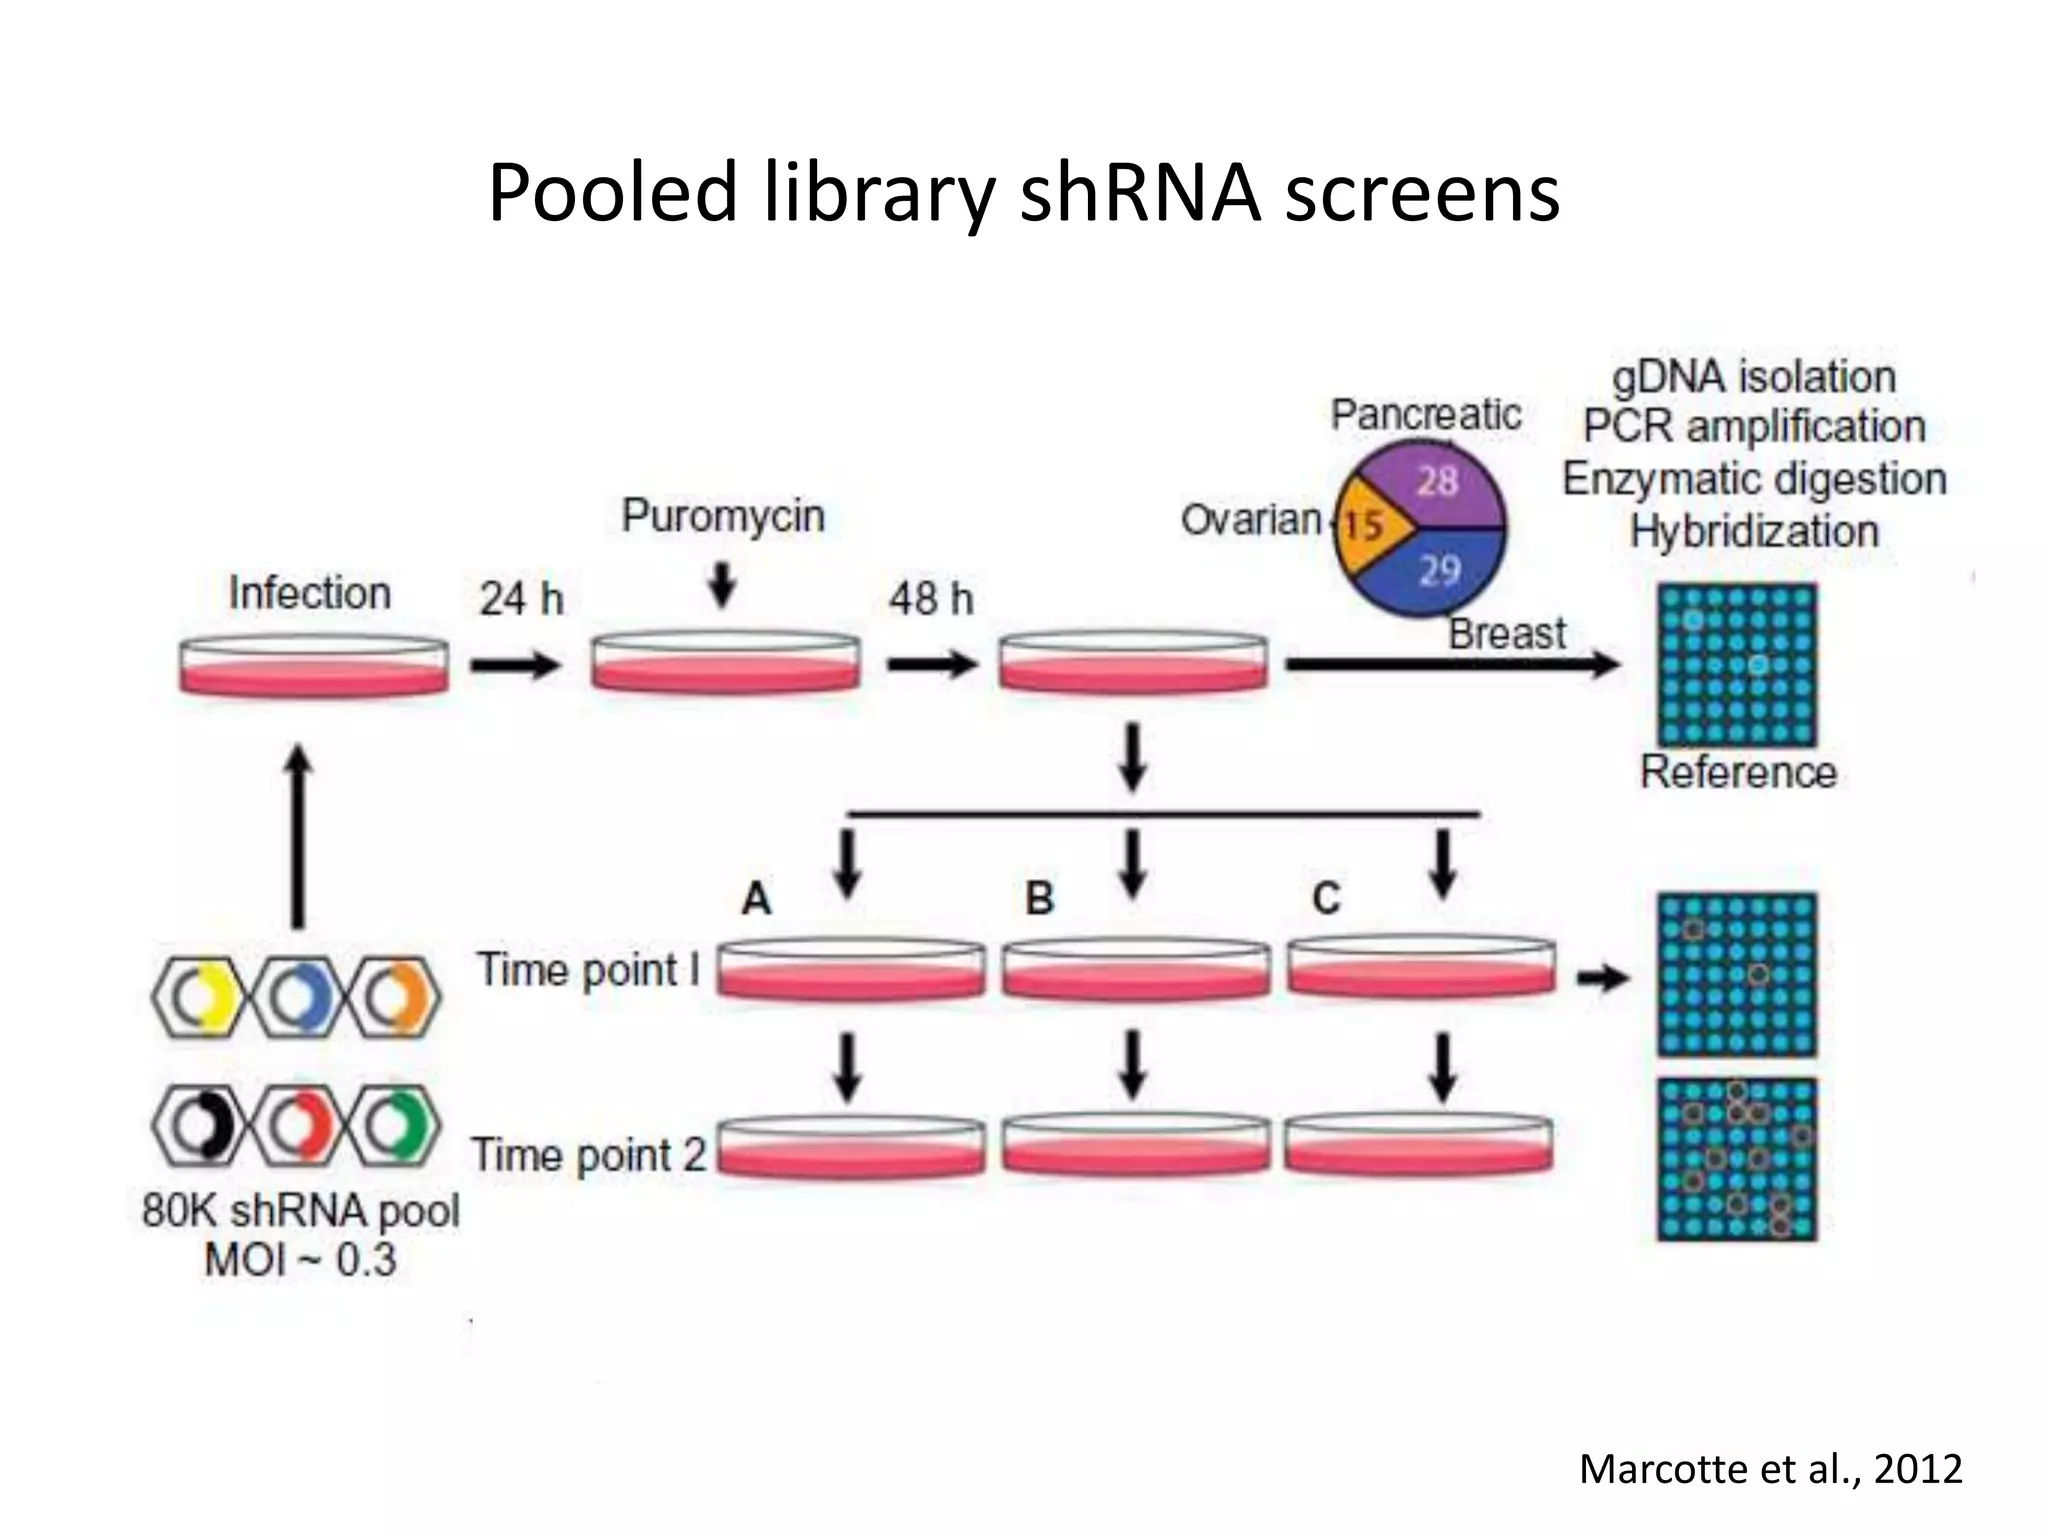
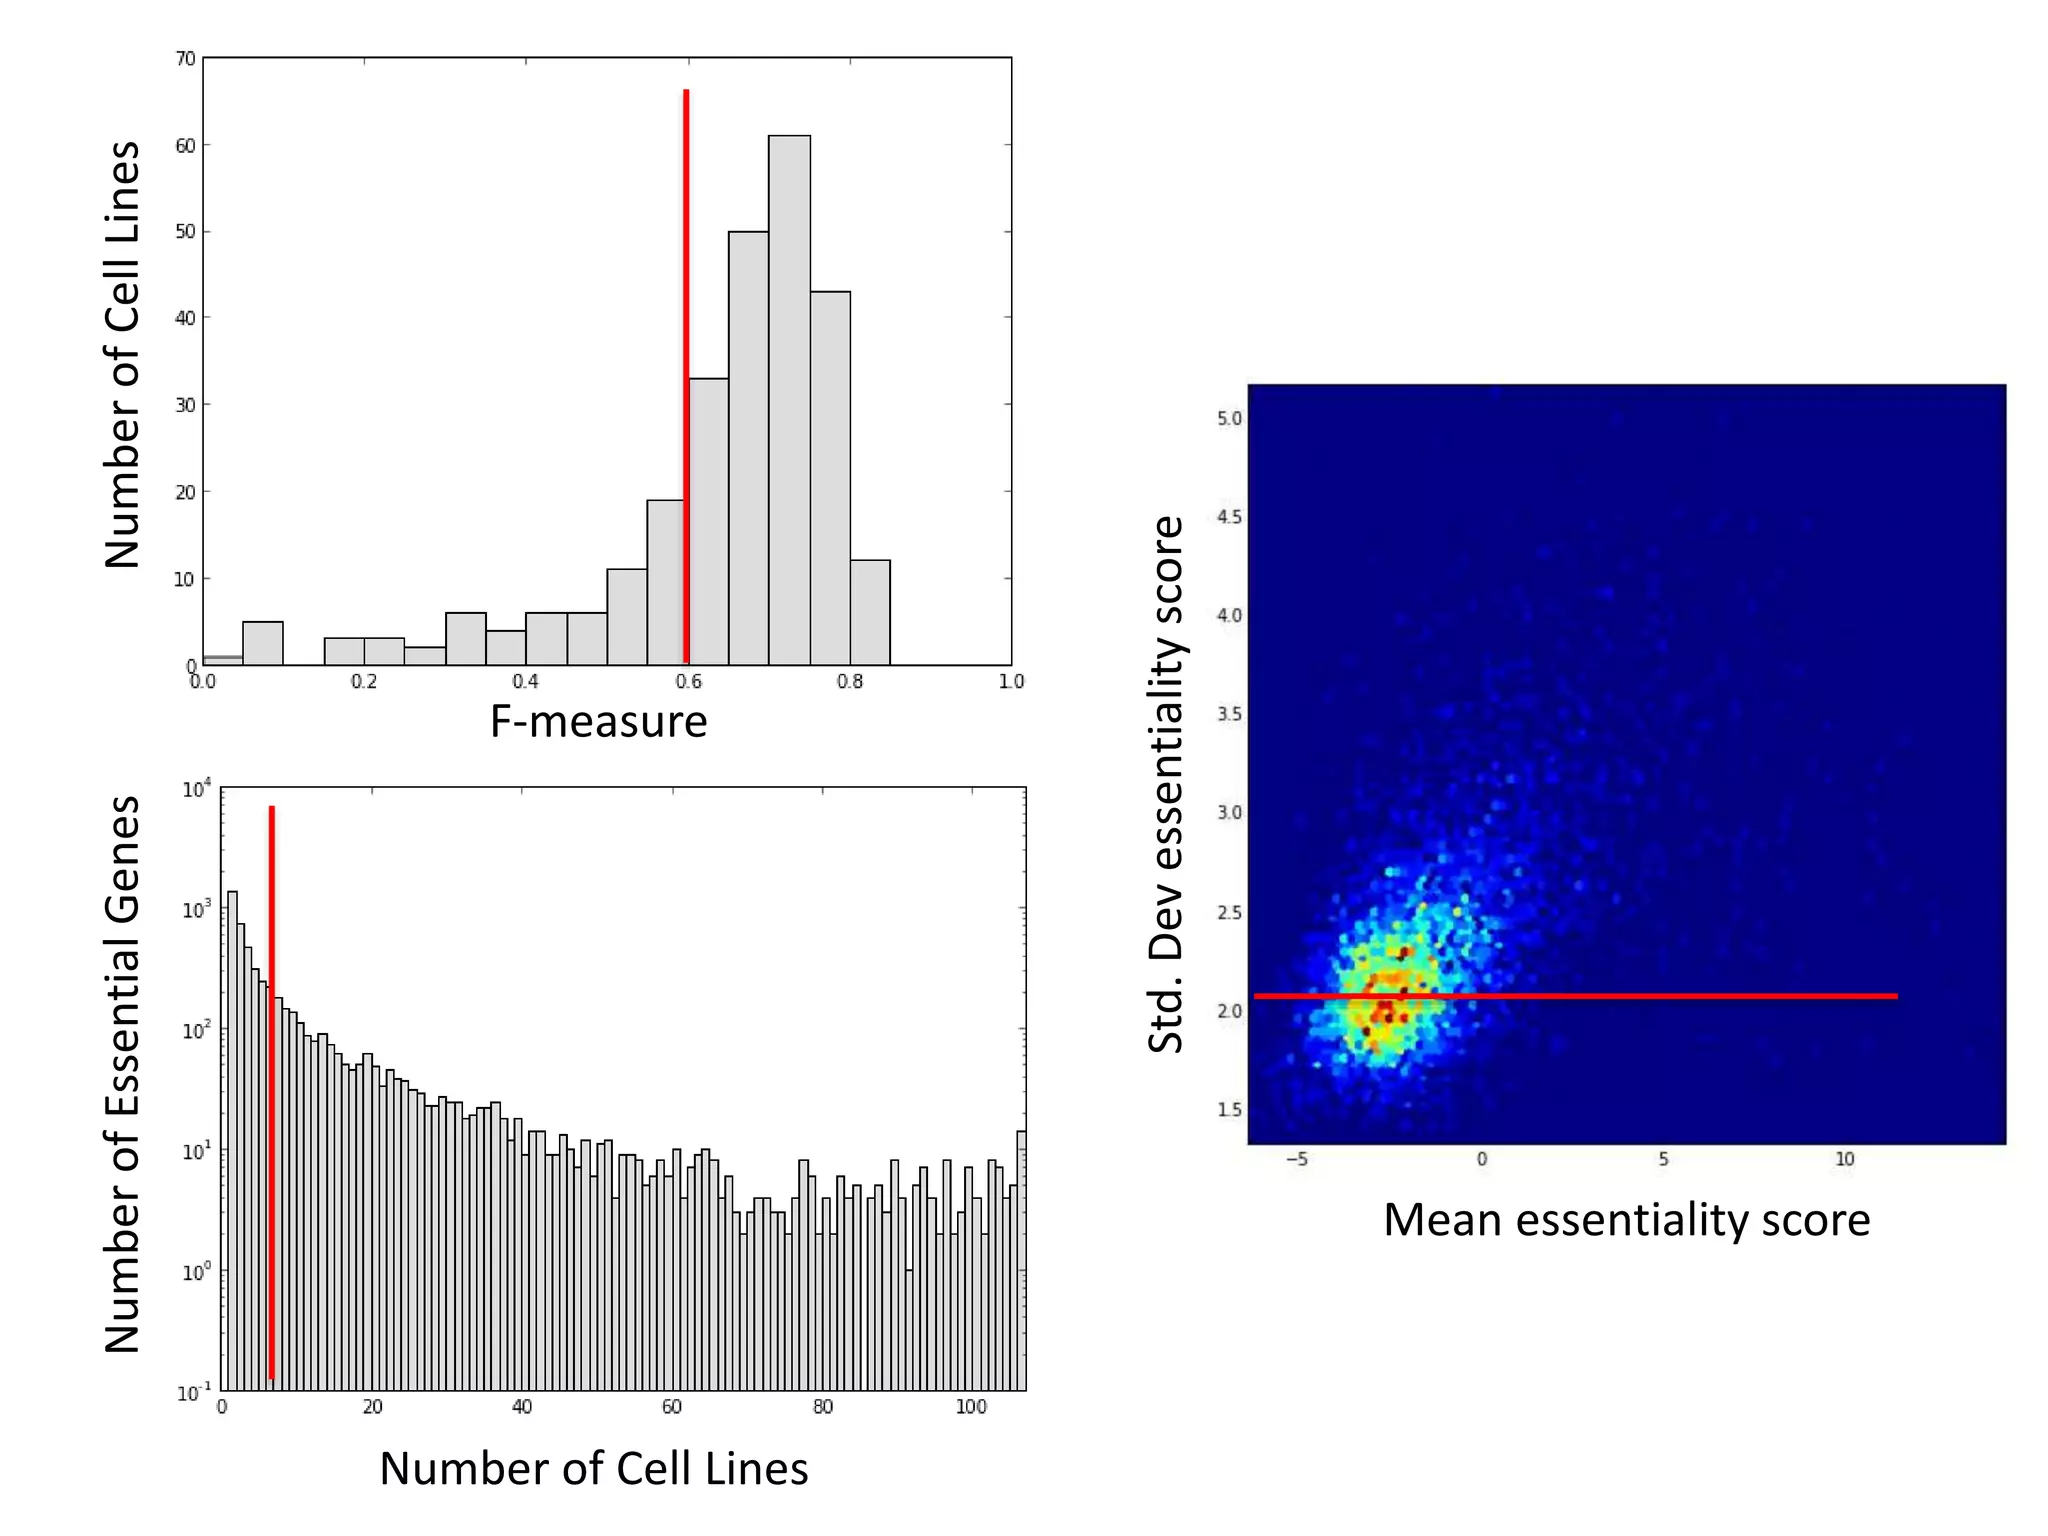
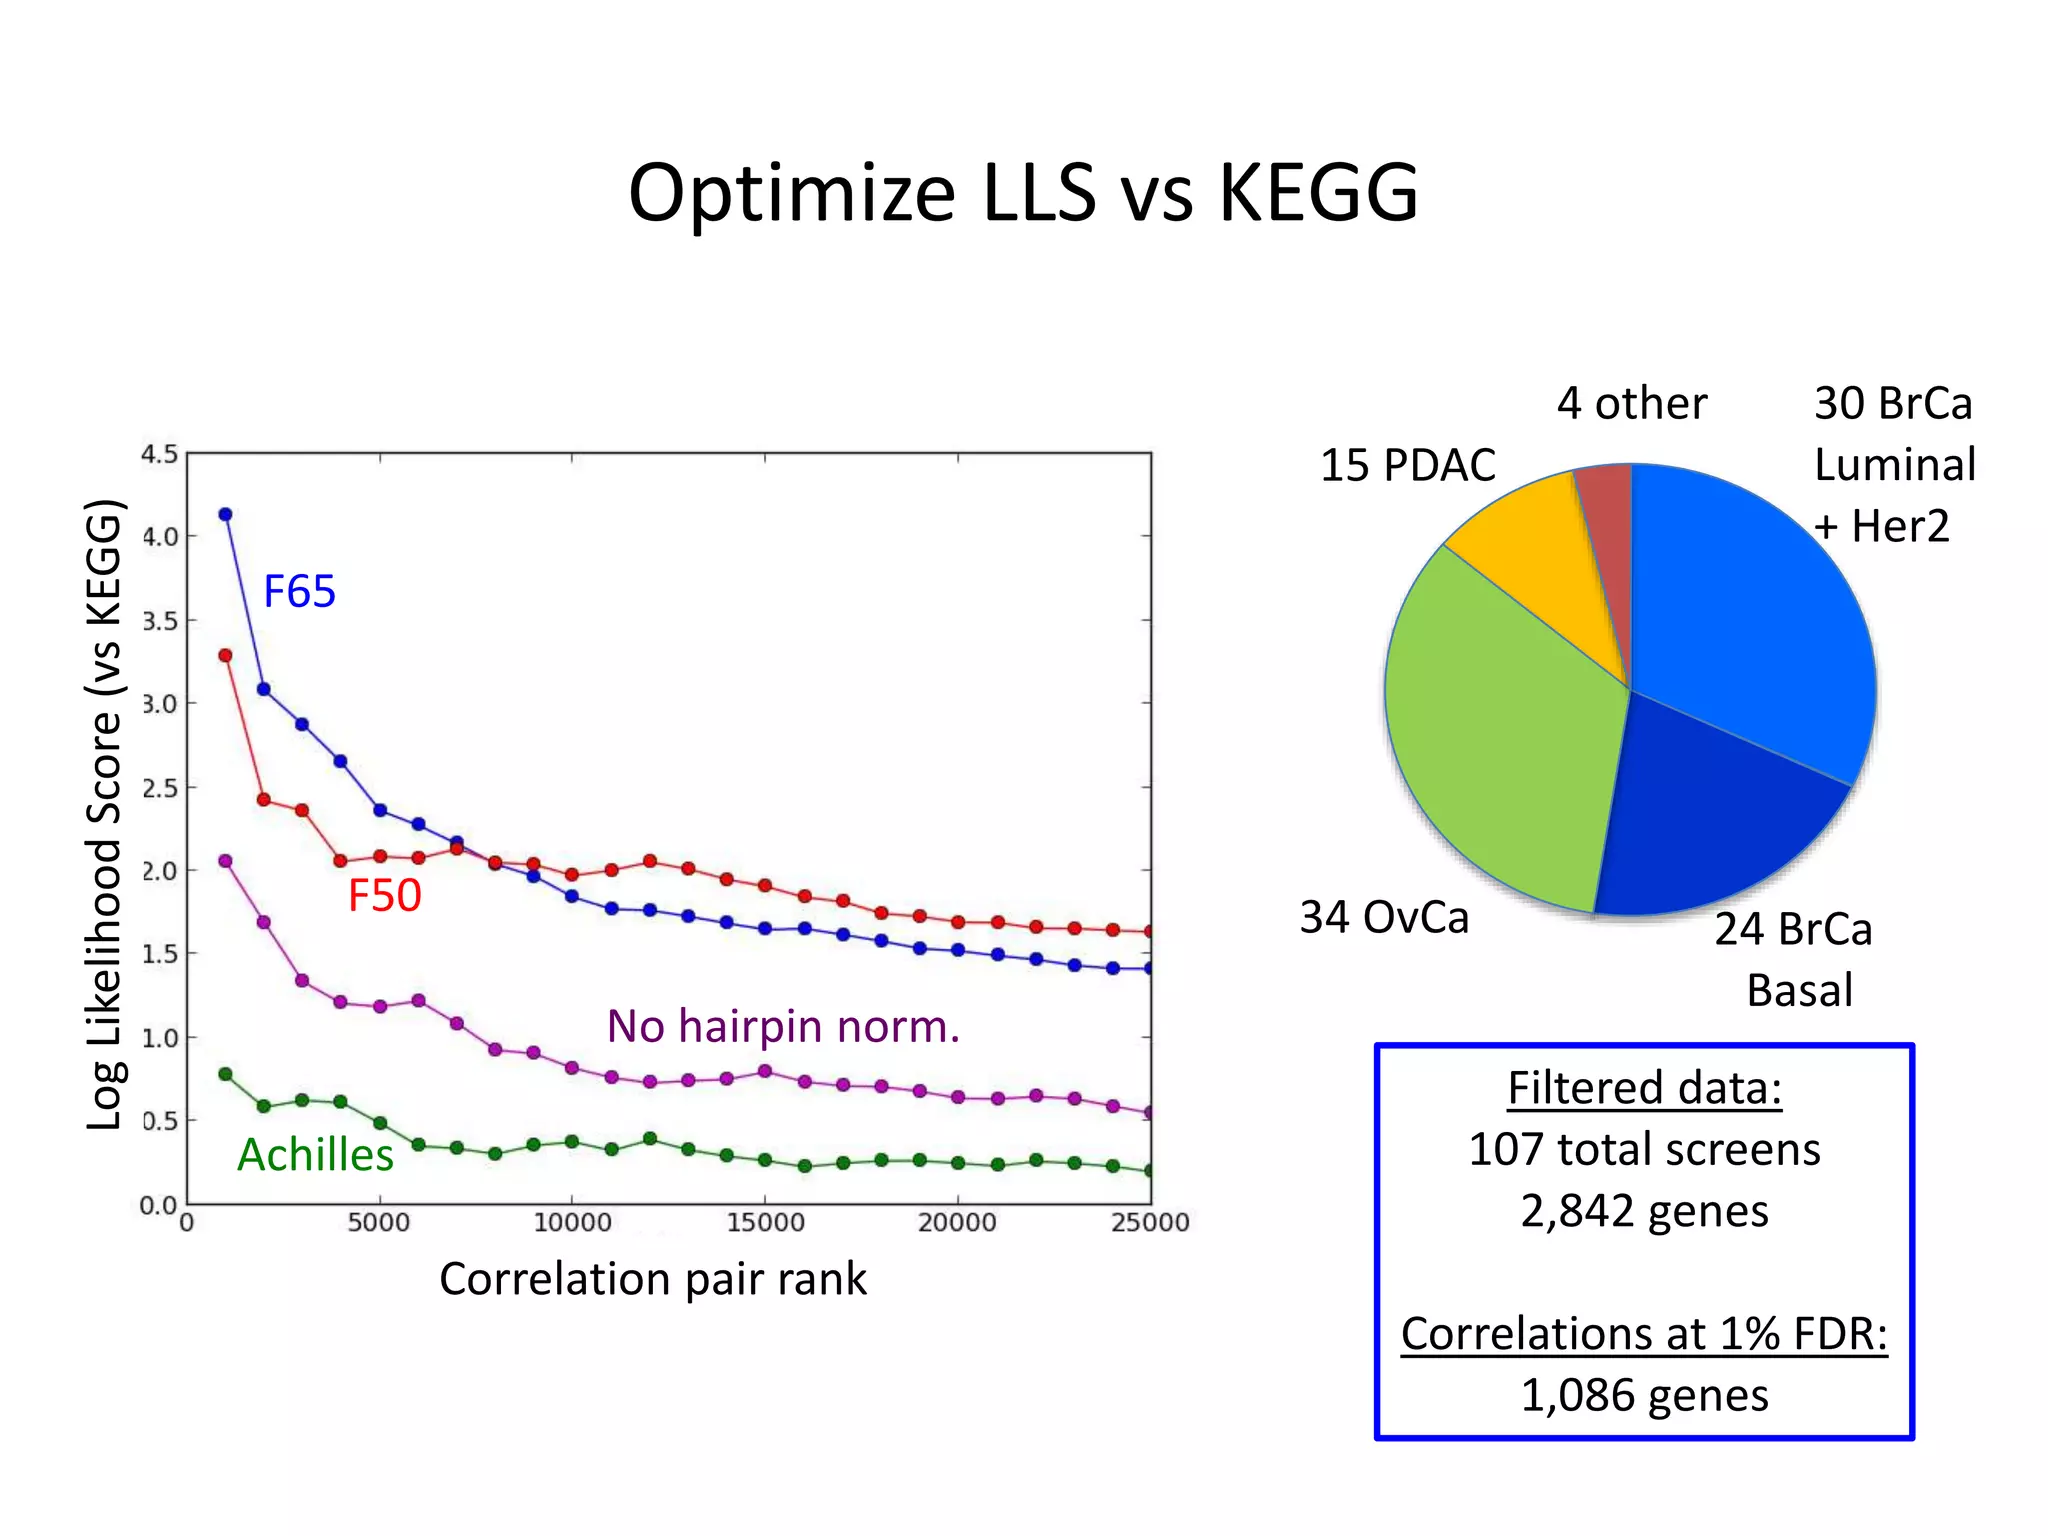
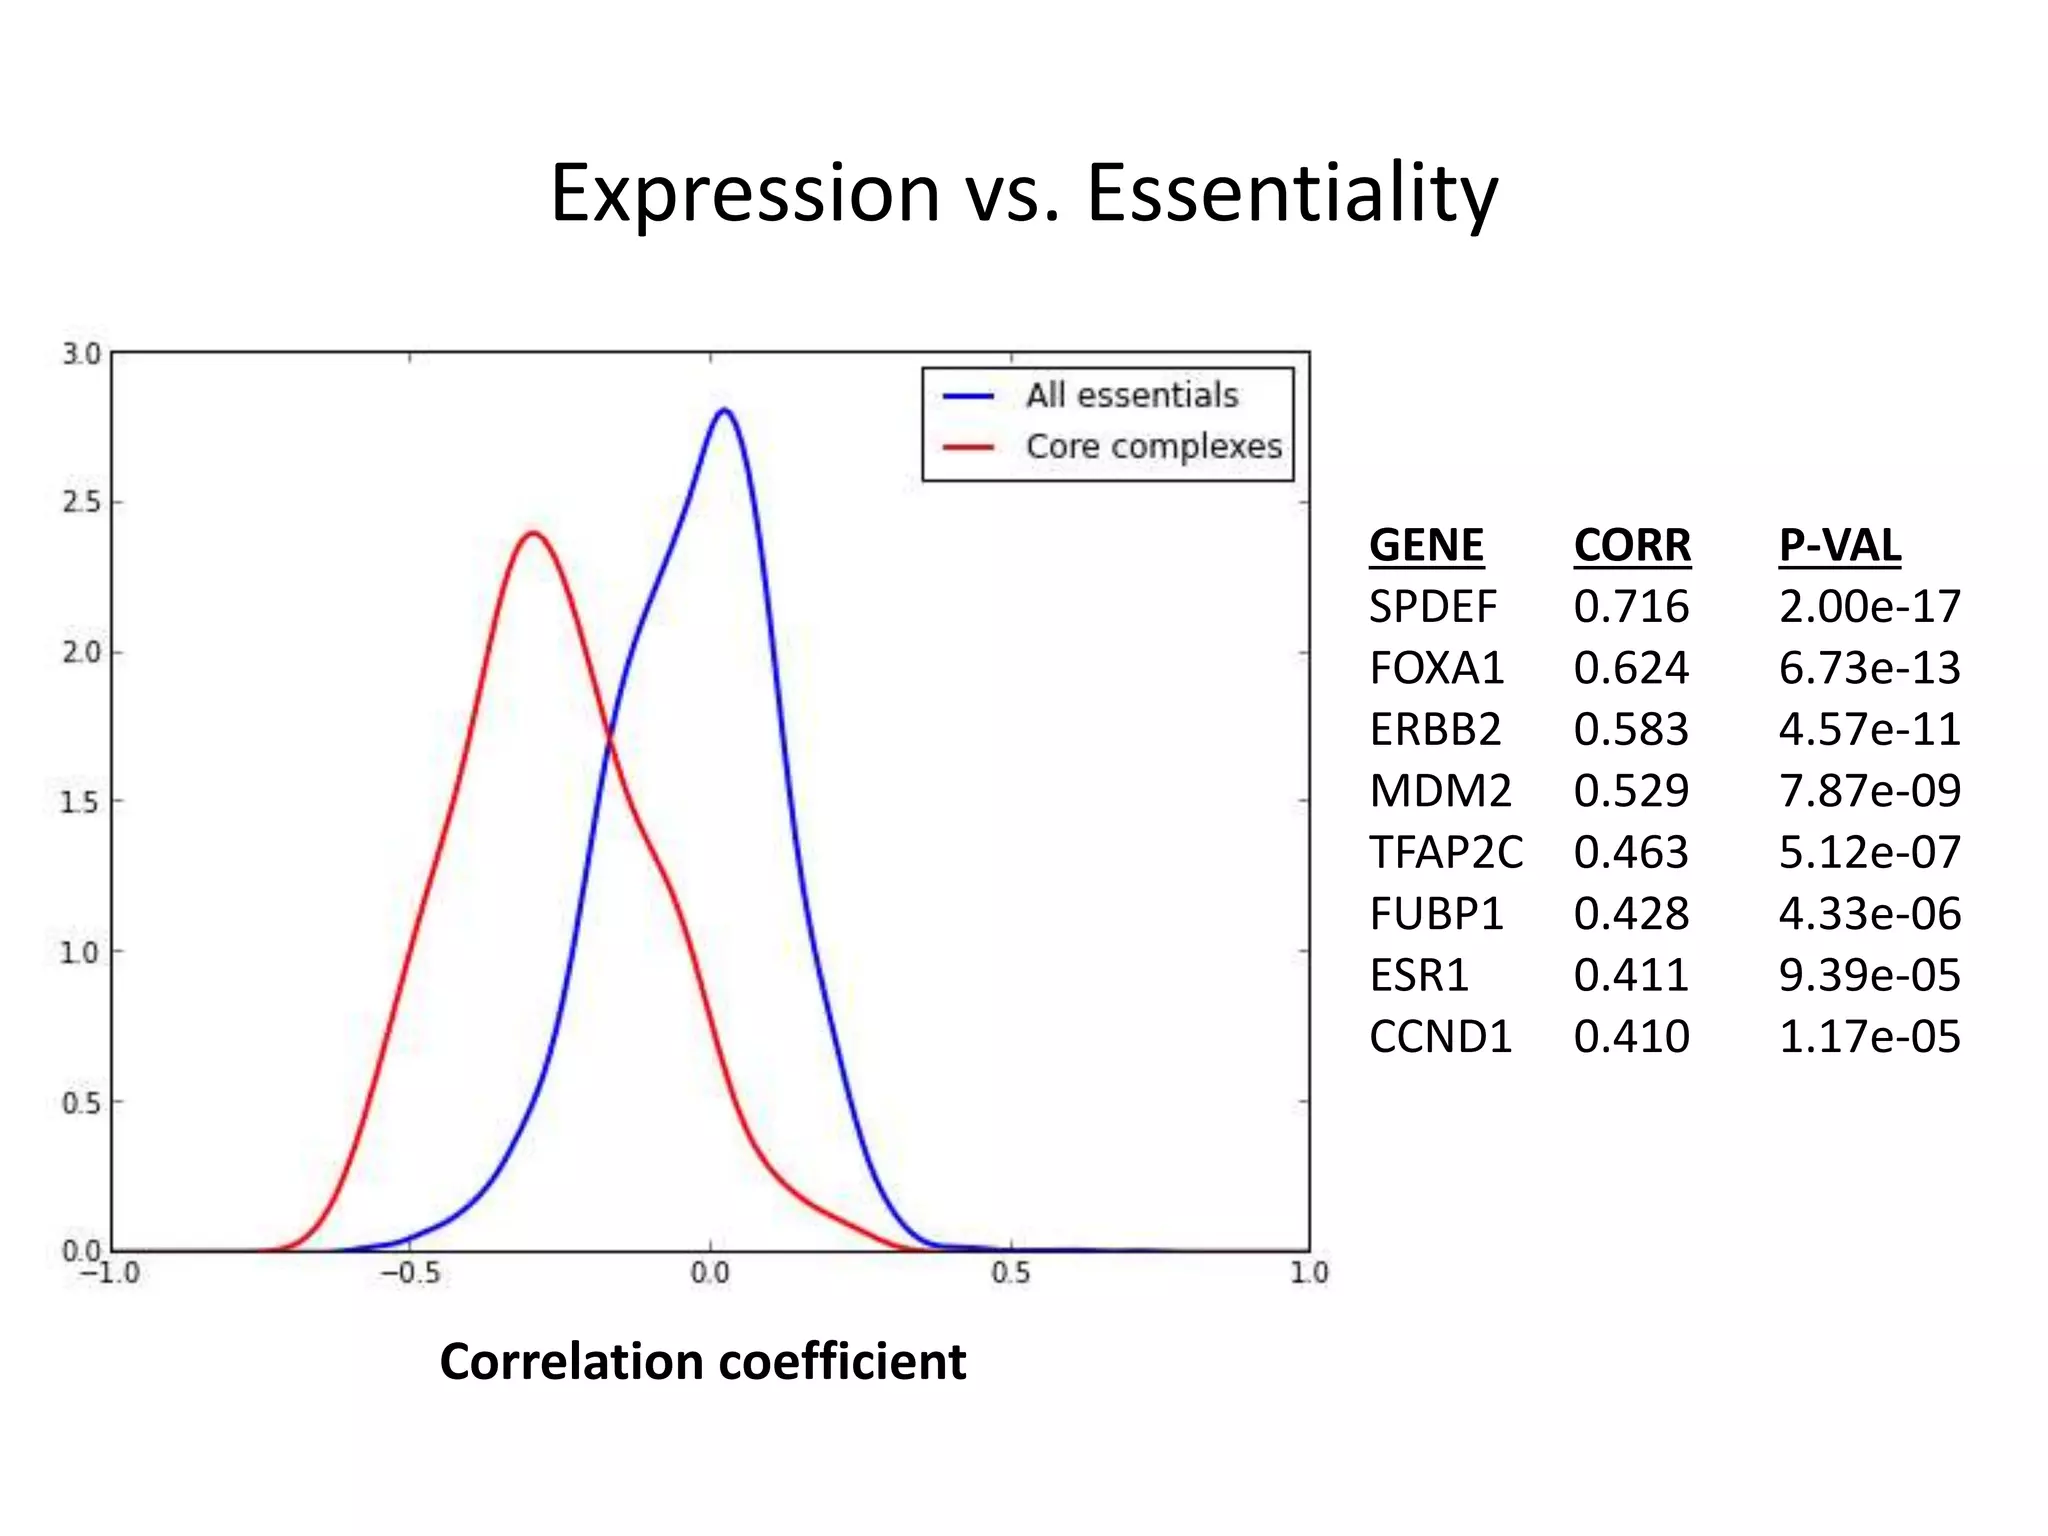
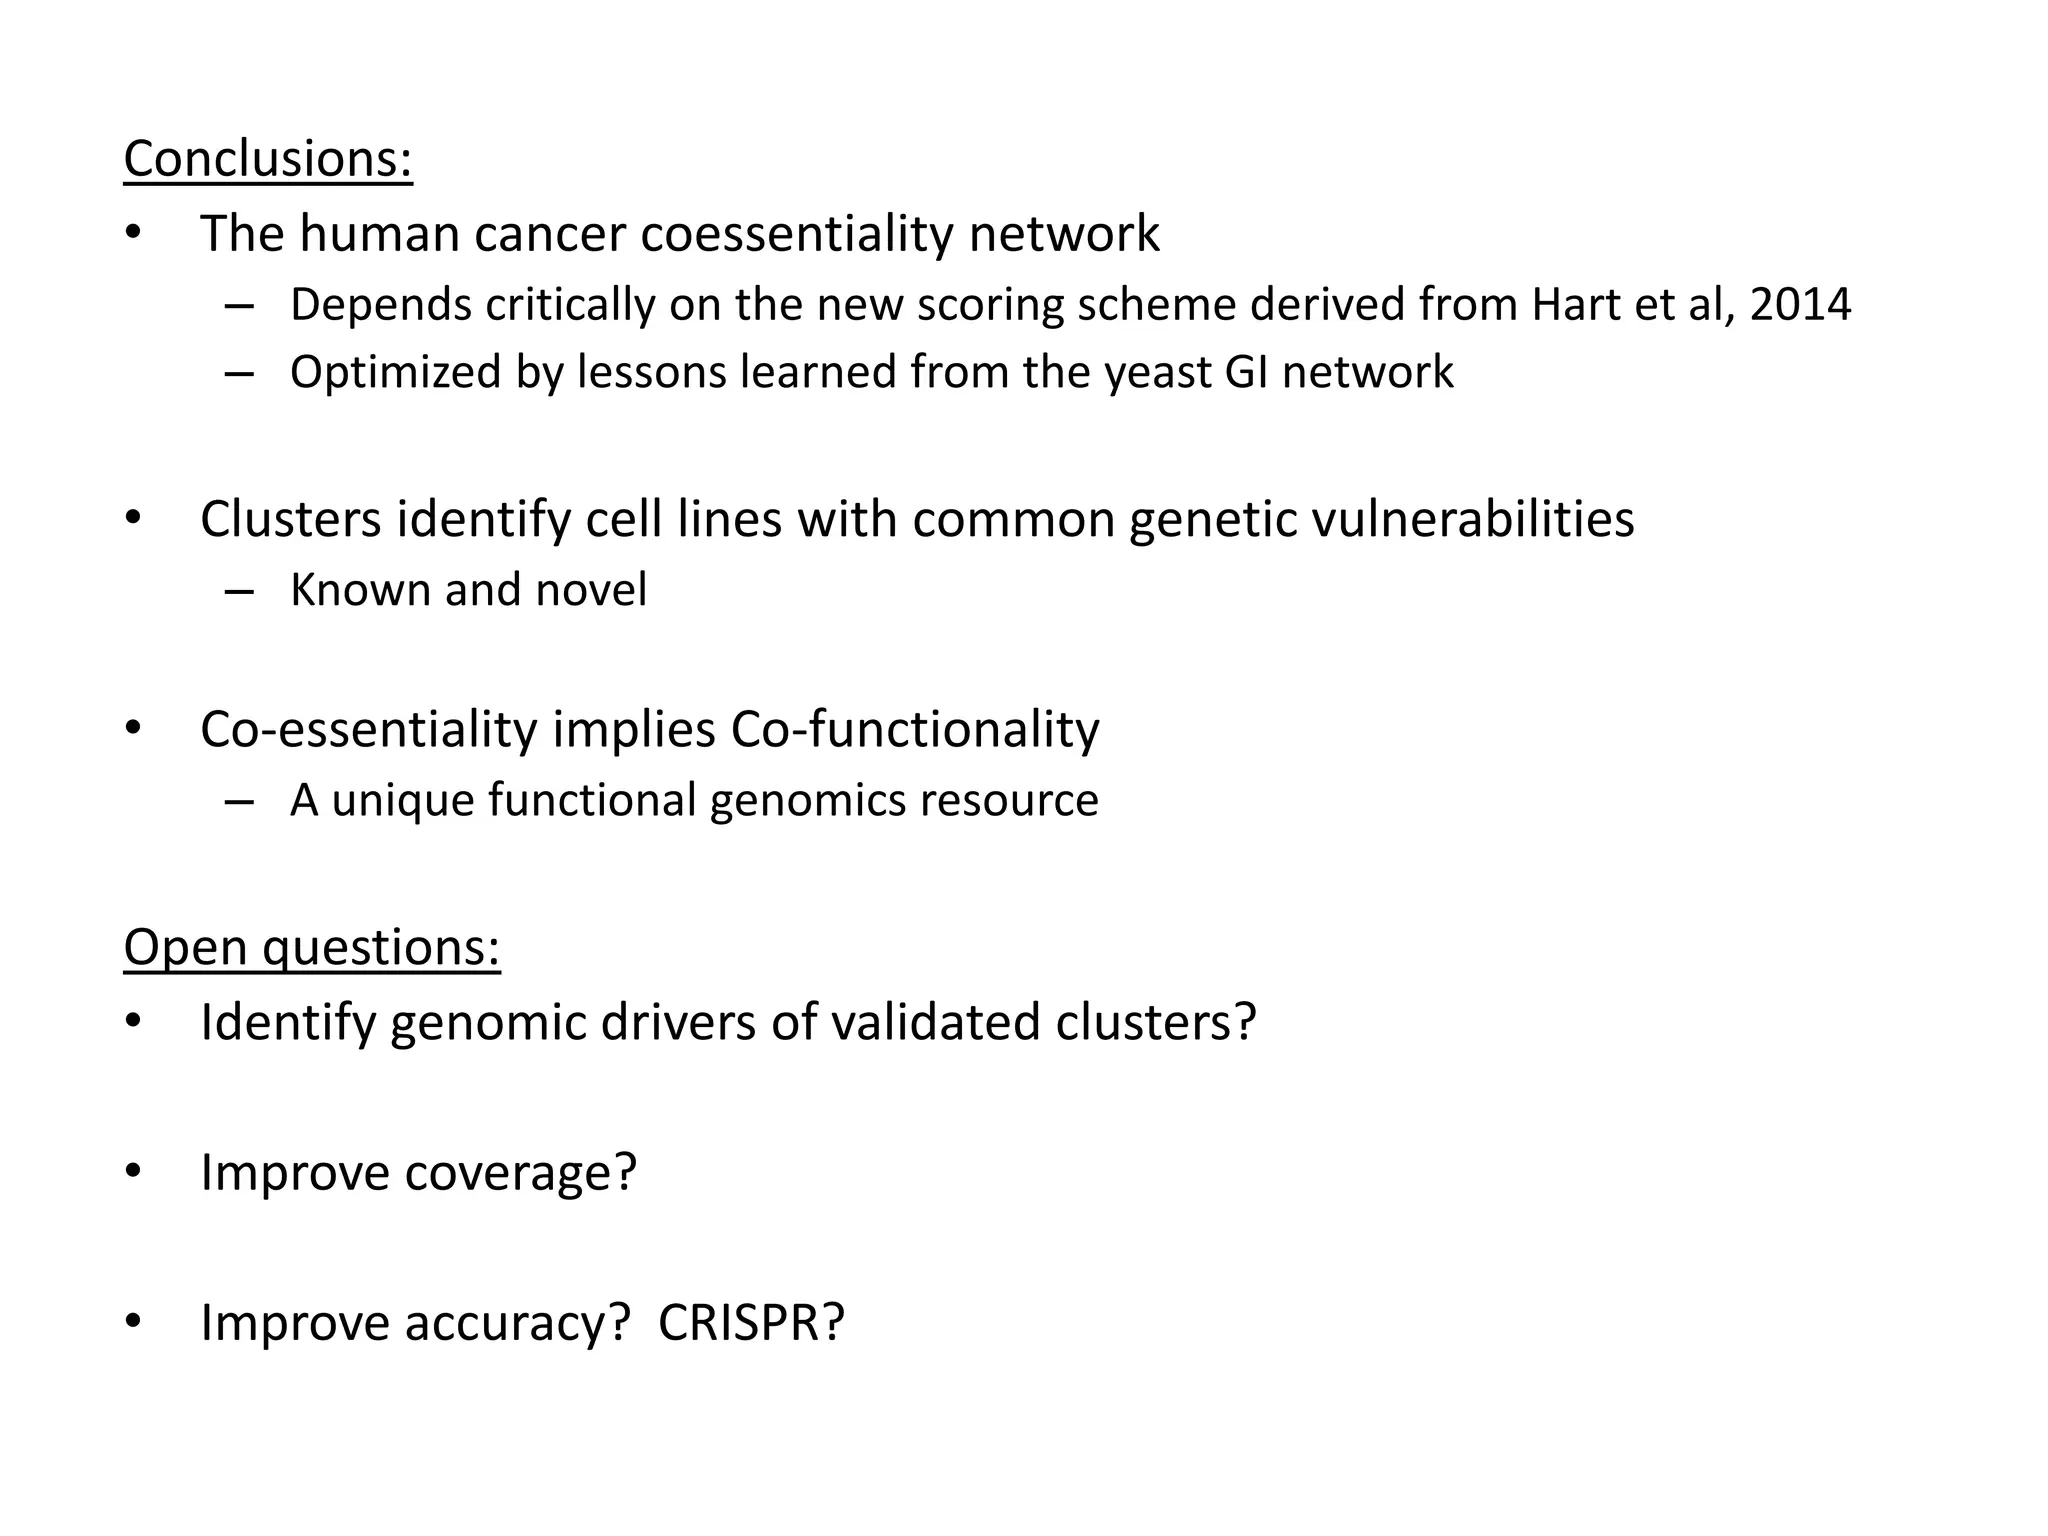
This document summarizes research on developing a human cancer coessentiality network using data from pooled shRNA screens across 107 cancer cell lines. Key points:
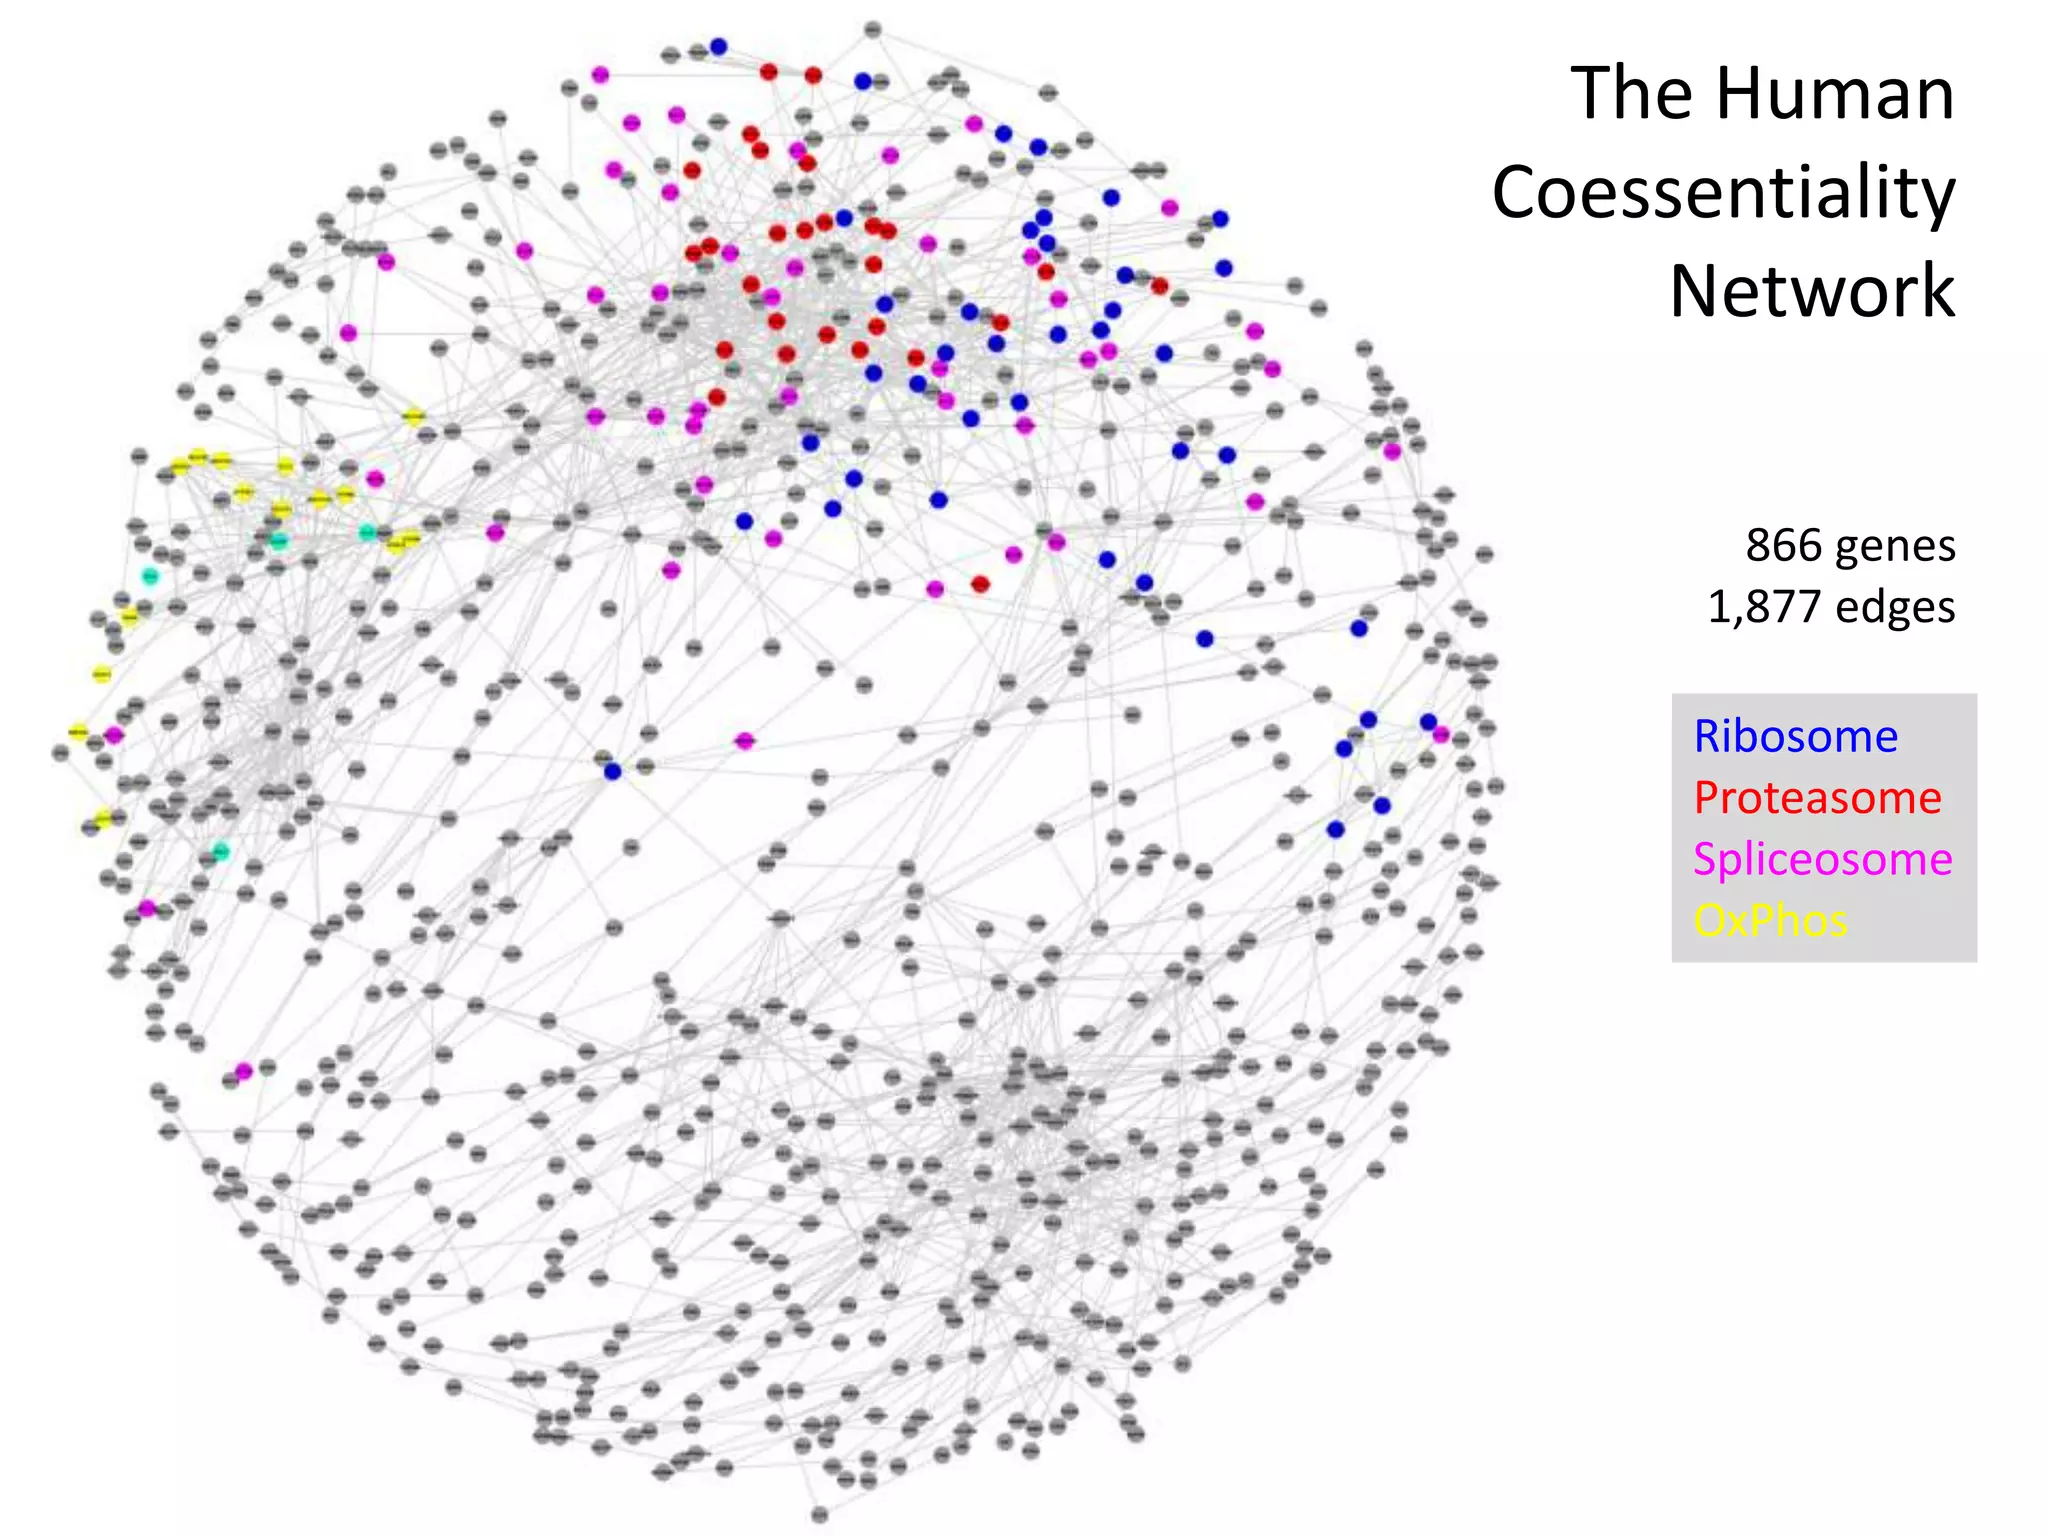
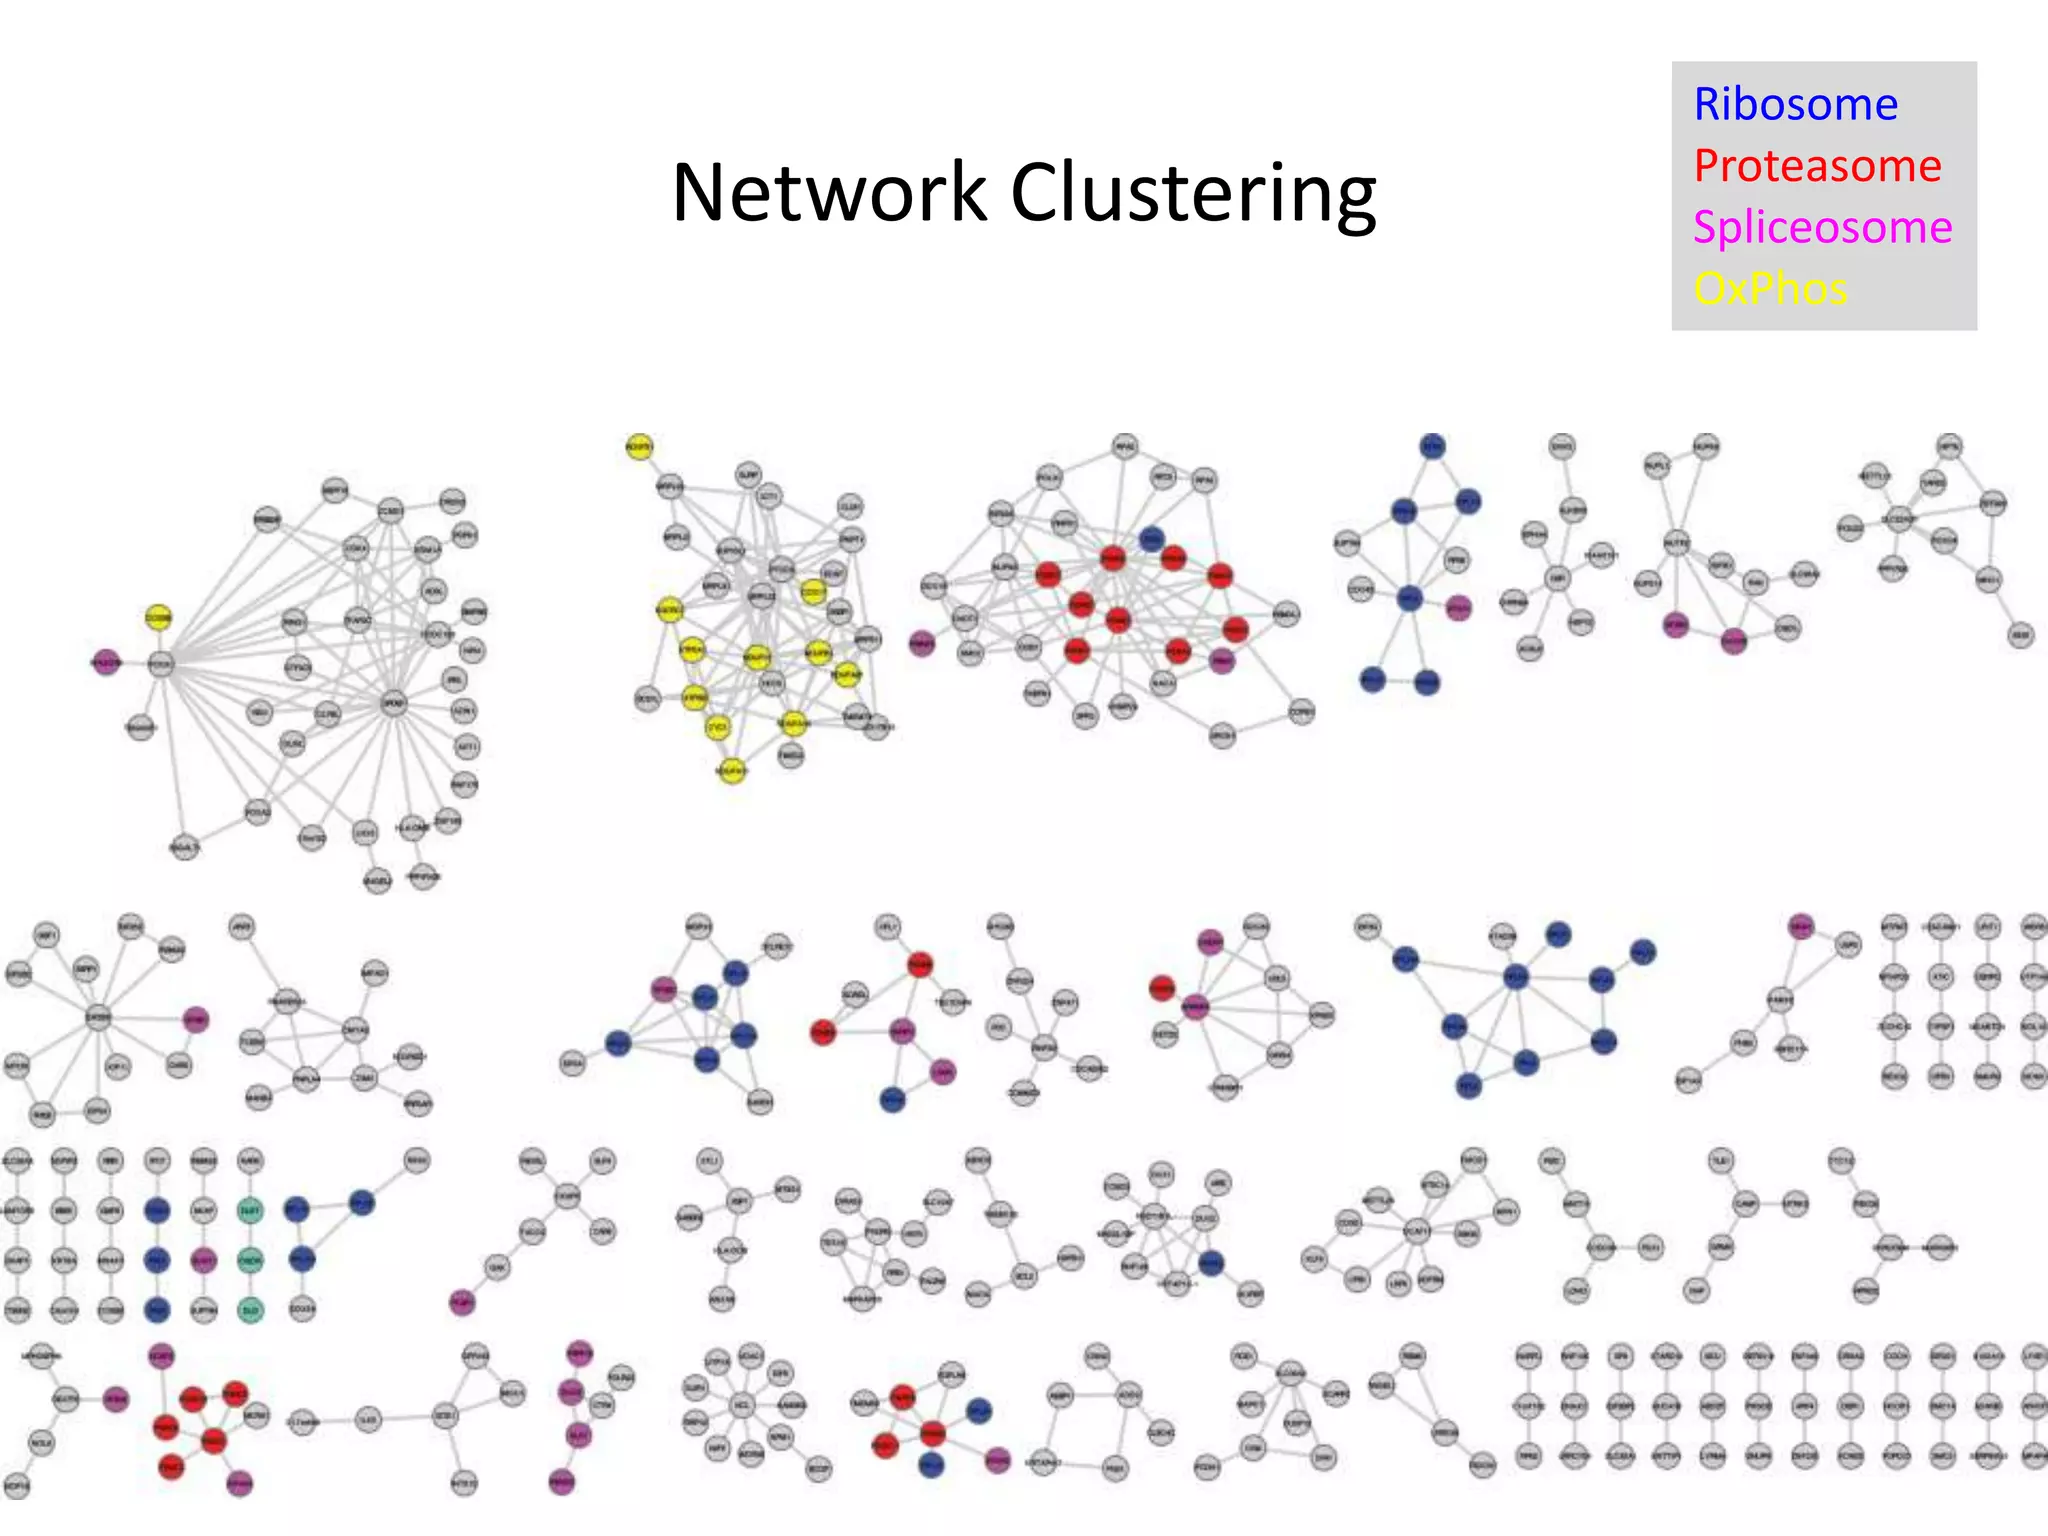
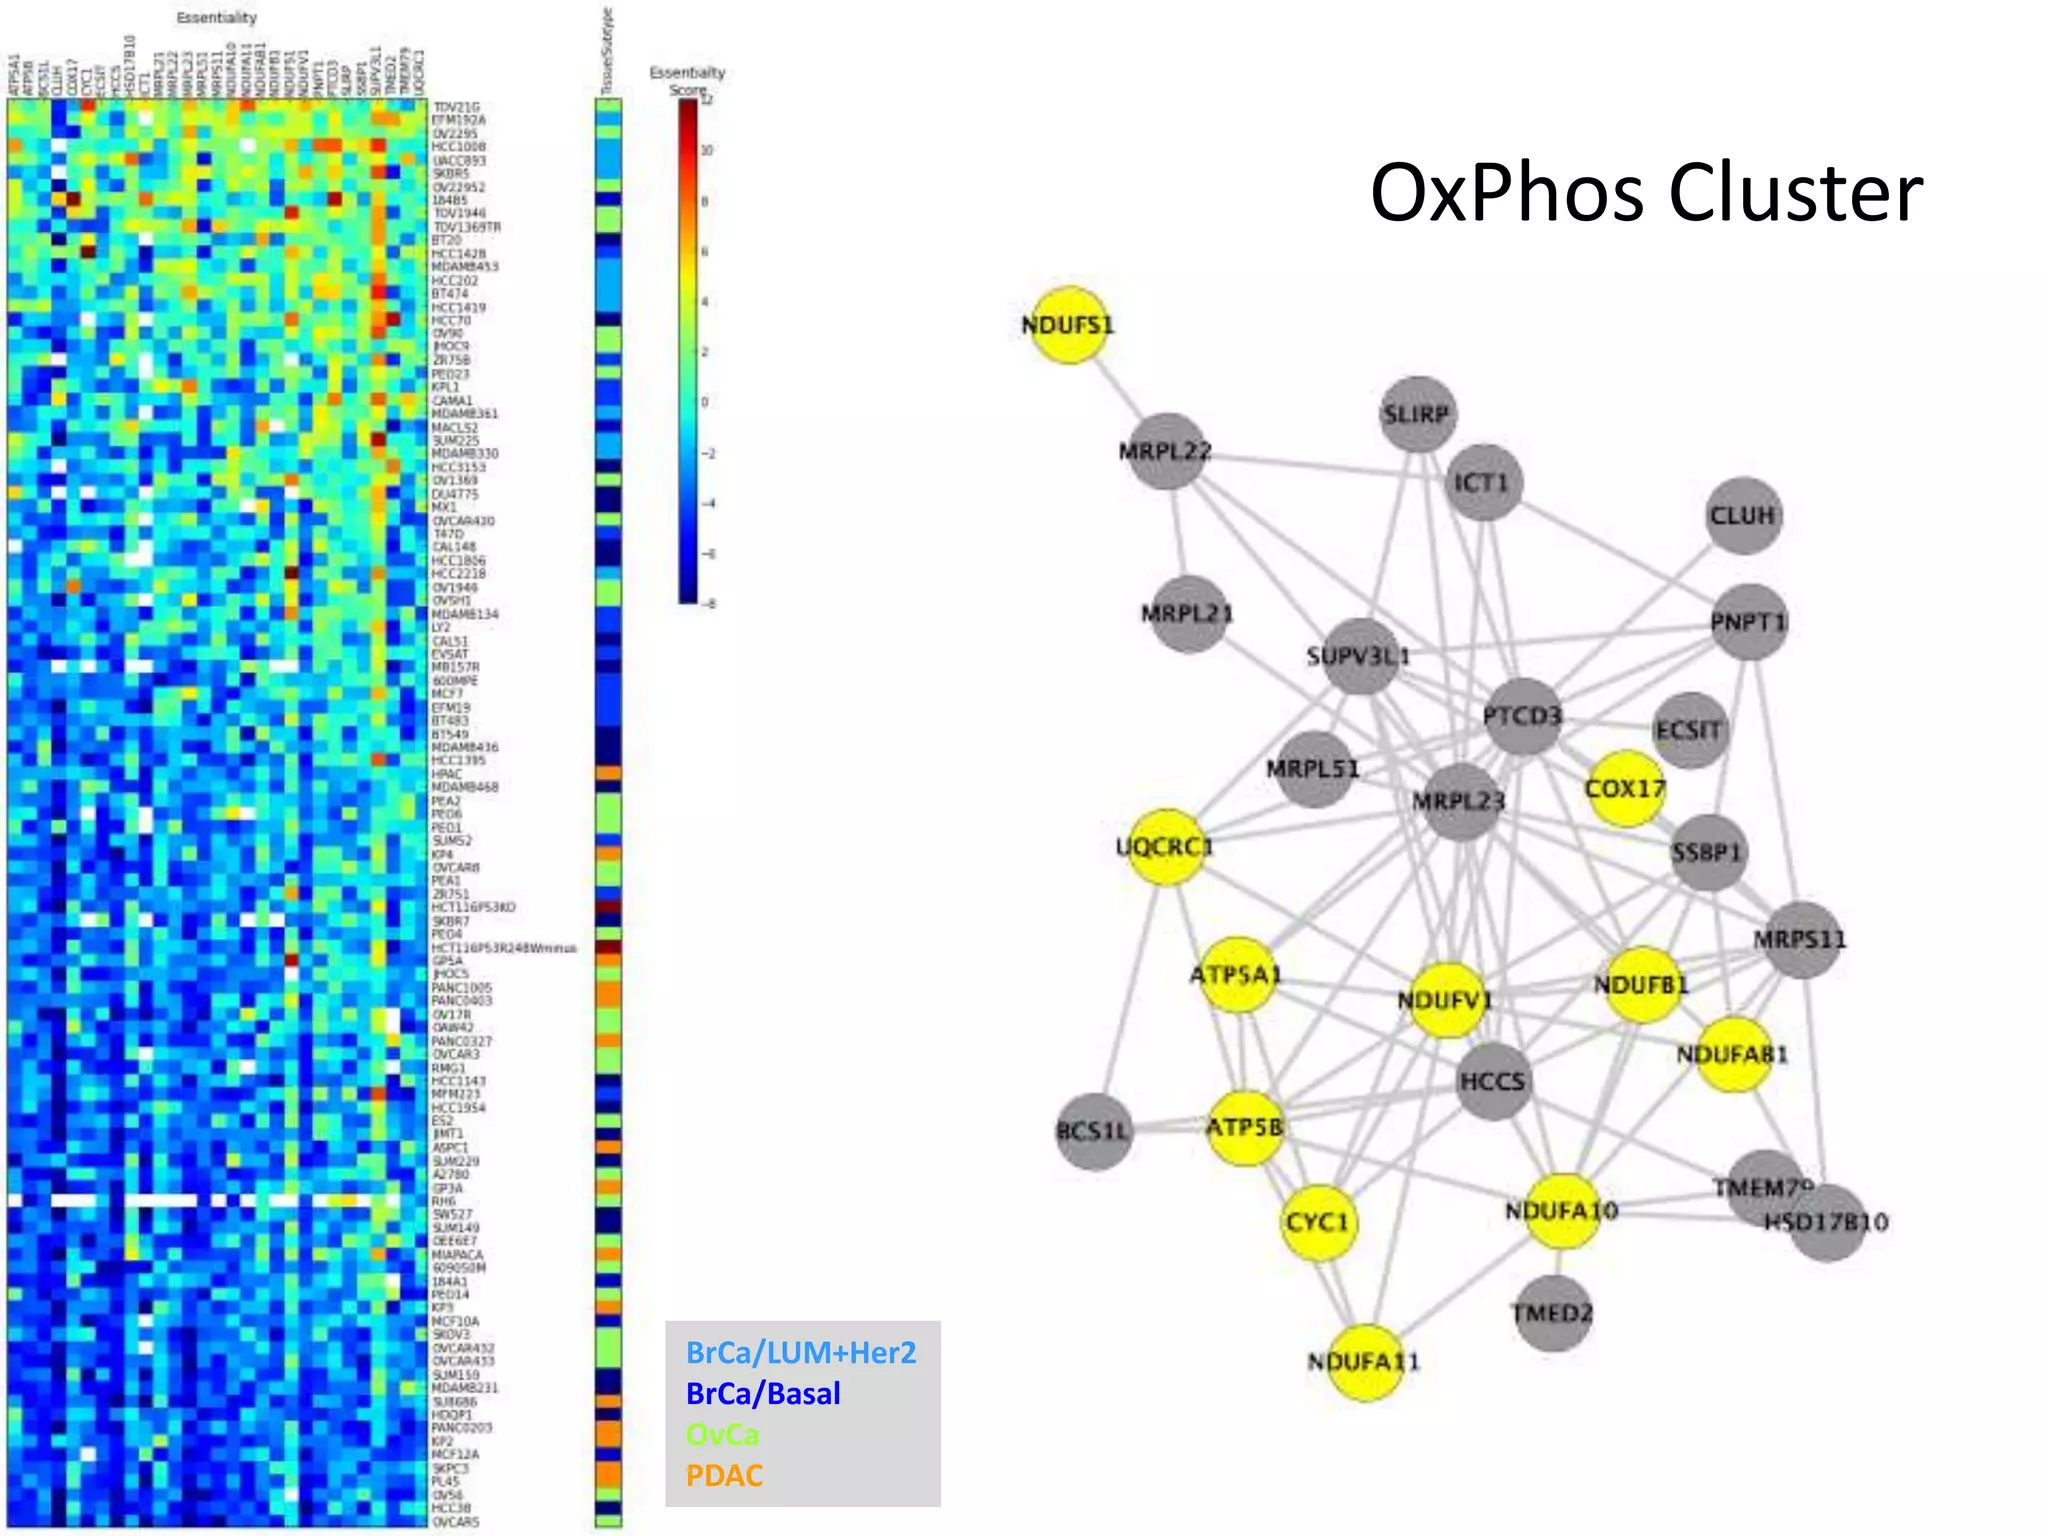
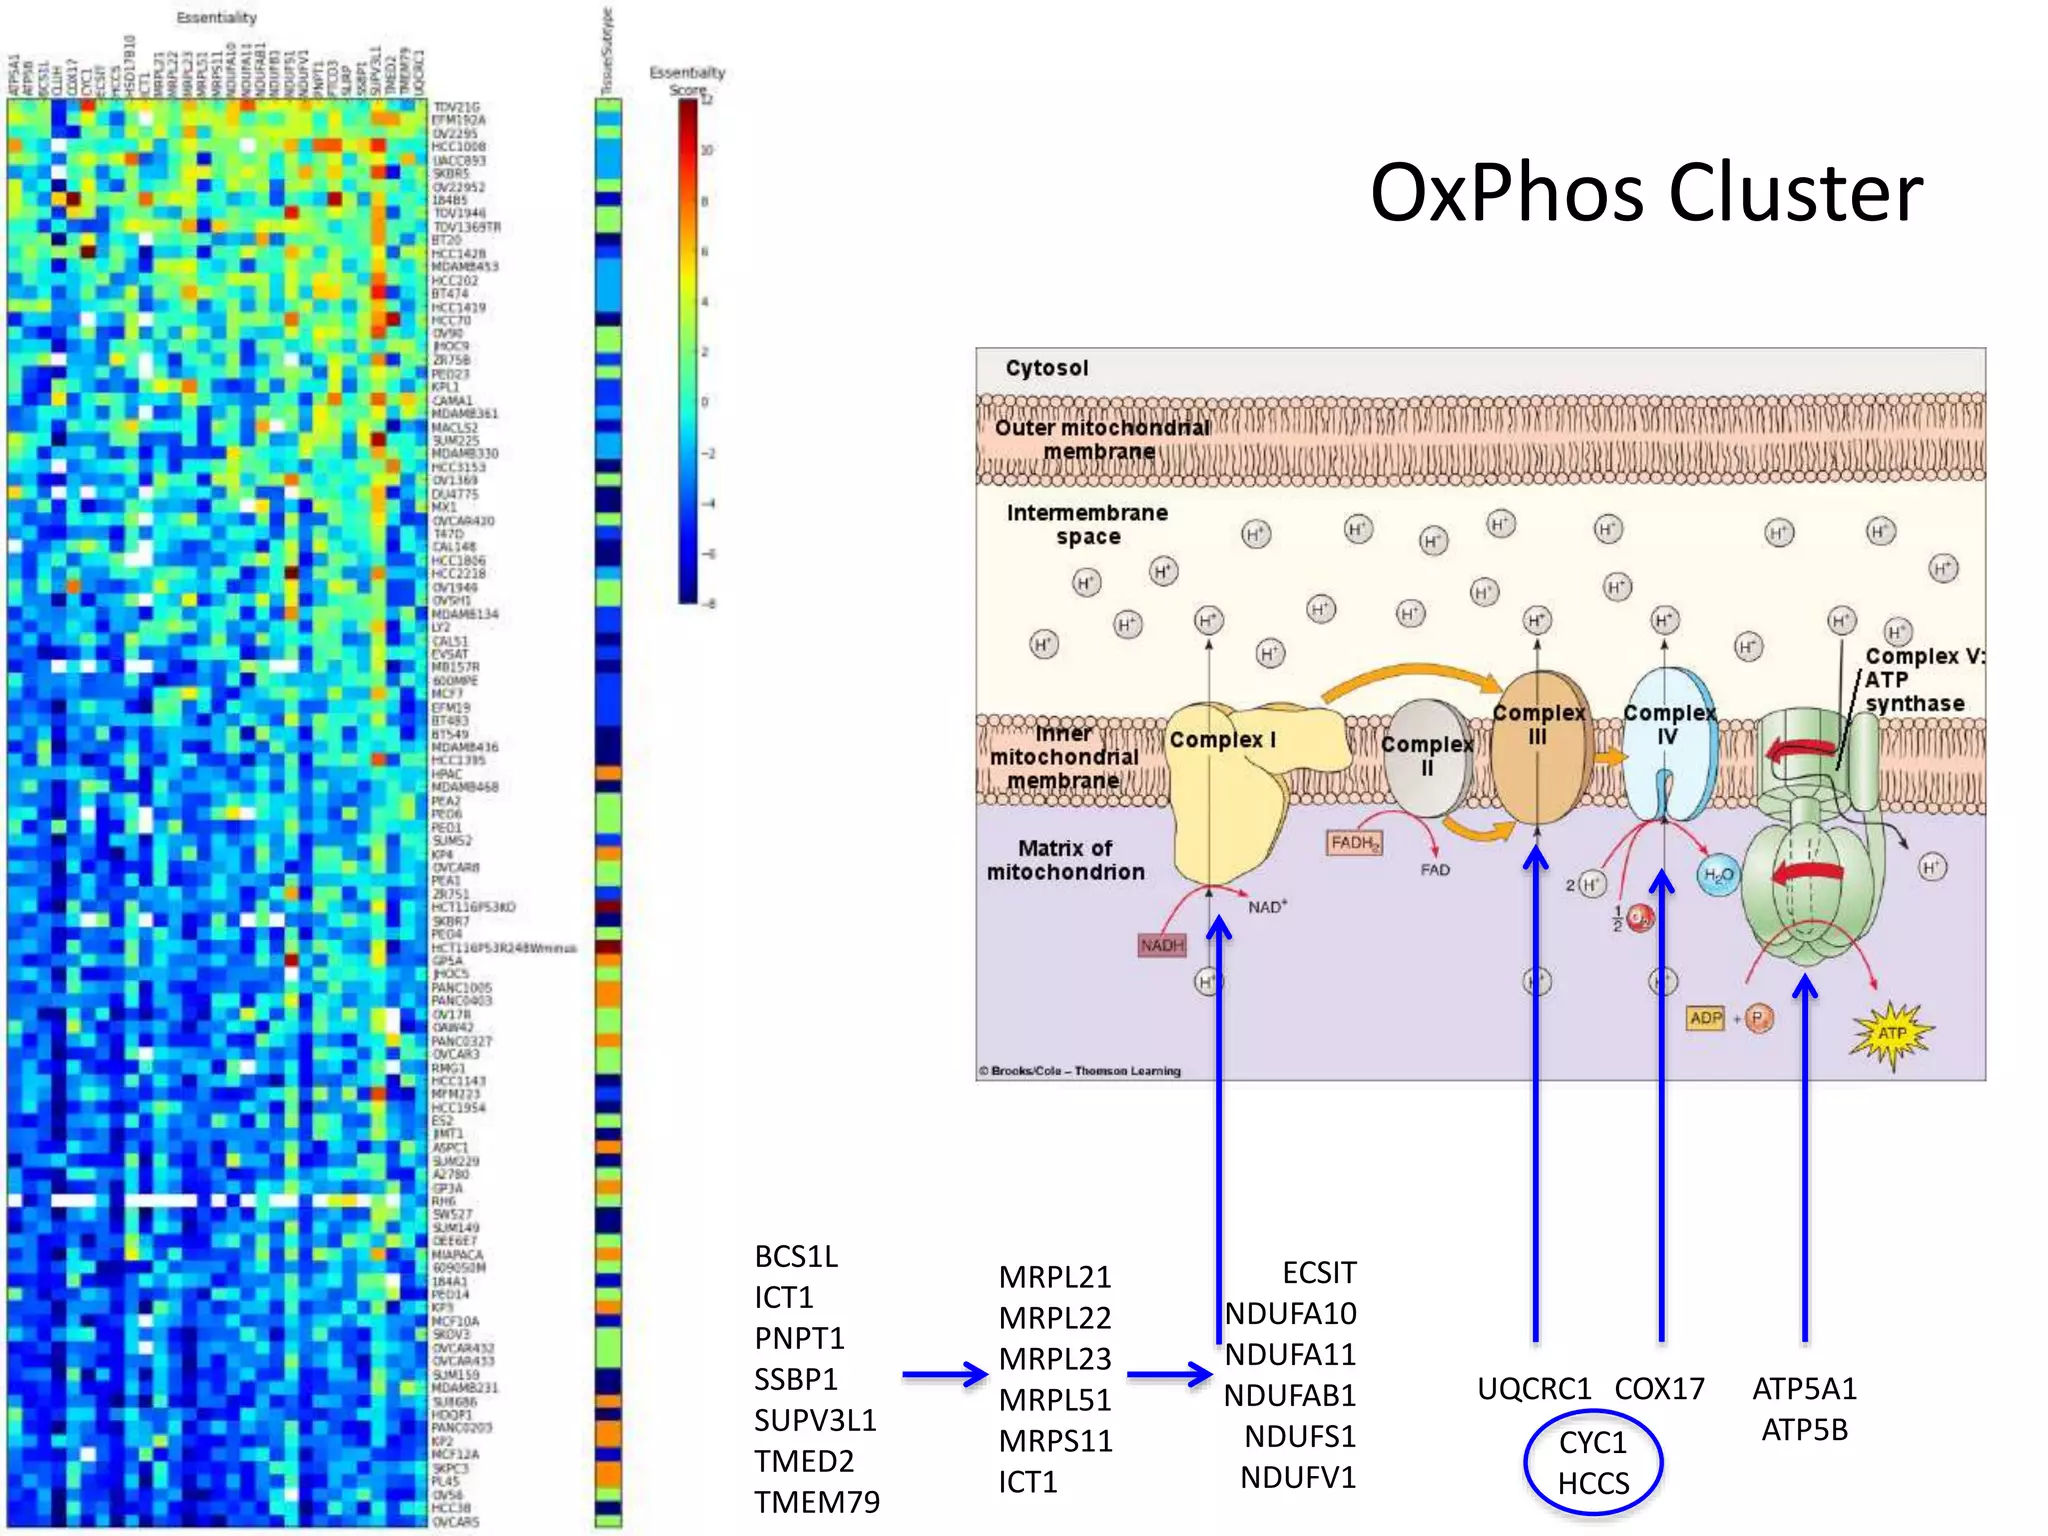
- A network of 866 genes and 1877 edges was constructed based on correlations in essentiality profiles across cell lines.
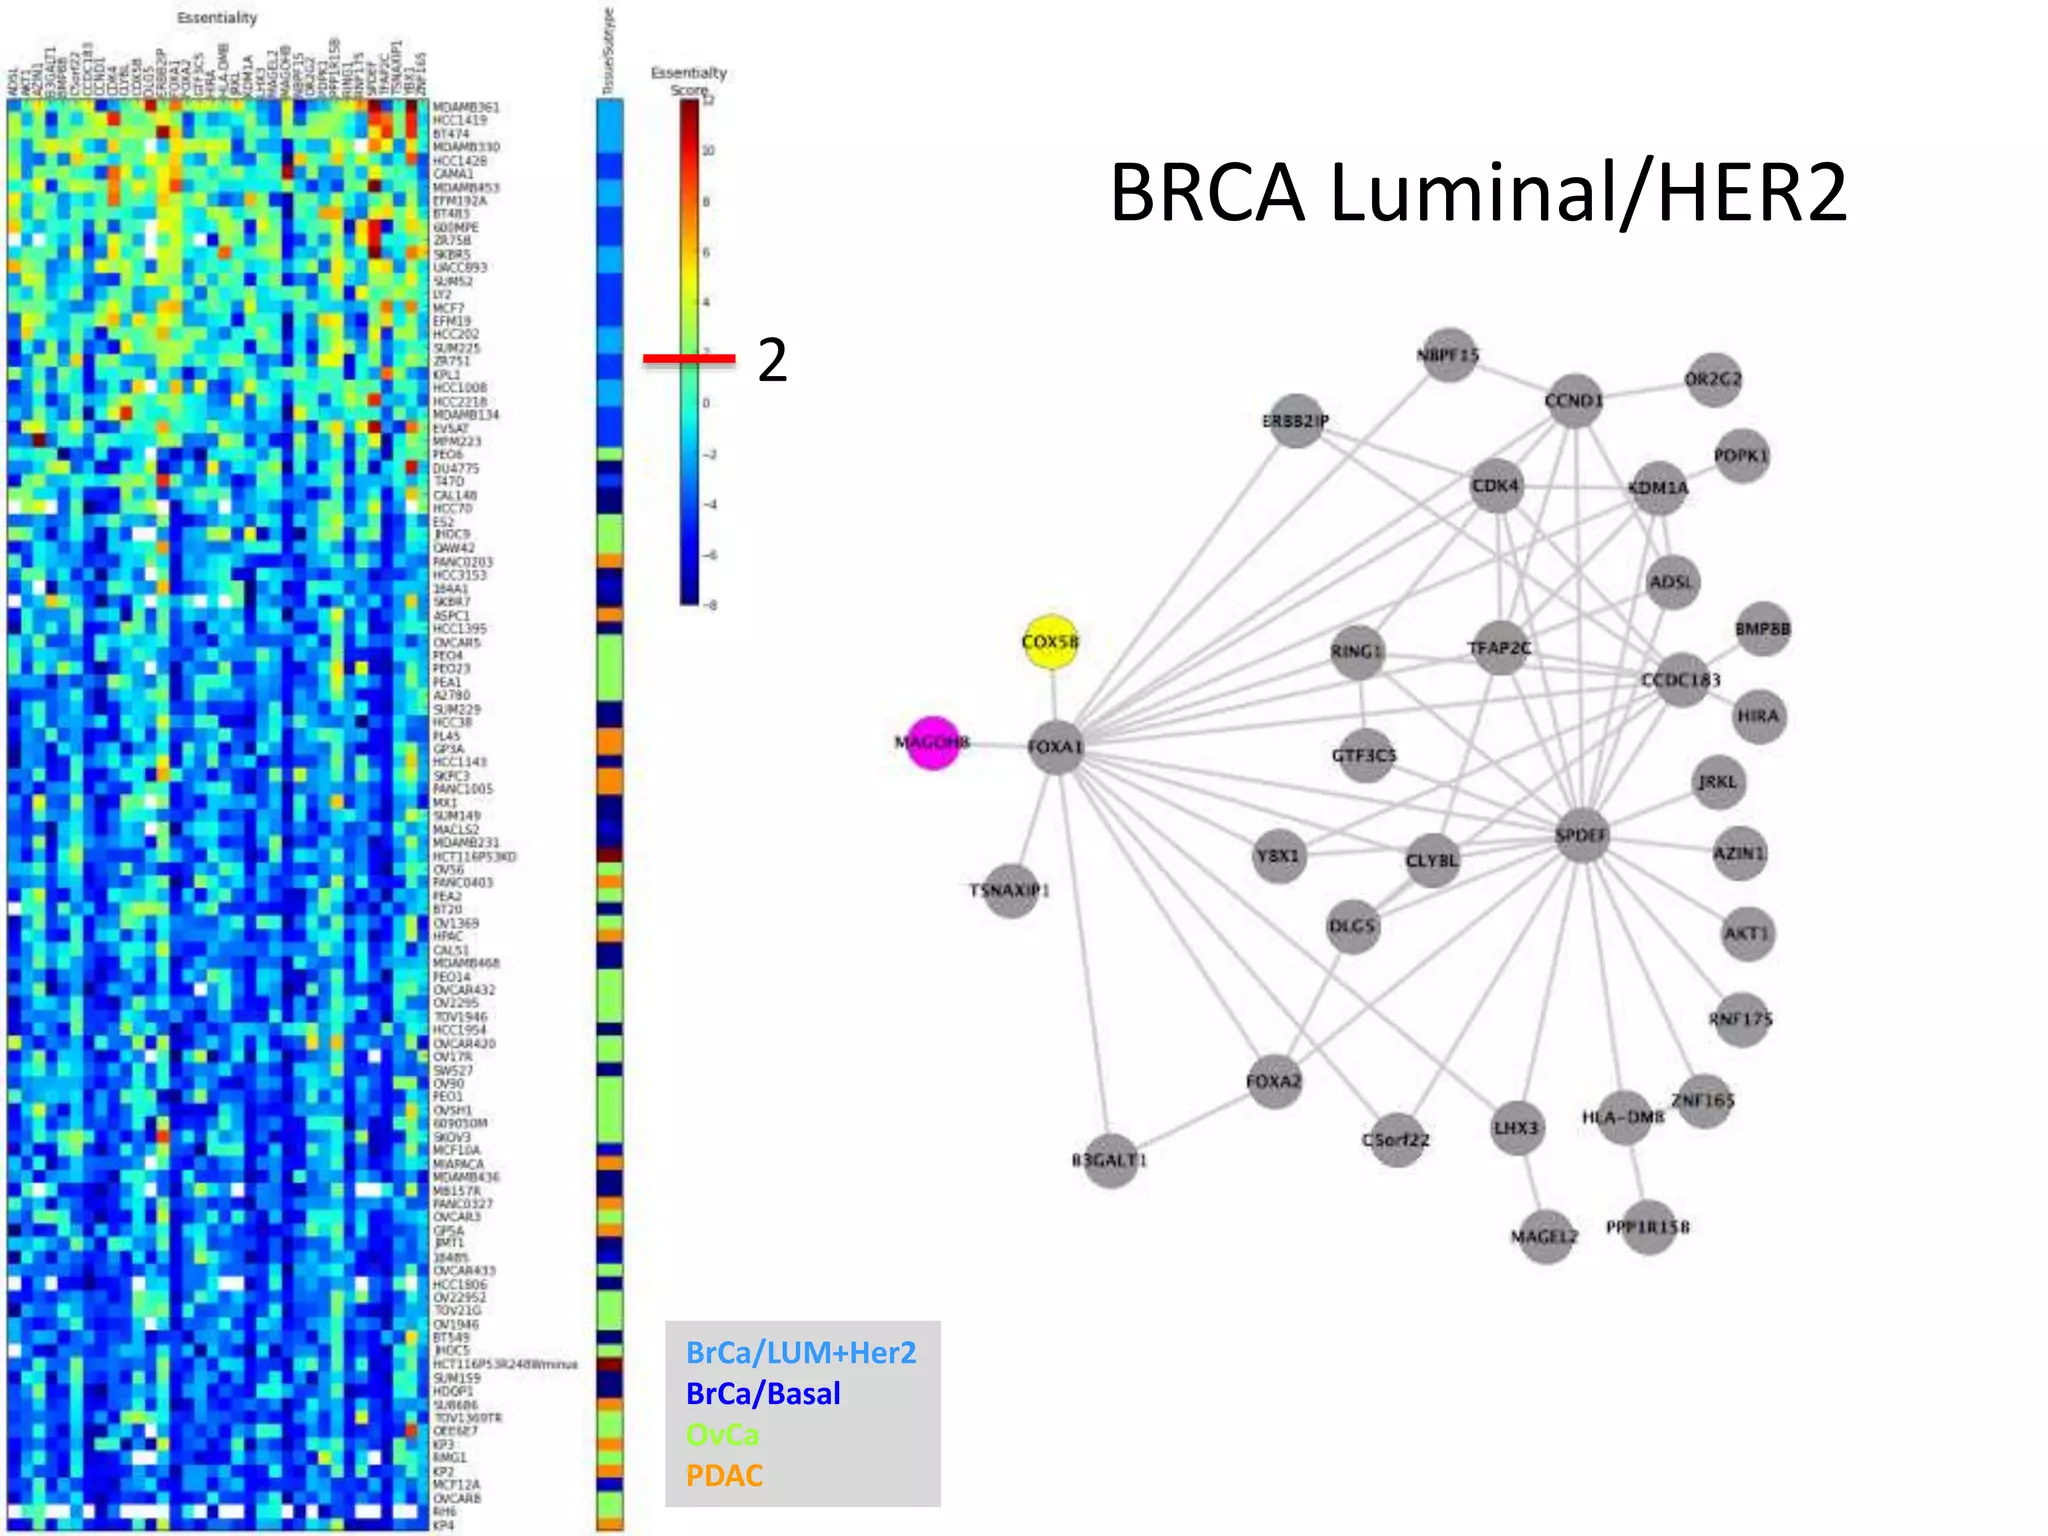
- Network clustering identified groups of genes essential for similar cell line subtypes (e.g. breast, ovarian, pancreatic cancers).
- One cluster involved in oxidative phosphorylation was particularly essential for luminal/HER2 breast cancers.
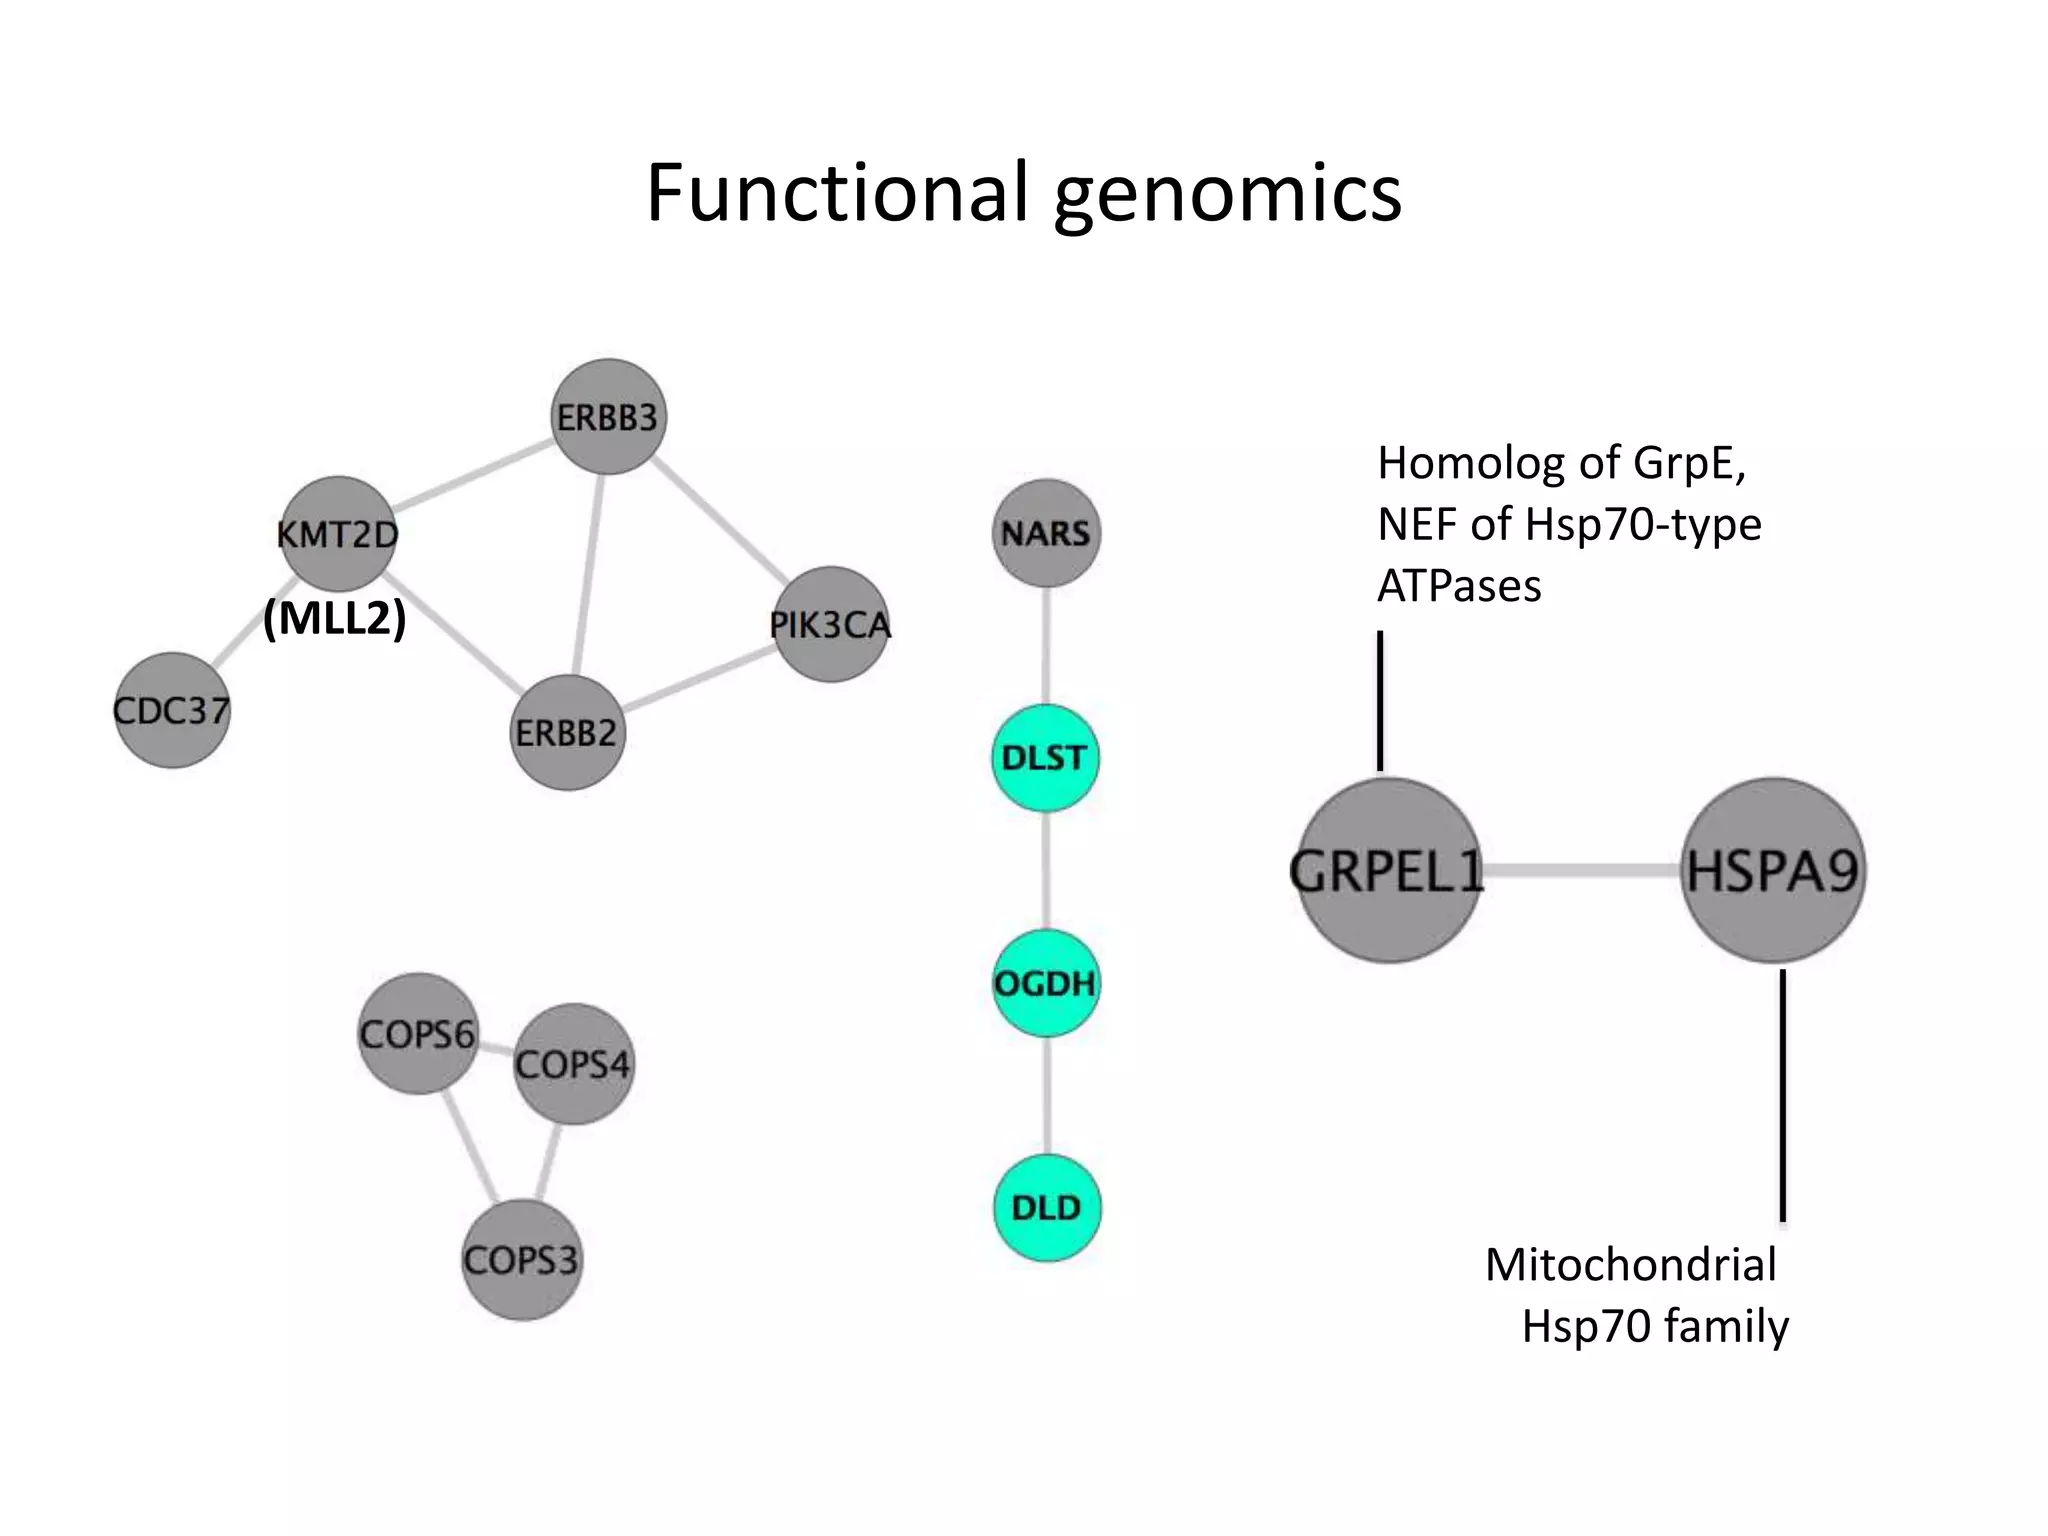
- The network provides a functional genomics resource, though opportunities exist to improve coverage and accuracy.
Presentation for Network Biology SIG 2013 by Thomas Kelder, Bioinformatics Scientist at TNO in The Netherlands. “Functional Network Signatures Link Anti-diabetic Interventions with Disease Parameters”
Keynote presentation for Network Biology SIG 2013 by Esti Yeger-Lotem, Senior Lecturer in Clinical Biochemistry at The National Institute for Biotechnology in the Negev, Israel
Raj Lab Meeting presentation (05/01/19)
by Katia Lopes and Ricardo Vialle
Discussing the paper "The impact of rare variation on gene expression across tissues" - Li et al. Nature (2017)
Presentaion for NetBio SIG 2013 by Robin Haw, Scientific Associate and Outreach Coordinator, Ontario Institute for Cancer Research. “Reactome Knowledgebase and Functional Interaction (FI) Cytoscape Plugin”
Summary: ENViz performs enrichment analysis for pathways and gene ontology (GO) terms in matched datasets of multiple data types (e.g. gene expression and metabolites or miRNA), then visualizes results as a Cytoscape network that can be navigated to show data overlaid on pathways and GO DAGs.
Background: Modern genomic, metabolomics, and proteomic assays produce multiplexed measurements that characterize molecular composition and biological activity from complimentary angles. Integrative analysis of such measurements remains a challenge to life science and biomedical researchers. We present an enrichment network approach to jointly analyzing two types of sample matched datasets and systematic annotations, implemented as a plugin to the Cytoscape [1] network biology software platform.
Approach: ENViz analyses a primary dataset (e.g. gene expression) with respect to a ‘pivot’ dataset (e.g. miRNA expression, metabolomics or proteomics measurements) and primary data annotation (e.g. pathway or GO). For each pivot entity, we rank elements of the primary data based on the correlation to the pivot across all samples, and compute statistical enrichment of annotation sets in the top of this ranked list based on minimum hypergeometric statistics [2]. Significant results are represented as an enrichment network - a bipartite graph with nodes corresponding to pivot and annotation entities, and edges corresponding to pivot-annotation pairs with statistical enrichmentscores above the user defined threshold. Correlations of primary data and pivot data are visually overlaid on biological pathways for significant pivot-annotation pairs using the WikiPathways resource [3], and on gene ontology terms. Edges of the enrichment network may point to functionally relevant mechanisms. In [4], a significant association between miR-19a and the cell-cycle module was substantiated as an association to proliferation, validated using a high-throughput transfection assay. The figures below show a pathway enrichment network, with pathway nodes green and miRNAs gray (left), network view of the edge between Inflammatory Response Pathway and mir-337-5p (center), and GO enrichment network with red areas indicating high enrichment for immune response and metabolic processes (right).
Functional Genomics Journal Club presentation on the following publication:
Kuzawa, C. W., Chugani, H. T., Grossman, L. I., Lipovich, L., Muzik, O., Hof, P. R., … Lange, N. (2014). Metabolic costs and evolutionary implications of human brain development. Proceedings of the National Academy of Sciences, 111(36), 13010–13015. https://doi.org/10.1073/pnas.1323099111
dkNET Webinar: Illuminating The Druggable Genome With Pharos 10/23/2020dkNET
Abstract
Pharos (https://pharos.nih.gov/) is an integrated web-based informatics platform for the analysis of data aggregated by the Illuminating the Druggable Genome (IDG) Knowledge Management Center, an NIH Common Fund initiative. The current version of Pharos (as of October 2019) spans 20,244 proteins in the human proteome, 19,880 disease and phenotype associations, and 226,829 ChEMBL compounds. This resource not only collates and analyzes data from over 60 high-quality resources to generate these types, but also uses text indexing to find less apparent connections between targets, and has recently begun to collaborate with institutions that generate data and resources. Proteins are ranked according to a knowledge-based classification system, which can help researchers to identify less studied “dark” targets that could be potentially further illuminated. This is an important process for both drug discovery and target validation, as more knowledge can accelerate target identification, and previously understudied proteins can serve as novel targets in drug discovery. In this webinar, Dr. Tudor Oprea will introduce how to use Pharos to find targets of interest for drug discovery.
The top 3 key questions that Pharos can answer:
1. What are the novel drug targets that may play a role in a specific disease?
2. What are the diseases that are related directly or indirectly to a drug target?
3. Find researchers that are related directly or indirectly to a drug target.
Presenter: Tudor Oprea, MD, PhD, Professor of Medicine, Chief of Translational Informatics Division & Internal Medicine, University of New Mexico
dkNET Webinar Information: https://dknet.org/about/webinar
Introduction
Overview
Reductionist approach
Holistic approach
What is systems biology?
○ Advantages of Systems Biology
Tools of holistic approach
○ Proteomics, Transcriptomics and Metabolomics
Conclusion
References
Next Generation Sequencing and its Applications in Medical Research - Frances...Sri Ambati
The so-called “next-generation” sequencing (NGS) technologies allows us, in a short time and in parallel, to sequence massive amounts of DNA, overcoming the limitations of the original Sanger sequencing methods used to sequence the first human genome. NGS technologies have had an enormous impact on biomedical research within a short time frame. This talk will give an overview of these applications with specific examples from Mendelian genomics and cancer research. #h2ony
Detecting clinically actionable somatic structural aberrations from targeted ...Ronak Shah
Structural aberrations including deletions, insertions, inversions, tandem duplications, translocations, and more complex rearrangements constitute a frequent type of alteration in human tumors. Here, we sought to explore the potential to discover such events from targeted DNA sequence data in our CLIA-compliant molecular diagnostics laboratory. To detect somatic structural aberrations in individual tumors, we have developed an analytic framework in Perl & Python to detect these events in data generated by a hybridization capture-based, targeted sequencing clinical assay (MSK-IMPACT), which can reveal structural rearrangements as small as 500bp.
Proteogenomic analysis of human colon cancer reveals new therapeutic opportun...Gul Muneer
We performed the first proteogenomic study on a prospectively collected colon cancer cohort. Comparative proteomic and phosphoproteomic analysis of paired tumor and normal adjacent tissues produced a catalog of colon cancer-associated proteins and phosphosites, including known and putative new biomarkers, drug targets, and cancer/testis antigens. Proteogenomic integration not only prioritized genomically inferred targets, such as copy-number drivers and mutation-derived neoantigens, but also yielded novel findings. Phosphoproteomics data associated Rb phosphorylation with increased proliferation and decreased apoptosis in colon cancer, which explains why this classical tumor suppressor is amplified in colon tumors and suggests a rationale for targeting Rb phosphorylation in colon cancer. Proteomics identified an association between decreased CD8 T cell infiltration and increased glycolysis in microsatellite instability-high (MSI-H) tumors, suggesting glycolysis as a potential target to overcome the resistance of MSI-H tumors to immune checkpoint blockade. Proteogenomics presents new avenues for biological discoveries and therapeutic development.
Slides from my talk describing CE-Symm and my research on internal symmetry. It was given for jLBR, the weekly seminar series for our department at PSI.
D4476, a cell-permeant inhibitor of CK1, potentiates the action of Bromodeoxy...Atai Rabby
To elucidate the mechanism of bromodeoxyuridine (BrdU) induced cellular senescence, we treated HeLa cells with D4476, a potent and specific inhibitor of casein kinase 1(CK1). We found that D4476 (10µM) treatment could arrest cell growth at G1 stage and induced cellular senescence when treated together with BrdU (10µM). However neither D4476 nor BrdU can induce cellular senescence alone, at a concentration of 10µM. These results suggest that the targets of CK1 may be involved in maintaining normal cellular process and their inactivation potentiates BrdU to induce senescence like phenomena.
Speaker: Benedict C. S. Cross, PhD, Team leader (Discovery Screening), Horizon Discovery
CRISPR–Cas9 mediated genome editing provides a highly efficient way to probe gene function. Using this technology, thousands of genes can be knocked out and their function assessed in a single experiment. We have conducted over 150 of these complex and powerful screens and will use our experience to guide you through the process of screen design, performance and analysis.
We'll be discussing:
• How to use CRISPR screening for target ID and validation, understanding drug MOA and patient stratification
• The screen design, quality control and how to evaluate success of your screening program
• Horizon’s latest developments to the platform
• Horizon’s novel approaches to target validation screening
Visual Exploration of Clinical and Genomic Data for Patient StratificationNils Gehlenborg
Talk presented at the Simons Foundation Biotech Symposium "Complex Data Visualization: Approach and Application" (12 September 2014)
http://www.simonsfoundation.org/event/complex-data-visualization-approach-and-application/
In this talk I describe how we integrated a sophisticated computational framework directly into the StratomeX visualization technique to enable rapid exploration of tens of thousands of stratifications in cancer genomics data, creating a unique and powerful tool for the identification and characterization of tumor subtypes. The tool can handle a wide range of genomic and clinical data types for cohorts with hundreds of patients. StratomeX also provides direct access to comprehensive data sets generated by The Cancer Genome Atlas Firehose analysis pipeline.
http://stratomex.caleydo.org
National Resource for Networks Biology's TR&D Theme 3: Although networks have been very useful for representing molecular interactions and mechanisms, network diagrams do not visually resemble the contents of cells. Rather, the cell involves a multi-scale hierarchy of components – proteins are subunits of protein complexes which, in turn, are parts of pathways, biological processes, organelles, cells, tissues, and so on. In this technology research project, we will pursue methods that move Network Biology towards such hierarchical, multi-scale views of cell structure and function.
Technology R&D Theme 2: From Descriptive to Predictive NetworksAlexander Pico
National Resource for Networks Biology's TR&D Theme 2: Genomics is mapping complex data about human biology and promises major medical advances. However, the routine use of genomics data in medical research is in its infancy, due mainly to the challenges of working with highly complex “big data”. In this theme, we will use network information to help organize, analyze and integrate these data into models that can be used to make clinically relevant diagnoses and predictions about an individual.
National Resource for Networks Biology's TR&D Theme 1: In this theme, we will develop a series of tools and methodologies for conducting differential analyses of biological networks perturbed under multiple conditions. The novel algorithmic methodologies enable us to make use of high-throughput proteomic level data to recover biological networks under specific biological perturbations. The software tools developed in this project enable researchers to further predict, analyze, and visualize the effects of these perturbations and alterations, while enabling researchers to aggregate additional information regarding the known roles of the involved interactions and their participants.
The NRNB has been funded as an NIGMS Biomedical Technology Research Resource since 2010. During the previous five-year period, NRNB investigators introduced a series of innovative methods for network biology including network-based biomarkers, network-based stratification of genomes, and automated inference of gene ontologies using network data. Over the next five years, we will seek to catalyze major phase transitions in how biological networks are represented and used, working across three broad themes: (1) From static to differential networks, (2) From descriptive to predictive networks, and (3) From flat to hierarchical networks bridging across scales. All of these efforts leverage and further support our growing stable of network technologies, including the popular Cytoscape network analysis infrastructure.
Visualization and Analysis of Dynamic Networks Alexander Pico
DynNetwork development was taken up initially by Sabina Sara Pfister back in GSoC 2012. She laid out a strong foundation for dynamic network visualization in Cytoscape and my job was to extend the plugin’s functionality to help users analyse time changing networks. The two of us were mentored by Jason Montojo. We had developed a decent tool over the course of two GSoC programs to aid dynamic network analysis and our efforts culminated in DynNetwork getting accepted for an oral presentation at the International Network for Social Network Analysis (INSNA), Sunbelt 2014 which was held in St. Petersburg, FL in February.
Professional air quality monitoring systems provide immediate, on-site data for analysis, compliance, and decision-making.
Monitor common gases, weather parameters, particulates.
A brief information about the SCOP protein database used in bioinformatics.
The Structural Classification of Proteins (SCOP) database is a comprehensive and authoritative resource for the structural and evolutionary relationships of proteins. It provides a detailed and curated classification of protein structures, grouping them into families, superfamilies, and folds based on their structural and sequence similarities.
Seminar of U.V. Spectroscopy by SAMIR PANDASAMIR PANDA
Spectroscopy is a branch of science dealing the study of interaction of electromagnetic radiation with matter.
Ultraviolet-visible spectroscopy refers to absorption spectroscopy or reflect spectroscopy in the UV-VIS spectral region.
Ultraviolet-visible spectroscopy is an analytical method that can measure the amount of light received by the analyte.
Slide 1: Title Slide
Extrachromosomal Inheritance
Slide 2: Introduction to Extrachromosomal Inheritance
Definition: Extrachromosomal inheritance refers to the transmission of genetic material that is not found within the nucleus.
Key Components: Involves genes located in mitochondria, chloroplasts, and plasmids.
Slide 3: Mitochondrial Inheritance
Mitochondria: Organelles responsible for energy production.
Mitochondrial DNA (mtDNA): Circular DNA molecule found in mitochondria.
Inheritance Pattern: Maternally inherited, meaning it is passed from mothers to all their offspring.
Diseases: Examples include Leber’s hereditary optic neuropathy (LHON) and mitochondrial myopathy.
Slide 4: Chloroplast Inheritance
Chloroplasts: Organelles responsible for photosynthesis in plants.
Chloroplast DNA (cpDNA): Circular DNA molecule found in chloroplasts.
Inheritance Pattern: Often maternally inherited in most plants, but can vary in some species.
Examples: Variegation in plants, where leaf color patterns are determined by chloroplast DNA.
Slide 5: Plasmid Inheritance
Plasmids: Small, circular DNA molecules found in bacteria and some eukaryotes.
Features: Can carry antibiotic resistance genes and can be transferred between cells through processes like conjugation.
Significance: Important in biotechnology for gene cloning and genetic engineering.
Slide 6: Mechanisms of Extrachromosomal Inheritance
Non-Mendelian Patterns: Do not follow Mendel’s laws of inheritance.
Cytoplasmic Segregation: During cell division, organelles like mitochondria and chloroplasts are randomly distributed to daughter cells.
Heteroplasmy: Presence of more than one type of organellar genome within a cell, leading to variation in expression.
Slide 7: Examples of Extrachromosomal Inheritance
Four O’clock Plant (Mirabilis jalapa): Shows variegated leaves due to different cpDNA in leaf cells.
Petite Mutants in Yeast: Result from mutations in mitochondrial DNA affecting respiration.
Slide 8: Importance of Extrachromosomal Inheritance
Evolution: Provides insight into the evolution of eukaryotic cells.
Medicine: Understanding mitochondrial inheritance helps in diagnosing and treating mitochondrial diseases.
Agriculture: Chloroplast inheritance can be used in plant breeding and genetic modification.
Slide 9: Recent Research and Advances
Gene Editing: Techniques like CRISPR-Cas9 are being used to edit mitochondrial and chloroplast DNA.
Therapies: Development of mitochondrial replacement therapy (MRT) for preventing mitochondrial diseases.
Slide 10: Conclusion
Summary: Extrachromosomal inheritance involves the transmission of genetic material outside the nucleus and plays a crucial role in genetics, medicine, and biotechnology.
Future Directions: Continued research and technological advancements hold promise for new treatments and applications.
Slide 11: Questions and Discussion
Invite Audience: Open the floor for any questions or further discussion on the topic.
Comparing Evolved Extractive Text Summary Scores of Bidirectional Encoder Rep...University of Maribor
Slides from:
11th International Conference on Electrical, Electronics and Computer Engineering (IcETRAN), Niš, 3-6 June 2024
Track: Artificial Intelligence
https://www.etran.rs/2024/en/home-english/
Introduction:
RNA interference (RNAi) or Post-Transcriptional Gene Silencing (PTGS) is an important biological process for modulating eukaryotic gene expression.
It is highly conserved process of posttranscriptional gene silencing by which double stranded RNA (dsRNA) causes sequence-specific degradation of mRNA sequences.
dsRNA-induced gene silencing (RNAi) is reported in a wide range of eukaryotes ranging from worms, insects, mammals and plants.
This process mediates resistance to both endogenous parasitic and exogenous pathogenic nucleic acids, and regulates the expression of protein-coding genes.
What are small ncRNAs?
micro RNA (miRNA)
short interfering RNA (siRNA)
Properties of small non-coding RNA:
Involved in silencing mRNA transcripts.
Called “small” because they are usually only about 21-24 nucleotides long.
Synthesized by first cutting up longer precursor sequences (like the 61nt one that Lee discovered).
Silence an mRNA by base pairing with some sequence on the mRNA.
Discovery of siRNA?
The first small RNA:
In 1993 Rosalind Lee (Victor Ambros lab) was studying a non- coding gene in C. elegans, lin-4, that was involved in silencing of another gene, lin-14, at the appropriate time in the
development of the worm C. elegans.
Two small transcripts of lin-4 (22nt and 61nt) were found to be complementary to a sequence in the 3' UTR of lin-14.
Because lin-4 encoded no protein, she deduced that it must be these transcripts that are causing the silencing by RNA-RNA interactions.
Types of RNAi ( non coding RNA)
MiRNA
Length (23-25 nt)
Trans acting
Binds with target MRNA in mismatch
Translation inhibition
Si RNA
Length 21 nt.
Cis acting
Bind with target Mrna in perfect complementary sequence
Piwi-RNA
Length ; 25 to 36 nt.
Expressed in Germ Cells
Regulates trnasposomes activity
MECHANISM OF RNAI:
First the double-stranded RNA teams up with a protein complex named Dicer, which cuts the long RNA into short pieces.
Then another protein complex called RISC (RNA-induced silencing complex) discards one of the two RNA strands.
The RISC-docked, single-stranded RNA then pairs with the homologous mRNA and destroys it.
THE RISC COMPLEX:
RISC is large(>500kD) RNA multi- protein Binding complex which triggers MRNA degradation in response to MRNA
Unwinding of double stranded Si RNA by ATP independent Helicase
Active component of RISC is Ago proteins( ENDONUCLEASE) which cleave target MRNA.
DICER: endonuclease (RNase Family III)
Argonaute: Central Component of the RNA-Induced Silencing Complex (RISC)
One strand of the dsRNA produced by Dicer is retained in the RISC complex in association with Argonaute
ARGONAUTE PROTEIN :
1.PAZ(PIWI/Argonaute/ Zwille)- Recognition of target MRNA
2.PIWI (p-element induced wimpy Testis)- breaks Phosphodiester bond of mRNA.)RNAse H activity.
MiRNA:
The Double-stranded RNAs are naturally produced in eukaryotic cells during development, and they have a key role in regulating gene expression .
Multi-source connectivity as the driver of solar wind variability in the heli...Sérgio Sacani
The ambient solar wind that flls the heliosphere originates from multiple
sources in the solar corona and is highly structured. It is often described
as high-speed, relatively homogeneous, plasma streams from coronal
holes and slow-speed, highly variable, streams whose source regions are
under debate. A key goal of ESA/NASA’s Solar Orbiter mission is to identify
solar wind sources and understand what drives the complexity seen in the
heliosphere. By combining magnetic feld modelling and spectroscopic
techniques with high-resolution observations and measurements, we show
that the solar wind variability detected in situ by Solar Orbiter in March
2022 is driven by spatio-temporal changes in the magnetic connectivity to
multiple sources in the solar atmosphere. The magnetic feld footpoints
connected to the spacecraft moved from the boundaries of a coronal hole
to one active region (12961) and then across to another region (12957). This
is refected in the in situ measurements, which show the transition from fast
to highly Alfvénic then to slow solar wind that is disrupted by the arrival of
a coronal mass ejection. Our results describe solar wind variability at 0.5 au
but are applicable to near-Earth observatories.
Richard's aventures in two entangled wonderlandsRichard Gill
Since the loophole-free Bell experiments of 2020 and the Nobel prizes in physics of 2022, critics of Bell's work have retreated to the fortress of super-determinism. Now, super-determinism is a derogatory word - it just means "determinism". Palmer, Hance and Hossenfelder argue that quantum mechanics and determinism are not incompatible, using a sophisticated mathematical construction based on a subtle thinning of allowed states and measurements in quantum mechanics, such that what is left appears to make Bell's argument fail, without altering the empirical predictions of quantum mechanics. I think however that it is a smoke screen, and the slogan "lost in math" comes to my mind. I will discuss some other recent disproofs of Bell's theorem using the language of causality based on causal graphs. Causal thinking is also central to law and justice. I will mention surprising connections to my work on serial killer nurse cases, in particular the Dutch case of Lucia de Berk and the current UK case of Lucy Letby.
Nutraceutical market, scope and growth: Herbal drug technologyLokesh Patil
As consumer awareness of health and wellness rises, the nutraceutical market—which includes goods like functional meals, drinks, and dietary supplements that provide health advantages beyond basic nutrition—is growing significantly. As healthcare expenses rise, the population ages, and people want natural and preventative health solutions more and more, this industry is increasing quickly. Further driving market expansion are product formulation innovations and the use of cutting-edge technology for customized nutrition. With its worldwide reach, the nutraceutical industry is expected to keep growing and provide significant chances for research and investment in a number of categories, including vitamins, minerals, probiotics, and herbal supplements.
What is greenhouse gasses and how many gasses are there to affect the Earth.moosaasad1975
What are greenhouse gasses how they affect the earth and its environment what is the future of the environment and earth how the weather and the climate effects.
(May 29th, 2024) Advancements in Intravital Microscopy- Insights for Preclini...Scintica Instrumentation
Intravital microscopy (IVM) is a powerful tool utilized to study cellular behavior over time and space in vivo. Much of our understanding of cell biology has been accomplished using various in vitro and ex vivo methods; however, these studies do not necessarily reflect the natural dynamics of biological processes. Unlike traditional cell culture or fixed tissue imaging, IVM allows for the ultra-fast high-resolution imaging of cellular processes over time and space and were studied in its natural environment. Real-time visualization of biological processes in the context of an intact organism helps maintain physiological relevance and provide insights into the progression of disease, response to treatments or developmental processes.
In this webinar we give an overview of advanced applications of the IVM system in preclinical research. IVIM technology is a provider of all-in-one intravital microscopy systems and solutions optimized for in vivo imaging of live animal models at sub-micron resolution. The system’s unique features and user-friendly software enables researchers to probe fast dynamic biological processes such as immune cell tracking, cell-cell interaction as well as vascularization and tumor metastasis with exceptional detail. This webinar will also give an overview of IVM being utilized in drug development, offering a view into the intricate interaction between drugs/nanoparticles and tissues in vivo and allows for the evaluation of therapeutic intervention in a variety of tissues and organs. This interdisciplinary collaboration continues to drive the advancements of novel therapeutic strategies.
1. Functional genomics and cancer subtyping
with a human cancer coessentiality network
Traver Hart
Laboratory of Jason Moffat
Donnelly Centre, U. Toronto
NetBio SIG, 11 July 2014
3. GI correlation
networks
Gene a
Gene b
Gene c
Gene d
Gene e
Cellline1
Cellline2
Cellline3
Cellline4
Cellline5
Cellline12
Cellline6
Cellline7
Cellline8
Cellline9
Cellline10
Cellline11
Essential
Nonessential
In yeast, highly correlated profiles imply
shared gene function. Can be used to
infer function of unknown genes.
Hypothesis: Correlated essentiality
profiles across human cancer cell lines
(bottom) are analogous to correlated GI
profiles and imply shared function—
even if we don’t know the query strain
Corollary: Gene clusters can help
identify cell lines with similar
vulnerabilities, possibly leading to novel
classification
Dixon et al., 2009
Query strains
ArraygenesArraystrains
Query strains
7. A quantitative measure of sensitivity
to RNAi perturbation
Correlation, Essentiality Score vs Expression
Density
Gene a
Gene b
Gene c
Gene d
Gene e
Cellline1
Cellline2
Cellline3
Cellline4
Cellline5
Cellline12
Cellline6
Cellline7
Cellline8
Cellline9
Cellline10
Cellline11
Essential
Nonessential
Query cell lines
Hart et al., 2014
17. Conclusions:
• The human cancer coessentiality network
– Depends critically on the new scoring scheme derived from Hart et al, 2014
– Optimized by lessons learned from the yeast GI network
• Clusters identify cell lines with common genetic vulnerabilities
– Known and novel
• Co-essentiality implies Co-functionality
– A unique functional genomics resource
Open questions:
• Identify genomic drivers of validated clusters?
• Improve coverage?
• Improve accuracy? CRISPR?
18. Robert Rottapel
Fabrice Sirculomb
Fernando Suarez
Mauricio Medrano
Josee Normand
Jason Moffat
Troy Ketela
Kevin Brown
Judice Koh
Glauber Brito
Azin Sayid
Dina Karamboulas
Dewald Van Dyk
Dahlia Kasimer
Christine Misquitta
Acknowledgements
Essentiality Screens in Cancer Cell Lines
18
Yaroslav Fedyshyn
Marianna Luhova
Bohdana Fedyshyn
Patricia Mero
Christine Misquitta
Franco Vizeacoumar
Benjamin Neel
Richard Marcotte
Azin Sayad
20. Why Gene Essentiality?
• Context-sensitive essentials are candidate therapeutic targets
Kaelin WG, Nat Rev Cancer, 2005
Wildtype A
Oncogenic a
Targeted b
Editor's Notes
Assume the NetBio SIG audience is familiar with this network…
Key finding of the yeast GI network is that correlated GI profiles imply cofunctionality
Question driving my research is, how can we get this kind of information for humans?
In yeast, the network is generated by systematic assay of double knockout mutants or TS alleles for essential genes
Systematic work like this has been very difficult in humans, though it has been attempted on modest scales by a couple of labs.
However, there does exist a significant body of gene essentiality data for human cancer cell lines. Our hypothesis was that correlated gene essentiality profiles across these cell lines would produce similar information about shared biological function, and further that we may be able to discover novel patterns of shared genetic vulnerability across the cell lines assayed.
Here the data represent either a binary measure of essentiality or quantitative measure of gene sensitivity to perturbation
The data comes from pooled library shRNA screens where multiple shRNA hairpins targeting nearly every protein coding gene are introduced into a cell line. hairpins targeting essential genes drop out of the population and register as strong negative fold change using either a custom microarray or sequencing readout. The initial data are from screens of 72 cancer cell lines of pancreatic, ovarian, and breast origin.
We have recently completed a reanalysis of this initial data set; it was just published at the beginning of this month and so I won’t go into great detail here. Briefly, we derived gold standard reference sets of essential and nonessential genes that we can use to train a Bayesian classifier—the observed fold changes of hairpins targeting a given gene are judged to be drawn from either the reference essential or nonessential distributions and the posterior log odds ratio is used as an essentiality score. Just as importantly, we can evaluate the quality of each screen using withheld reference data and identify which screens should be removed from downstream work.
This work led us to the ‘daisy model’ of essentiality, where the essential genes in each cell line or tissue are represented by a petal. Petals overlap to varying degrees but they all share the same set of core essential genes; the degree to which a screen recapitulates this core is then a measure of its quality. This model is supported by whole organism data: when separated into core and peripheral essentials, only peripheral essentials are enriched for disease genes. Likewise core essentials show much lower rates of putative deleterious mutation in human population genetic data, indicating that at an organismal level we can’t stand even minor perturbation of these core essential genes.
A surprising finding was that, in general, essentiality is not correlated with gene expression, as measure by RNAseq. Even more surprising was the exception to this rule: core essentials show a strong negative correlation. This may be explained by there being some minimum expression requirement for these genes; at this minimum, the genes are very sensitive to perturbation. At higher expression levels, this sensitivity is buffered. Imporantly, this led us to the conclusion that our scoring scheme was yielding a quantitative measure of gene essentiality – or sensitivity – I’ll use those terms interchangeably. So we used these scores directly in our matrix.
Despite our improved scoring scheme, the essentiality data are still quite noisy. While each cell line had a fairly modest FDR of around 15%, across over 100 cell lines false positives accumulated rapidly. Here we leaned on the lessons from the yeast network to create a high-confidence coessentiality network. Using a log likelihood enrichment score against the KEGG database as a scoring scheme, we tweaked several parameters – what quality threshold to apply to the screens, what minimum number of cell lines a gene was called essential in, and the overall variance of a gene’s essentiality profile across all cell lines – to maximize that score.
By rank ordering correlations at each threshold, binning in groups of 1000, and calculating the LLS vs KEGG, we get a measure of how each threshold performed. In the end, the top 107 cell lines with matching RNAseq data and genes essential in at least 4 cell lines yielded top correlations that showed about an 18-fold enrichment in KEGG pairs, and that’s after excluding the big bias-inducing sets like ribosome, proteasome, spliceosome. Taking all pairs positive correlations with FDR < 1% yielded a correlation network with 1,086 genes…
And here it is. The giant connected component of the human coessentiality network. 866 genes, with an average degree of a little over 4. Four major annotations are highlighted, to show that it is not dominated by the Big Three.
Naturally, when you build a network, the first thing you want to do is tear it apart to see what’s in it.
Unsupervised clustering of the network yields clusters that are obviously functionally coherent (generally monochromatic). This is a very nice validation of the idea that coessentiality implies cofunctionality. The obvious next question here is, what groups of cell lines drive these clusters? Do each of these represent specific classes of genetic vulnerability? I’ll go into detail on these top two clusters; the first has no annotation of note and the second is clearly enriched for genes involved in the mitochondrial process of oxidative phosphorylation.
This is the first cluster, comprising over 30 genes. Each gene’s essentiality profile is shown in this heatmap (left), with green or better representing high confidence essential.
This column represents the tissue or subtype of the cell line. Light and medium blue are luminal and HER2 amplified breast cancer cell lines. So this cluster accurately discriminates these subtypes from the other data. A closer look at the genes in the cluster shows SPDEF, TFAP2C, FOXA1, CDK4, CCND1– the known oncogenes driving this subtype. Discovery of this cluster is a strong validation of our approach.
It is worth noting that, despite the general trend that essentiality is not correlated with expression level, the genes in this BrCa cluster show strong positive correlation (note far out on tail of blue curve). These genes show subtype-specific expression (or overexpression) as well as essentiality but unfortunately do not indicate a general trend.
The second cluster is enriched for oxphos genes. These genes are essential in a mix of breast and ovarian cancer cell lines, showing that these clusters aren’t merely differentiating tissues of origin. A closer look shows that nearly all of the genes show mitochondrial localization…
Going into a bit more detail, we see that the entire oxphos pathway as well as its biogenesis is recovered. There are genes involved in mitochondrial import and mitochondrial genome transcription, the mitochondrial ribosome, and elements of four of the five oxphos complexes, plus cytochrome c and the enzyme that covalently attaches the heme group to the cytochrome. This is exactly what you’d expect from a classical genetic screen.
This cluster implies that these cell lines are critically dependent on oxphos for proliferation. This is a very surprising finding, since the Warburg effect involves switching to glycolysis and away from oxphos dependence. Moreover, these genes show no correlation between essentiality and expression level; basically there is no molecular signature that predicts this dependence among these cell types.
I’ve focused on the cancer implications of the major clusters in this network. In fact one of the minor clusters fine tunes the BrCa cluster; the ERBB2/ERBB3 cluster differentiates Her2-amplified cell lines from other luminal BrCa lines. Turning to a more functional genomics oriented view, we can see other evidence that coessentiality implies confunctionality. Here we have three subunits of the Cops9 signalosome complex, and all three subunits of the KGDH enzyme, a key step in the TCA cycle.
This last example shows a putative connection between an Hsp70 chaperone and its associated nucleotide exchange factor. This specific interaction is not annotated in BioGrid, CORUM, or GO, but the cofactor is a homolog of both yeast and bacterial genes with the same function. [if time permits: Moreover, in a global assay of protein complexes by large-scale coelution that we performed in collaboration with Andrew Emili’s lab, we identified these two proteins as having a moderate probability of interacting.] This example represents only one of many strong predictions of cofunctionality that come out of this network.
A more focused approach uses synthetic lethality to find candidate therapeutic targets. In this example, Gene B is essential only in the context of the somatic mutation in allele a, not wildtype A, and a therapy that targets B should in principle preferentially destroy cancer cells. As noted in this review, the ability to screen for these context-specific essentials has grown in concert with the availability of reagents to do systematic perturbation screens in human cells.