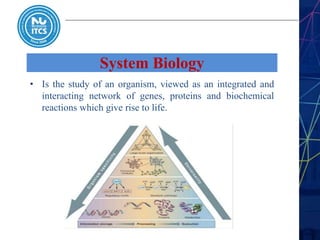
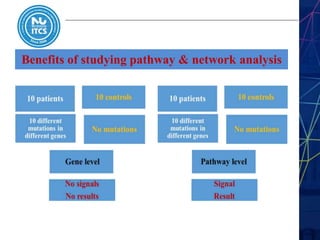
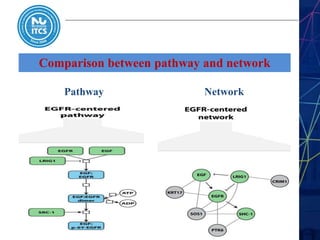
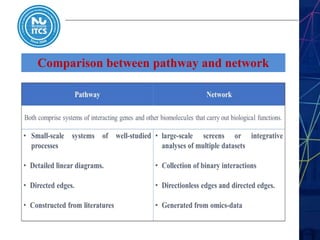
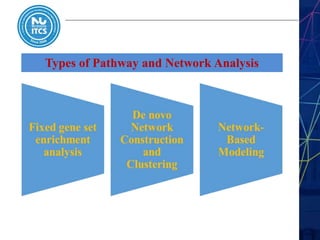
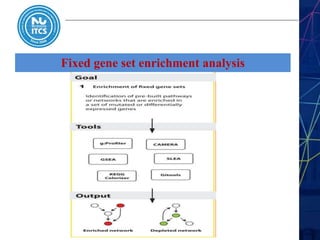
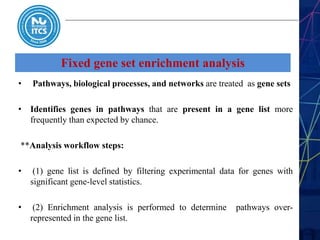
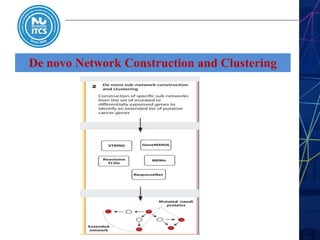
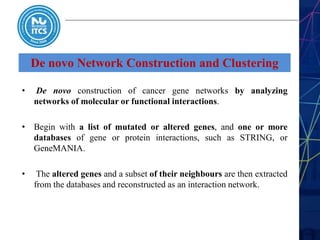
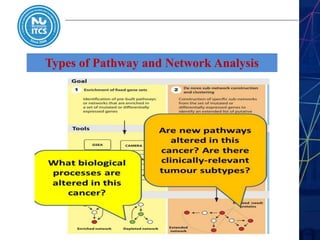
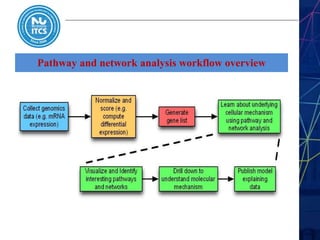
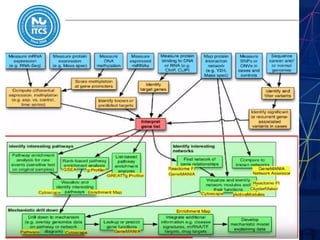
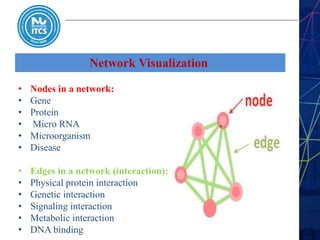
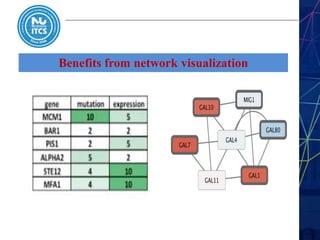
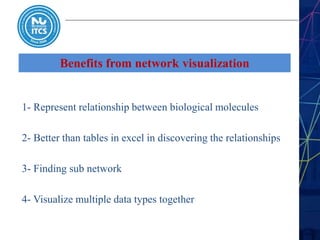
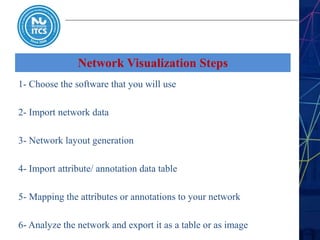
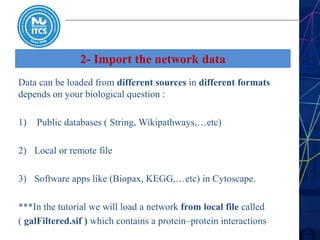
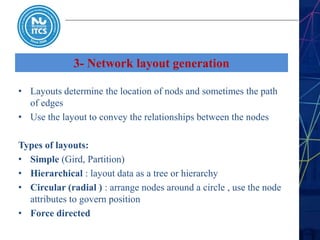
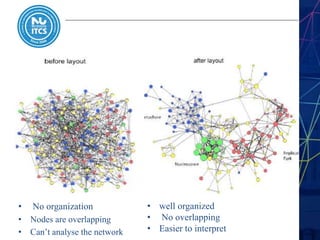
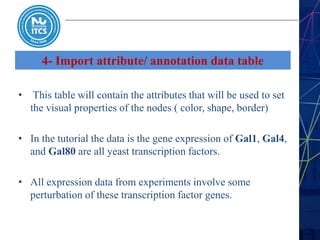
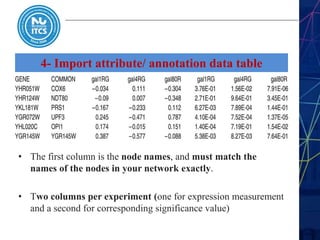
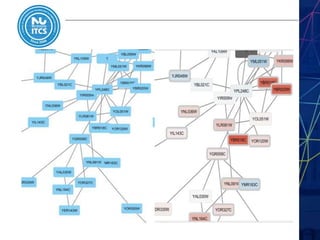
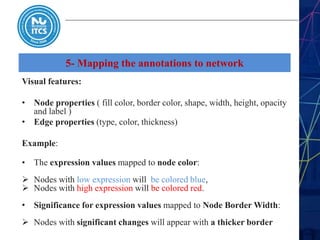
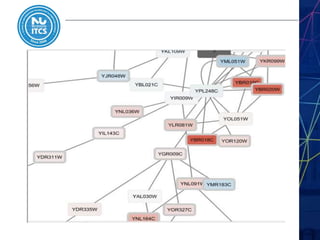
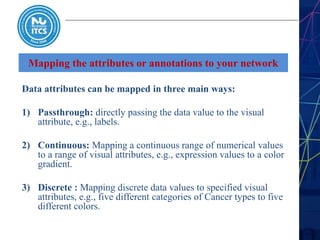
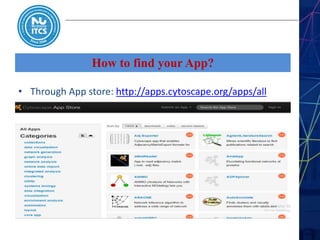
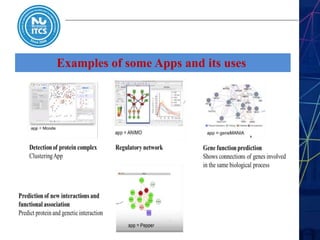
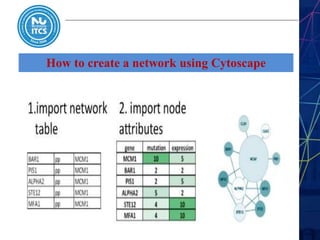
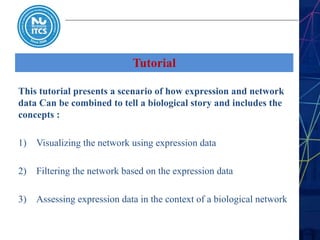
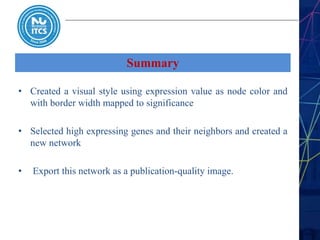
w w w . n u . e g
Pathway and Network Analysis
Presented by:
Manar-Aleslam Mattar
• 3
Lecture outline
• System biology
• Biological Networks
• Benefits of studying pathway & network analysis
• Comparison between pathway and network
• Types of Pathway and Network Analysis
• Pathway and network analysis workflow overview
• Network Visualization
• Network Visualization Steps
• Cytoscape
• Tutorial
System Biology
• Is the study of an organism, viewed as an integrated and
interacting network of genes, proteins and biochemical
reactions which give rise to life.
Biological Networks
• Networks represent relationships between different
biological molecules.
**Examples of different types of relationships in a biology:
1- protein-protein interaction network
2- Genetic interactions revealed by combinations of mutations.
Benefits of studying pathway & network analysis
1- Improve the statistical power.
2- Results concepts are easier to interpret.
3- Potential causal mechanisms can be identified.
4- More reproducible.
5- Facilitate the integration of multiple data types.
Comparison between pathway and network
NetworkPathway
Comparison between pathway and network
Types of Pathway and Network Analysis
Fixed gene set enrichment analysis
• Pathways, biological processes, and networks are treated as gene sets
• Identifies genes in pathways that are present in a gene list more
frequently than expected by chance.
**Analysis workflow steps:
• (1) gene list is defined by filtering experimental data for genes with
significant gene-level statistics.
• (2) Enrichment analysis is performed to determine pathways over-
represented in the gene list.
De novo Network Construction and Clustering
• De novo construction of cancer gene networks by analyzing
networks of molecular or functional interactions.
• Begin with a list of mutated or altered genes, and one or more
databases of gene or protein interactions, such as STRING, or
GeneMANIA.
• The altered genes and a subset of their neighbours are then extracted
from the databases and reconstructed as an interaction network.
Types of Pathway and Network Analysis
Pathway and network analysis workflow overview
Network Visualization
• Nodes in a network:
• Gene
• Protein
• Micro RNA
• Microorganism
• Disease
• Edges in a network (interaction):
• Physical protein interaction
• Genetic interaction
• Signaling interaction
• Metabolic interaction
• DNA binding
Benefits from network visualization
1- Represent relationship between biological molecules
2- Better than tables in excel in discovering the relationships
3- Finding sub network
4- Visualize multiple data types together
Network Visualization Steps
1- Choose the software that you will use
2- Import network data
3- Network layout generation
4- Import attribute/ annotation data table
5- Mapping the attributes or annotations to your network
6- Analyze the network and export it as a table or as image
1- Software to create and analyze networks
2- Import the network data
Data can be loaded from different sources in different formats
depends on your biological question :
1) Public databases ( String, Wikipathways,…etc)
2) Local or remote file
3) Software apps like (Biopax, KEGG,…etc) in Cytoscape.
***In the tutorial we will load a network from local file called
( galFiltered.sif ) which contains a protein–protein interactions
3- Network layout generation
• Layouts determine the location of nods and sometimes the path
of edges
• Use the layout to convey the relationships between the nodes
Types of layouts:
• Simple (Gird, Partition)
• Hierarchical : layout data as a tree or hierarchy
• Circular (radial ) : arrange nodes around a circle , use the node
attributes to govern position
• Force directed
• No organization
• Nodes are overlapping
• Can’t analyse the network
• well organized
• No overlapping
• Easier to interpret
4- Import attribute/ annotation data table
• This table will contain the attributes that will be used to set
the visual properties of the nodes ( color, shape, border)
• In the tutorial the data is the gene expression of Gal1, Gal4,
and Gal80 are all yeast transcription factors.
• All expression data from experiments involve some
perturbation of these transcription factor genes.
4- Import attribute/ annotation data table
• The first column is the node names, and must match the
names of the nodes in your network exactly.
• Two columns per experiment (one for expression measurement
and a second for corresponding significance value)
5- Mapping the annotations to network
Visual features:
• Node properties ( fill color, border color, shape, width, height, opacity
and label )
• Edge properties (type, color, thickness)
Example:
• The expression values mapped to node color:
 Nodes with low expression will be colored blue,
 Nodes with high expression will be colored red.
• Significance for expression values mapped to Node Border Width:
 Nodes with significant changes will appear with a thicker border
Mapping the attributes or annotations to your network
Data attributes can be mapped in three main ways:
1) Passthrough: directly passing the data value to the visual
attribute, e.g., labels.
2) Continuous: Mapping a continuous range of numerical values
to a range of visual attributes, e.g., expression values to a color
gradient.
3) Discrete : Mapping discrete data values to specified visual
attributes, e.g., five different categories of Cancer types to five
different colors.
Cytoscape
Cytoscape
How to find your App?
• Through App store: http://apps.cytoscape.org/apps/all
Examples of some Apps and its uses
How to create a network using Cytoscape
Tutorial
This tutorial presents a scenario of how expression and network
data Can be combined to tell a biological story and includes the
concepts :
1) Visualizing the network using expression data
2) Filtering the network based on the expression data
3) Assessing expression data in the context of a biological network
Tutorial
VIDEO
Summary
• Created a visual style using expression value as node color and
with border width mapped to significance
• Selected high expressing genes and their neighbors and created a
new network
• Export this network as a publication-quality image.
Results
• Both nodes GAL4 and GAL11 are pale blue with thin
borders which means they are low expressed and with no
significant changes in expression.
• GAL4 interacts with GAL80, which shows a significant
level of repression: it is medium blue with a thicker border.
• most nodes interacting with GAL4 show significant levels
of induction: they are rendered as red rectangles.
Further Reading
THANK YOU!
w w w . n u . e g

Pathway and network analysis

  • 1.
    w w w. n u . e g Pathway and Network Analysis
  • 2.
    Pathway and NetworkAnalysis Presented by: Manar-Aleslam Mattar
  • 3.
    • 3 Lecture outline •System biology • Biological Networks • Benefits of studying pathway & network analysis • Comparison between pathway and network • Types of Pathway and Network Analysis • Pathway and network analysis workflow overview • Network Visualization • Network Visualization Steps • Cytoscape • Tutorial
  • 4.
    System Biology • Isthe study of an organism, viewed as an integrated and interacting network of genes, proteins and biochemical reactions which give rise to life.
  • 5.
    Biological Networks • Networksrepresent relationships between different biological molecules. **Examples of different types of relationships in a biology: 1- protein-protein interaction network 2- Genetic interactions revealed by combinations of mutations.
  • 6.
    Benefits of studyingpathway & network analysis
  • 7.
    Benefits of studyingpathway & network analysis 1- Improve the statistical power. 2- Results concepts are easier to interpret. 3- Potential causal mechanisms can be identified. 4- More reproducible. 5- Facilitate the integration of multiple data types.
  • 8.
    Comparison between pathwayand network NetworkPathway
  • 9.
  • 10.
    Types of Pathwayand Network Analysis
  • 11.
    Fixed gene setenrichment analysis
  • 12.
    Fixed gene setenrichment analysis • Pathways, biological processes, and networks are treated as gene sets • Identifies genes in pathways that are present in a gene list more frequently than expected by chance. **Analysis workflow steps: • (1) gene list is defined by filtering experimental data for genes with significant gene-level statistics. • (2) Enrichment analysis is performed to determine pathways over- represented in the gene list.
  • 13.
    De novo NetworkConstruction and Clustering
  • 14.
    De novo NetworkConstruction and Clustering • De novo construction of cancer gene networks by analyzing networks of molecular or functional interactions. • Begin with a list of mutated or altered genes, and one or more databases of gene or protein interactions, such as STRING, or GeneMANIA. • The altered genes and a subset of their neighbours are then extracted from the databases and reconstructed as an interaction network.
  • 15.
    Types of Pathwayand Network Analysis
  • 16.
    Pathway and networkanalysis workflow overview
  • 18.
  • 19.
    Network Visualization • Nodesin a network: • Gene • Protein • Micro RNA • Microorganism • Disease • Edges in a network (interaction): • Physical protein interaction • Genetic interaction • Signaling interaction • Metabolic interaction • DNA binding
  • 20.
    Benefits from networkvisualization
  • 21.
    Benefits from networkvisualization 1- Represent relationship between biological molecules 2- Better than tables in excel in discovering the relationships 3- Finding sub network 4- Visualize multiple data types together
  • 22.
    Network Visualization Steps 1-Choose the software that you will use 2- Import network data 3- Network layout generation 4- Import attribute/ annotation data table 5- Mapping the attributes or annotations to your network 6- Analyze the network and export it as a table or as image
  • 23.
    1- Software tocreate and analyze networks
  • 24.
    2- Import thenetwork data Data can be loaded from different sources in different formats depends on your biological question : 1) Public databases ( String, Wikipathways,…etc) 2) Local or remote file 3) Software apps like (Biopax, KEGG,…etc) in Cytoscape. ***In the tutorial we will load a network from local file called ( galFiltered.sif ) which contains a protein–protein interactions
  • 26.
    3- Network layoutgeneration • Layouts determine the location of nods and sometimes the path of edges • Use the layout to convey the relationships between the nodes Types of layouts: • Simple (Gird, Partition) • Hierarchical : layout data as a tree or hierarchy • Circular (radial ) : arrange nodes around a circle , use the node attributes to govern position • Force directed
  • 27.
    • No organization •Nodes are overlapping • Can’t analyse the network • well organized • No overlapping • Easier to interpret
  • 28.
    4- Import attribute/annotation data table • This table will contain the attributes that will be used to set the visual properties of the nodes ( color, shape, border) • In the tutorial the data is the gene expression of Gal1, Gal4, and Gal80 are all yeast transcription factors. • All expression data from experiments involve some perturbation of these transcription factor genes.
  • 29.
    4- Import attribute/annotation data table • The first column is the node names, and must match the names of the nodes in your network exactly. • Two columns per experiment (one for expression measurement and a second for corresponding significance value)
  • 31.
    5- Mapping theannotations to network Visual features: • Node properties ( fill color, border color, shape, width, height, opacity and label ) • Edge properties (type, color, thickness) Example: • The expression values mapped to node color:  Nodes with low expression will be colored blue,  Nodes with high expression will be colored red. • Significance for expression values mapped to Node Border Width:  Nodes with significant changes will appear with a thicker border
  • 33.
    Mapping the attributesor annotations to your network Data attributes can be mapped in three main ways: 1) Passthrough: directly passing the data value to the visual attribute, e.g., labels. 2) Continuous: Mapping a continuous range of numerical values to a range of visual attributes, e.g., expression values to a color gradient. 3) Discrete : Mapping discrete data values to specified visual attributes, e.g., five different categories of Cancer types to five different colors.
  • 34.
  • 35.
  • 36.
    How to findyour App? • Through App store: http://apps.cytoscape.org/apps/all
  • 37.
    Examples of someApps and its uses
  • 38.
    How to createa network using Cytoscape
  • 39.
    Tutorial This tutorial presentsa scenario of how expression and network data Can be combined to tell a biological story and includes the concepts : 1) Visualizing the network using expression data 2) Filtering the network based on the expression data 3) Assessing expression data in the context of a biological network
  • 40.
  • 41.
    Summary • Created avisual style using expression value as node color and with border width mapped to significance • Selected high expressing genes and their neighbors and created a new network • Export this network as a publication-quality image.
  • 44.
    Results • Both nodesGAL4 and GAL11 are pale blue with thin borders which means they are low expressed and with no significant changes in expression. • GAL4 interacts with GAL80, which shows a significant level of repression: it is medium blue with a thicker border. • most nodes interacting with GAL4 show significant levels of induction: they are rendered as red rectangles.
  • 45.
  • 46.
    THANK YOU! w ww . n u . e g