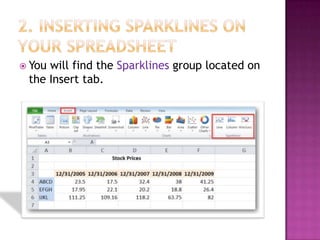
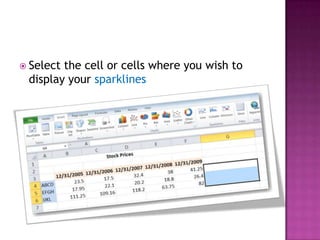
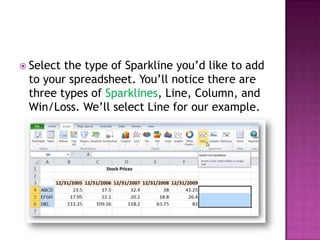
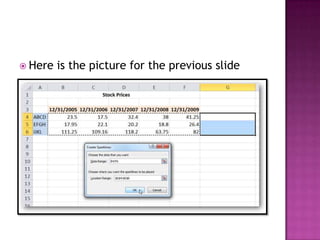
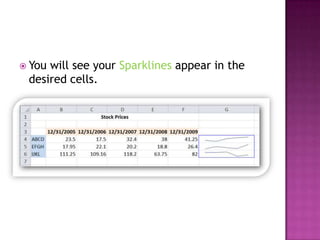
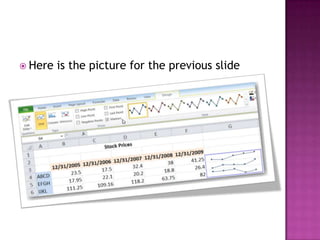
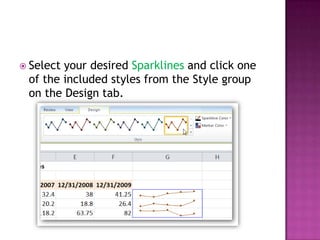
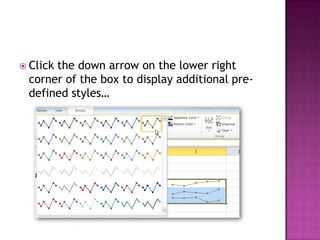
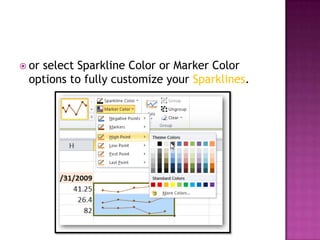
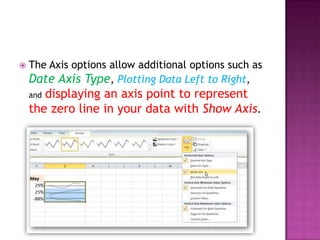
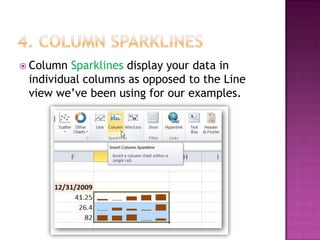
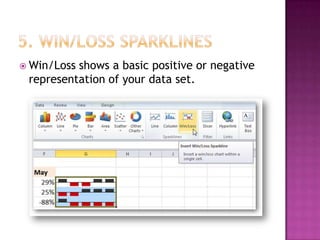
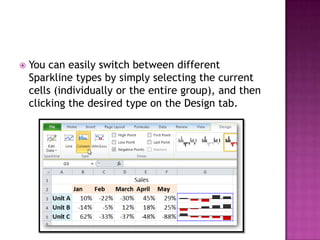
Name: Sopheak Heng
ID: 12010112
Major: Civil Engineering
Date: June 6th, 2013
 Information
 Inserting Sparklines on your Spreadsheet
 Customizing Sparklines
 Column Sparklines
 Win/Loss Sparklines

Sparklines
 You will find the Sparklines group located on
the Insert tab.
 Select the cell or cells where you wish to
display your sparklines
 Select the type of Sparkline you’d like to add
to your spreadsheet. You’ll notice there are
three types of Sparklines, Line, Column, and
Win/Loss. We’ll select Line for our example.
 A Create Sparklines pops up and will prompt
you to enter a Data Range you are using to
create the Sparklines. You’ll notice that the
location range (the range where the
Sparklines will appear) is already filled in.
 You can type in the data range manually, or
click and drag with your mouse across to
select the data range. This will auto-fill the
data range for you. Click OK when you are
finished.
 Here is the picture for the previous slide
 You will see your Sparklines appear in the
desired cells.
 Select the one of more of the Sparklines to
reveal the Design tab. You can display certain
value points like high and low points,
negative points, and first and last points by
selecting the corresponding options from the
Show group. You can also mark all value
points by selecting Markers.
 Here is the picture for the previous slide
 Select your desired Sparklines and click one
of the included styles from the Style group
on the Design tab.
 Click the down arrow on the lower right
corner of the box to display additional pre-
defined styles…
 or select Sparkline Color or Marker Color
options to fully customize your Sparklines.
 The Axis options allow additional options such as
Date Axis Type, Plotting Data Left to Right,
and displaying an axis point to represent
the zero line in your data with Show Axis.
 Column Sparklines display your data in
individual columns as opposed to the Line
view we’ve been using for our examples.
 Win/Loss shows a basic positive or negative
representation of your data set.
 You can easily switch between different
Sparkline types by simply selecting the current
cells (individually or the entire group), and then
clicking the desired type on the Design tab.
 For those that may be more visually
oriented, can be a wonderful
addition to any spreadsheet.
 http://www.howtogeek.com/howto/16759/h
ow-to-use-sparklines-in-excel-2010/
 images.google.com
Slideshare link
 http://www.slideshare.net/

How to Use Sparklines in Microsoft Excel 2010

  • 1.
    Name: Sopheak Heng ID:12010112 Major: Civil Engineering Date: June 6th, 2013
  • 2.
     Information  InsertingSparklines on your Spreadsheet  Customizing Sparklines  Column Sparklines  Win/Loss Sparklines
  • 3.
  • 4.
     You willfind the Sparklines group located on the Insert tab.
  • 5.
     Select thecell or cells where you wish to display your sparklines
  • 6.
     Select thetype of Sparkline you’d like to add to your spreadsheet. You’ll notice there are three types of Sparklines, Line, Column, and Win/Loss. We’ll select Line for our example.
  • 7.
     A CreateSparklines pops up and will prompt you to enter a Data Range you are using to create the Sparklines. You’ll notice that the location range (the range where the Sparklines will appear) is already filled in.  You can type in the data range manually, or click and drag with your mouse across to select the data range. This will auto-fill the data range for you. Click OK when you are finished.
  • 8.
     Here isthe picture for the previous slide
  • 9.
     You willsee your Sparklines appear in the desired cells.
  • 10.
     Select theone of more of the Sparklines to reveal the Design tab. You can display certain value points like high and low points, negative points, and first and last points by selecting the corresponding options from the Show group. You can also mark all value points by selecting Markers.
  • 11.
     Here isthe picture for the previous slide
  • 12.
     Select yourdesired Sparklines and click one of the included styles from the Style group on the Design tab.
  • 13.
     Click thedown arrow on the lower right corner of the box to display additional pre- defined styles…
  • 14.
     or selectSparkline Color or Marker Color options to fully customize your Sparklines.
  • 15.
     The Axisoptions allow additional options such as Date Axis Type, Plotting Data Left to Right, and displaying an axis point to represent the zero line in your data with Show Axis.
  • 16.
     Column Sparklinesdisplay your data in individual columns as opposed to the Line view we’ve been using for our examples.
  • 17.
     Win/Loss showsa basic positive or negative representation of your data set.
  • 18.
     You caneasily switch between different Sparkline types by simply selecting the current cells (individually or the entire group), and then clicking the desired type on the Design tab.
  • 19.
     For thosethat may be more visually oriented, can be a wonderful addition to any spreadsheet.
  • 21.