Download to read offline
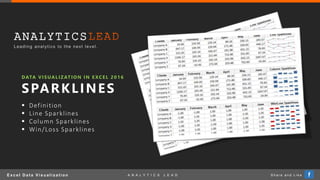
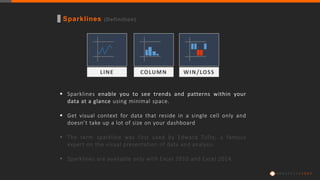

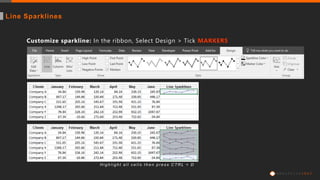

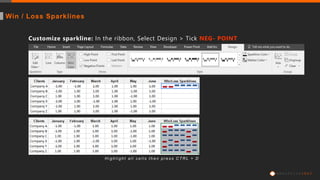


The document describes sparklines in Excel 2016, which are minimalistic visual representations of data trends and patterns within a single cell. It provides instructions on creating and customizing three types of sparklines: line, column, and win/loss. First introduced by Edward Tufte, sparklines are a useful tool for enhancing data visualization in dashboards.


