The impact of mining and mineral extraction activities can be significant on the surrounding land,
water and air bodies, in any operational area. The environmental degradation ranges from localized surface and
ground water contamination to the damaging effects of airborne pollutants on the regional ecosystem; which
need the properly designed geospatial database. The monitoring of these environmental impacts requires a userfriendly
and cost effective method to quantify the land cover changes over large time periods. Now-a-days, it
has become compulsory to use the remote sensing techniques for regular monitoring of these environmental
hazards in-and-around the mining areas using cadastral map. This paper provides a case study on the use of
geospatial techniques for environmental monitoring in the mining areas.
Role of remote sensing and gis in infrastructural plan and identifying ecolog...PRADEEP M.S
The .ppt has made for to present and get Master of Science degree on Applied Geography and Geoinformatics from Central University of Karnataka Kalaburgi.
Application of GIS in Modelling Landuse Changes Of Gurupavanapuri, Kerala, IndiaSharik Shamsudhien
The Project Presentation focuses on the land use and land cover change pattern of Gurupavanapuri and environs, an area which is in the State of Kerala , India.
The work was mainly aimed to identify the rapid urbanization that took over in the Gurupavanapuri and its environs during the year 2002 and 2017 and on analysis there was a clear reduction of natural vegetated area due to the human influenced constructions.
The Project was completed using The ArcGis which is a GIS application. Remote Sensing data collection, such as SRTM DEM, ETOPO1 data (Bathymetry and Oceanic bedrock surface) has been achieved.
Land Use Land Cover Change Detection of Gulbarga City Using Remote Sensing an...ijsrd.com
Land use and land cover(LULC) recently these days became a major component to handle natural resources and managing changes occurring in the environment.which is due to expansion of the urban area it has lead to critical losses of agriculture land,vegetation land and water bodies.followed by this the urban sprawl created a environmental issues. For example :decreased air quality and increase in the temperature etc. Land use and land cover change is driven by human actions and also drives changes that limit availability of products and services for human and animals, and it can undermine ecological wellbeing also. Land use and land cover is an important component in understanding various interactions of the human activities with the environment and thus it is necessary to be able to simulate changes. Therefore, this study was aimed at understanding land use and land cover change in Gulbarga city. In this work we took Gulbarga city to study the urban expansion and LULC change that took place in 2001 and 2012 to know the changes happened in the year 2012 by comparing with data of 2001.remote sensing methodology is used in this study which provides major coverage mapping & classification of land cover features such as vegetation,soil,water,forest etc. A wide range of environmental parameters can be measured including the land use, vegetation types, surface temperatures , soil types, precipitation, phytoplankton, turbidity, surface elevation and geology.satellite images of two different years i.e 2001 and 2012 are taken in to consideration.after image processing classification is done so as to classify images in to various different land use categories.
Land Use/Land Cover Mapping Of Allahabad City by Using Remote Sensing & GIS IJMER
The present study was carried out to produce and evaluate the land use/land cover maps by on
screen visual interpretation. The studies of land cover of Allahabad city (study area) consist of 87517.47 ha
out of which 5500.35 ha is build up land (Urban / Rural) Area. In this respect, the Build up land (Urban /
Rural) area scorers 6.28% of the total area. It has also been found that about 17155.001ha (19.60 %) of
area is covered by current fallow land. The double/triple crop land of 30178.44ha (34.84%). The area
covered by gullied / ravines is 1539.20 ha (1.75 %) and that of the kharif crop land is 2828.00 ha (3.23 %).
The area covered by other wasteland is 2551.05ha (2.91%). Table 4.1 shows the area distribution of the
various land use and land cover of Allahabad city.
Application of GIS in Mine Contamination and Associated Environmental ImpactsArsalan Syed, PMP
• The purpose of this project was to apply GIS and remote sensing methods to determine the spatial extent and level of pollution at mining sites in order to develop or implement the best approach and technique in prevention and reclamation.
• Two case studies were analyzed to understand the importance of remediation and the human, ecological, and socio-cultural impacts of acid mine drainage.
Change detection analysis in land use / land cover of Pune city using remotel...Nitin Mundhe
Lecture delivered in the National Conference entitled “Monitoring Degraded Lands” jointly organized by Agasti Arts, Commerce and Dadasaheb Rupwate Science
College, Akole and Maharashtra Bhugolshastra Parishad Pune to be held on 4 to 6 February 2014.
LAND USE /LAND COVER CLASSIFICATION AND CHANGE DETECTION USING GEOGRAPHICAL I...IAEME Publication
Land use and land cover change has become a central component in current strategies for managing natural resources and monitoring environmental changes. Geographical information system and image processing techniques used for the analysis of land use/land cover and change detection of Sukhana Basin of Aurangabad District, Maharashtra state. The tools used ArcGIS10.1 and ERDAS IMAGINE9.1, landsat images of 1996, 2003and 2014. From land use / land cover change detection it is found that during 1996-2014, water bodies cover have loss of 4 Sq. Km. Barren land have 146 Sq.Km. loss and forest area with 96 Sq.Km. loss. It is found that urbanization area has gain of 51 Sq.Km. and agricultural land cover also have gain of 195 Sq.Km.
land use land cover change detection in a part of ramganga river basin, at ...INFOGAIN PUBLICATION
The paper deals with the status of the land use/land cover change taken place in a part of Ramganga River Basin, at Bareilly district, Uttar Pradesh, India, by using remote sensing satellite data. The present study area is confined to latitude 28°10′ to 28054ʹ North and longitude 78°58′ to 78o58ʹ East, covering an area of 4120 km2. The satellite images of 1979 and 2009 have been obtained from global land cover facility (GLCF) and examined by unsupervised classification method. The general classification level has been adopted. The identified classes include Settlements, Croplands, Vegetation/Plantations, Water Bodies, and Waste Land. The result shows increasing trend of crop land and built up area and decreasing trend of vegetation and Plantation land.
The presentation was given by Mr. Bas Kempen & Ms. V.L. Mulder, ISRIC, during the GSOC Mapping Global Training hosted by ISRIC - World Soil Information, 6 - 23 June 2017, Wageningen (The Netherlands).
Evaluation of Groundwater Resource Potential using GIS and Remote Sensing App...IJERA Editor
Environment and Development are the two wheels of the cart. However, they become antagonists at some
points. It has been witnessed many a times that development is done at the cost of environment. Analysis and
assessment tools like GIS along with Remote Sensing have proved to be very efficient and effective and hence
useful for management of natural resources. Groundwater is a precious resource of limited extent. In order to
ensure a judicious use of groundwater, proper evaluation is required. There is an urgent need of planned and
optimal development of water resources. An appropriate strategy is required to develop water resources with
planning based on conjunctive use of surface and subsurface water resources. Integrated remote sensing and GIS
can provide the appropriate platform for convergent analysis of diverse data sets for decision making in
groundwater management and planning. Sustainable water resources development and management necessarily
depends on proper planning, implementation, operation and maintenance. The interpretation of remote sensing
data in conjunction with conventional data and sufficient ground truth information makes it possible to identify
and outline various ground features such as geological structures, geomorphic features and their hydrologic
characters that may serve as direct or indirect indicators of the presence of ground and surface water. Remotely
sensed data provides unbiased information on geology, geomorphology, structural pattern and recharging
conditions, which logically define the groundwater regime of an area. Groundwater resource potential has been
evaluated in Pulivendula-Sanivaripalli, Kadapa district, Andhra Pradesh, India, using remote sensing and
Geographic information system. Under this study, three thematic maps viz. Geological map (Lithology and
Structure), Geomorphological map and Hydro morphological maps were prepared. These thematic maps have
been integrated with the help of GIS. Appropriate weightage has been assigned to various factors controlling
occurrence of groundwater to assess the groundwater potential in each segment of the study area. The area has
been classified into high potential, moderate potential, low potential and non-potential zones landforms ground
water development on the basis of hydromorphological studies. Some of the favorable locations have been
suggested to impound the excessive run off so as to augment the ground water resources of the area.
GIS and Remote Sensing in Diagnosis and Management of Problem Soil with audio...KaminiKumari13
GIS and Remote Sensing in Diagnosis and Management of Problem Soil for agriculture, soil science, agronomy, forestry, land management and planning with audio by Dr. Kamini Roy
Photogrammetry & Remote Sensing applications in EngineeringAmira Abdallah
Photogrammetry & Remote Sensing became one of the most important types of
science for Engineers in many ways and methods to apply in various fields,
especially in civil engineering applications.
In this report, I shall pay attention to these applications and discuss one of them in
details (Suez Canal area development Project)
The Presentation gives the overview of the process necessary for accomplishing the task for the preparation of Ground water movements and identification carried out by Rajiv gandhi national drinking water mission project.
Building Spatial Data Infrastructures for Spatial Planning in Africa: Lagos e...Samuel Dekolo
Lagos is the fastest growing Megacity in Sub-Saharan Africa, with its population estimated to double in the first quarter of this century; it is expected to be the third largest urban agglomerations in the world. This growth is not without challenges, as the city is grappling with myriads of urban management problems. City planners lack the most important ingredient of land use management, which is Information. In spite of huge investment on spatial data infrastructures at the national and state levels of government, most land use planners at both state and local government level agencies are ignorant of existing geospatial technology portals and unlock the full potentials of information and communication technologies. A statewide survey of the spatial data infrastructures of the city’s urban and land use management ministry and agencies proves its pathetic state, thereby creating information gap void between urban development and intelligent management. The result is has led to a sporadic growth of slums and unplanned settlements which now accounts for over 60% of the city. To avoid an impasse, it is necessary to review the level of geospatial technologies used at the local level and recommend formidable means of integration in the decision making process. This paper examines the level of geospatial technologies and Spatial Data Infrastructure use in spatial planning agencies and barriers to implementation in the 20 local governments of Lagos State and suggests the way forward.
András Sipos (Budapest City Archives; HU) presenting the e-proceedings of the ICARUS workshop “Cartography and Cadastral Maps: Visions from the past, for a vision of our future” - held in Pisa, October 2013 - on 28.04.2015 at the international conference "Archival Cooperation and Community Building in the Digital Age" within the panel “Building from scratch: written heritage online" at Břevnov Archabbey in Prague (CZ).
Identification Of Ground Water Potential Zones In Tamil Nadu By Remote Sensin...IJERA Editor
A case study was conducted to find out the groundwater potential zones in Salem, Erode and Namakkal districts, Tamil Nadu, India with an aerial extent of 360.60 km2. The thematic maps such as geology, geomorphology, soil hydrological group, land use / land cover and drainage map were prepared for the study area. The Digital Elevation Model (DEM) has been generated from the 10 m interval contour lines (which is derived from SOI, Toposheet 1:25000 scale) and obtained the slope (%) of the study area. The groundwater potential zones were obtained by overlaying all the thematic maps in terms of weighted overlay methods using the spatial analysis tool in Arc GIS 9.3. During weighted overlay analysis, the ranking has been given for each individual parameter of each thematic map and weights were assigned according to the influence such as soil −25%, geomorphology − 25%, land use/land cover −25%, slope − 15%, lineament − 5% and drainage / streams − 5% and find out the potential zones in terms of good, moderate and poor zones with the area of 49.70 km2, 261.61 km2 and 46.04 km2 respectively. The potential zone wise study area was overlaid with village boundary map and the village wise groundwater potential zones with three categories such as good, moderate and poor zones were obtained. This GIS based output result was validated by conducting field survey by randomly selecting wells in different villages using GPS instruments. The coordinates of each well location were obtained by GPS and plotted in the GIS platform and it was clearly shown that the well coordinates were exactly seated with the classified zones.
Abstract Remote sensing has its application in various fields like geology and mineral exploration, geomorphology and modern geomorphic process modeling, nature mitigation studies, hazard zone mapping, eco system study in hills, plains, riverine, coastal, marine and volcanic landforms, forest and biomass inventory, fishery. Remote sensing plays a vital in various fields. This technique along with the GIS has been to study the geomorphological, hydro geological, land use/land cover, lithological, structural aspects/ features in the parts of Anaimalai, Pollachi and Udumalpet block of TamilNadu. Integrated approach using geographic information system provides cost effective support in resources inventory including land use mapping, comprehensive data base for resources, analytical tools for decision making and impact analysis for plan evaluation. GIS accept large volumes of spatial data derived from a variety of sources and effectively store, retrieve, manipulate, analyze and display all forms of geographically referenced information. Maps and statistical data can be obtained from the spatial integration and analysis of an area using GIS software. In order to assess the natural resource availability and its potentiality in parts of Anaimalai, Pollachi and Udumalpet block, Tamil Nadu, an integrated remote sensing and GIS based study has been conducted by adopting the standard procedures. The groundwater potential zone of any area is depends on geological formations; geomorphologic unit’s recharges characters, topography, and thickness of weathered and fractured zones. In the present study, area was taken to locate groundwater potential zones by integrated different thematic maps, remote sensing and geographic information system techniques. To find out the ground water potential zones, different thematic maps have been prepared and integrated each of them. They are mainly geology, geomorphology, land use / land cover, lineament etc. Groundwater potential zones have been prepared with help of integrating different thematic maps. This study area is finally to get the groundwater potential zones we have to classified few area such as high, moderate and low potential zones. Index Terms: Remote sensing, GIS, lithology, Geomorphology, Hydrology, landforms etc.
IJRET : International Journal of Research in Engineering and Technology is an international peer reviewed, online journal published by eSAT Publishing House for the enhancement of research in various disciplines of Engineering and Technology. The aim and scope of the journal is to provide an academic medium and an important reference for the advancement and dissemination of research results that support high-level learning, teaching and research in the fields of Engineering and Technology. We bring together Scientists, Academician, Field Engineers, Scholars and Students of related fields of Engineering and Technology.
Application of Remote Sensing Techniques for Change Detection in Land Use/ La...iosrjce
IOSR Journal of Applied Geology and Geophysics (IOSR-JAGG) is a double blind peer reviewed International Journal that provides rapid publication (within a month) of articles in all areas of Applied Geology and Geophysics. The journal welcomes publications of high quality papers on theoretical developments and practical applications in Applied Geology and Geophysics. Original research papers, state-of-the-art reviews, and high quality technical notes are invited for publications.
International Journal of Engineering and Science Invention (IJESI)inventionjournals
International Journal of Engineering and Science Invention (IJESI) is an international journal intended for professionals and researchers in all fields of computer science and electronics. IJESI publishes research articles and reviews within the whole field Engineering Science and Technology, new teaching methods, assessment, validation and the impact of new technologies and it will continue to provide information on the latest trends and developments in this ever-expanding subject. The publications of papers are selected through double peer reviewed to ensure originality, relevance, and readability. The articles published in our journal can be accessed online.
Land Use / Land Cover Classification of kanniykumari Coast, Tamilnadu, India....IJERA Editor
The land use/ land cover details of Kanniyakuamri coast which is Located in the southern part of Tamil Nadu (India) is studied. Satellite imagery is used to identify the Land use/ Land cover status of the study area. The software like ERDAS and Arc GIS are used to demarcate the land use / Land cover features of Kanniyakuamari coast. Remote sensing and GIS provided consistent and accurate base line information than many of the conventional surveys employed for such a task. The total area of Kanniyakumari coast is 715 sq.km. The land use / land cover classes of the study area has been categorized into thirteen such as Plantation, Sandy area, Water logged area, Scrub forest, Crop Land, Water bodies, Land with scrub, Reserve forest, Land without Scrub, Salt area, Beach Ridge, Settlement and Fallow land on the basis NRSA Classifications. Among these categories, land with scrub land is predominantly found all over the study area, It is occupied about 336.36 sq.km (44.61 percent), Crop Land 273.82 sq.km(38.29 percent), water bodies lands sharing about 20.44 sq.km (2.85 percent ), settlement occupied with 6.96 sq.km (0.97 percent), and Fallow land was occupied 13.98 sq.km ( 1.95 percent ).
Evaluation of Groundwater Resource Potential using GIS and Remote Sensing App...IJERA Editor
Environment and Development are the two wheels of the cart. However, they become antagonists at some
points. It has been witnessed many a times that development is done at the cost of environment. Analysis and
assessment tools like GIS along with Remote Sensing have proved to be very efficient and effective and hence
useful for management of natural resources. Groundwater is a precious resource of limited extent. In order to
ensure a judicious use of groundwater, proper evaluation is required. There is an urgent need of planned and
optimal development of water resources. An appropriate strategy is required to develop water resources with
planning based on conjunctive use of surface and subsurface water resources. Integrated remote sensing and GIS
can provide the appropriate platform for convergent analysis of diverse data sets for decision making in
groundwater management and planning. Sustainable water resources development and management necessarily
depends on proper planning, implementation, operation and maintenance. The interpretation of remote sensing
data in conjunction with conventional data and sufficient ground truth information makes it possible to identify
and outline various ground features such as geological structures, geomorphic features and their hydrologic
characters that may serve as direct or indirect indicators of the presence of ground and surface water. Remotely
sensed data provides unbiased information on geology, geomorphology, structural pattern and recharging
conditions, which logically define the groundwater regime of an area. Groundwater resource potential has been
evaluated in Pulivendula-Sanivaripalli, Kadapa district, Andhra Pradesh, India, using remote sensing and
Geographic information system. Under this study, three thematic maps viz. Geological map (Lithology and
Structure), Geomorphological map and Hydro morphological maps were prepared. These thematic maps have
been integrated with the help of GIS. Appropriate weightage has been assigned to various factors controlling
occurrence of groundwater to assess the groundwater potential in each segment of the study area. The area has
been classified into high potential, moderate potential, low potential and non-potential zones landforms ground
water development on the basis of hydromorphological studies. Some of the favorable locations have been
suggested to impound the excessive run off so as to augment the ground water resources of the area.
A study on geographical characteristics of the krishna western delta using gi...eSAT Publishing House
IJRET : International Journal of Research in Engineering and Technology is an international peer reviewed, online journal published by eSAT Publishing House for the enhancement of research in various disciplines of Engineering and Technology. The aim and scope of the journal is to provide an academic medium and an important reference for the advancement and dissemination of research results that support high-level learning, teaching and research in the fields of Engineering and Technology. We bring together Scientists, Academician, Field Engineers, Scholars and Students of related fields of Engineering and Technology
In developing accurate hydro geomorphological analysis, monitoring, ability to generate information in spatial and temporal domain and delineation of land features are crucial for successful analysis and prediction of groundwater resources. However, the use of RS and GIS in handling large amount of spatial data provides to gain accurate information for delineating the geological and geomorphological characteristics and allied significance, which are considered as a controlling factor for the occurrence and movement of groundwater used IRS LISS II data on 1: 50000 scale along with topographic maps in various parts of India to develop integrated groundwater potential zone
Efficiency and Capability of Remote Sensing (RS) and Geographic Information ...nitinrane33
In this review paper, the potential of remote sensing (RS) and geographic information systems (GIS) for sustainable groundwater management and development is explored. Recent literature on the use of RS and GIS in groundwater resource management is analyzed, evaluating the efficiency and capability of these technologies throughout various stages of groundwater management. Challenges and limitations associated with their use are also highlighted, with potential solutions proposed to overcome them. Ultimately, the review concludes that RS and GIS are powerful tools for sustainable groundwater management and development, with significant benefits in terms of cost-effectiveness, accuracy, and time-efficiency. However, more research is needed to improve their integration in groundwater management and address current limitations. Overall, this review offers valuable insights into the potential of RS and GIS in sustainable groundwater management and development.
Cars are a very important part of this modern world because they give luxury and comfort. Even
though they are comfortable, some problems always keep arising on the safety side. After a lot of research they
rectified certain problems using air bags, auto parking, turbo charger, pedal shift…, etc.
And now we are going to discuss about one such problem that arises on the safety side. An unsuspected
accident occurs when people smash their fingers in between the car doors. Due to this kind of accident around
120,000 people are injured every year. But this was not taken as a very major safety concern for the customer.
To avoid this kind accident due to car doors, we are introducing “SAFETY DOOR LOCK SYSTEM”
with the help of “HYDRAULIC PISTON AND IR SENSORS”.
The major working process of the “SAFETY DOOR LOCK SYSTEM”is, when a person places his/her
hand or fingers in the gap between the door and the outer panel, at the time when the closing action of the door
takes place, the Sensors start to transmit the Infra Red Rays to the Receivers at the
other end, and so even if someone closes the door without anybody‟s knowledge the hydraulic piston will
automatically come out and stop the door from closing and prevent the person from the unsuspected accident
and minor injuries by the car door and ensure maximum safety to the customer.
Extrusion can be defined as the process of subjecting a material to compression so that it is forced to
flow through an opening of a die and takes the shape of the hole. Multi-hole extrusion is the process of
extruding the products through a die having more than one hole. Multi-hole extrusion increases the production
rate and reduces the cost of production. In this study the ram force has calculated experimentally for single hole
and multi-hole extrusion. The comparison of ram forces between the single hole and multi-hole extrusion
provides the inverse relation between the numbers of holes in a die and ram force. The experimental lengths of
the extruded products through the various holes of multi-hole die are different. It indicates that the flow pattern
is dependent on the material behavior. The micro-hardness test has done for the extruded products of lead
through multi-hole die. It is observed that the hardness of the extruded lead products from the central hole is
found to be more than that of the products extruded from other holes. The study suggests that multi-hole
extrusion can be used for obtaining the extruded products of lead with varying hardness. The micro-structure
study has done for the lead material before and after extrusion. It is observed that the size of grains of lead
material after extrusion is smaller than the original lead.
Analysis of Agile and Multi-Agent Based Process Scheduling Modelirjes
As an answer of long growing frustration of waterfall Software development life cycle concepts,
agile software development concept was evolved in 90’s. The most popular agile methodologies is the Extreme
Programming (XP). Most software companies nowadays aim to produce efficient, flexible and valuable
Software in short time period with minimal costs, and within unstable, changing environments. This complex
problem can be modeled as a multi-agent based system, where agents negotiate resources. Agents can be used to
represent projects and resources. Crucial for the multi-agent based system in project scheduling model, is the
availability of an effective algorithm for prioritizing and scheduling of task. To evaluate the models, simulations
were carried out with real life and several generated data sets. The developed model (Multi-agent based System)
provides an optimized and flexible agile process scheduling and reduces overheads in the software process as it
responds quickly to changing requirements without excessive work in project scheduling.
Effects of Cutting Tool Parameters on Surface Roughnessirjes
This paper presents of the influence on surface roughness of Co28Cr6Mo medical alloy machined
on a CNC lathe based on cutting parameters (rotational speed, feed rate, depth of cut and nose radius).The
influences of cutting parameters have been presented in graphical form for understanding. To achieve the
minimum surface roughness, the optimum values obtained for rpm, feed rate, depth of cut and nose radius were
respectively, 318 rpm, 0,1 mm/rev, 0,7 mm and 0,8 mm. Maximum surface roughness has been revealed the
values obtained for rpm, feed rate, depth of cut and nose radius were respectively, 318 rpm, 0,25 mm/rev, 0,9
mm and 0,4 mm.
Possible limits of accuracy in measurement of fundamental physical constantsirjes
The measurement uncertainties of Fundamental Physical Constants should take into account all
possible and most influencing factors. One from them is the finiteness of the model that causes the existence of
a-priori error. The proposed formula for calculation of this error provides a comparison of its value with the
actual experimental measurement error that cannot be done an arbitrarily small. According to the suggested
approach, the error of the researched Fundamental Physical Constant, measured in conventional field studies,
will always be higher than the error caused by the finite number of dimensional recorded variables of physicalmathematical
models. Examples of practical application of the considered concept for measurement of fine
structure constant, speed of light and Newtonian constant of gravitation are discussed.
Performance Comparison of Energy Detection Based Spectrum Sensing for Cogniti...irjes
With the rapid deployment of new wireless devices and applications, the last decade has witnessed a growing
demand for wireless radio spectrum. However, the policy of fixed spectrum assignment produces a bottleneck for more
efficient spectrum utilization, such that a great portion of the licensed spectrum is severely under-utilized. So the concept of
cognitive radio was introduced to address this issue.The inefficient usage of the limited spectrum necessitates the
development of dynamic spectrum access techniques, where users who have no spectrum licenses, also known as secondary
users, are allowed to use the temporarily unused licensed spectrum. For this purpose we have to know the presence or
absence of primary users for spectrum usage. So spectrums sensing is one of the major requirements of cognitive radio.Many
spectrum sensing techniques have been developed to sense the presence or absence of a licensed user. This paper evaluates
the performance of the energy detection based spectrum sensing technique in noisy and fading environments.The
performance of the energy detection technique will be evaluated by use of Receiver Operating Characteristics (ROC) curves
over additive white Gaussian noise (AWGN) and fading channels.
Comparative Study of Pre-Engineered and Conventional Steel Frames for Differe...irjes
In this paper, the conventional steel frames having triangular Pratt truss as a roofing system of 60 m
length, span 30m and varying bay spacing 4m, 5m and 6m respectively having eaves level for all the portals is at
10m and the EOT crane is supported at the height of 8m from ground level and pre-engineered steel frames of
same dimensions are analyzed and designed for wind zones (wind zone 2, wind zone 3, wind zone 4 and wind
zone 5) by using STAAD Pro V8i. The study deals with the comparative study of both conventional and preengineered
with respect to the amount of structural steel required, reduction in dead load of the structure.
Flip bifurcation and chaos control in discrete-time Prey-predator model irjes
The dynamics of discrete-time prey-predator model are investigated. The result indicates that the
model undergo a flip bifurcation which found by using center manifold theorem and bifurcation theory.
Numerical simulation not only illustrate our results, but also exhibit the complex dynamic behavior, such as the
periodic doubling in period-2, -4 -8, quasi- periodic orbits and chaotic set. Finally, the feedback control method
is used to stabilize chaotic orbits at an unstable interior point.
Energy Awareness and the Role of “Critical Mass” In Smart Citiesirjes
A Smart City could be depicted as a place, logical and physical, in which a crowd of heterogeneous
entities is related in time and space through different types of interactions. Any type of entity, whether it is a
device or a person, clustered in communities, becomes a source of context-based data.
Energy awareness is able to drive the process of bringing our society to limit energy waste and to optimize
usage of available resources, causing a strong environmental and social impact. Then, following social network
analysis methodologies related to the dynamics of complex systems, it is possible to find out, emergent and
sometimes hidden new habits of electricity usage. Through an initial Critical Mass, involving a multitude of
consumers, each related to more contexts, we evaluate the triggering and spreading of a collective attitude. To
this aim, in this paper, we propose a novel analytical model defining a new concept of critical mass, which
includes centrality measures both in a single layer and in a multilayer social network.
A Firefly Algorithm for Optimizing Spur Gear Parameters Under Non-Lubricated ...irjes
Firefly algorithm is one of the emerging evolutionary approaches for complex and non-linear
optimization problems. It is inspired by natural firefly‟s behavior such as movement of fireflies based on
brightness and by overcoming the constraints such as light absorption, obstacles, distance, etc. In this research,
firefly‟s movement had been simulated computationally to identify the best parameters for spur gear pair by
considering the design and manufacturing constraints. The proposed algorithm was tested with the traditional
design parameters and found the results are at par in less computational time by satisfying the constraints.
The Effect of Orientation of Vortex Generators on Aerodynamic Drag Reduction ...irjes
One of the main reasons for the aerodynamic drag in automotive vehicles is the flow separation
near the vehicle’s rear end. To delay this flow separation, vortex generators are used in recent vehicles. The
vortex generators are commonly used in aircrafts to prevent flow separation. Even though vortex generators
themselves create drag, but they also reduce drag by delaying flow separation at downstream. The overall effect
of vortex generators is more beneficial and proved by experimentation. The effect depends on the shape,size and
orientation of vortex generators. Hence optimized shape with proper orientation is essential for getting better
results.This paper presents the effect of vortex generators at different orientation to the flow field and the
mechanism by which these effects takes place.
An Assessment of The Relationship Between The Availability of Financial Resou...irjes
The availability of financial resources is an important element in impacting the success of a planning
process for an effective physical planning. The extent to which however, they are articulated in the process
remained elusive both in scholarly and public discourse. The objective of this study wastherefore, to examine
the extent to which financial resources affect physical planning. In doing so, the study examinedwhether
financial resources were adequate or not to facilitate planning processes in Paidha. According to the study
findings,budget prioritization and ceilings are still a challenge in Paidha Town Council. This is partly due
limited level of knowledge of physical planning among the officials of Paidha Town Council. As a result, there
were no dedicated budget line for routine inspection of physical development plan compliance and enforcement
tools in Paidha. In conclusion, in addressing uncoordinated patterns of physical development that characterize
Uganda‟s urban centres, a critical starting point ought to be the analysis of physical planning process. The
research of this kind is not only significant to other emerging urban centres facing poor a road network,
mushrooming informal settlements and poor social services including poor pattern of residential and commercial
developments but also to all institutions that are involved in planning these towns. Knowing the extent of need
for financial influences in planning may assist local authorities to take the processes of planning seriously which
will help enhance the sustainable development of emerging urban centres including Paidha.
The Choice of Antenatal Care and Delivery Place in Surabaya (Based on Prefere...irjes
- Person's desire to do a pregnancy examination is determined by the service place that suits the tastes
and facilities owned by it. Until now, the utilization of antenatal care by pregnant women is still low (Mardiana,
2014). The purpose of the study is to analyze factors affecting the utilization of antenatal care and delivery place
in Surabaya city based on the preferences and choice theory.
Type of survey research is cross sectional approach, the population is mothers who have children aged 1-
12 months in Surabaya. The large sample of 250 mothers who have children aged 1-12 months in 2013 is taken
by simple random sampling technique. Variables of the research are the preference elements and steps, choice
elements and steps, utilization of antenatal care and delivery place. Data were collected through questionnaires
and secondary data were then analyzed with descriptive statistics in the form of a frequency distribution, shown
by the schematic diagram.
The result showed that the preference elements and steps showed almost half (42.9%) desire to give birth
in a health care because of information got from someone else, while the choice element and step shows the
bulk (57.1%) of the criteria of delivery place chosen is a safe, comfortable and cheap delivery place, the labor
place which is the main choice most (57.1%) is cheap, comfortable, close.
Conclusion of the research based on the preferences and choice theory can be found three (3) new
theories, they are preferences become choice, preferences do not become choice, choice is preceded by
preferences
Enhancing Performance with Globus and the Science DMZGlobus
ESnet has led the way in helping national facilities—and many other institutions in the research community—configure Science DMZs and troubleshoot network issues to maximize data transfer performance. In this talk we will present a summary of approaches and tips for getting the most out of your network infrastructure using Globus Connect Server.
Removing Uninteresting Bytes in Software FuzzingAftab Hussain
Imagine a world where software fuzzing, the process of mutating bytes in test seeds to uncover hidden and erroneous program behaviors, becomes faster and more effective. A lot depends on the initial seeds, which can significantly dictate the trajectory of a fuzzing campaign, particularly in terms of how long it takes to uncover interesting behaviour in your code. We introduce DIAR, a technique designed to speedup fuzzing campaigns by pinpointing and eliminating those uninteresting bytes in the seeds. Picture this: instead of wasting valuable resources on meaningless mutations in large, bloated seeds, DIAR removes the unnecessary bytes, streamlining the entire process.
In this work, we equipped AFL, a popular fuzzer, with DIAR and examined two critical Linux libraries -- Libxml's xmllint, a tool for parsing xml documents, and Binutil's readelf, an essential debugging and security analysis command-line tool used to display detailed information about ELF (Executable and Linkable Format). Our preliminary results show that AFL+DIAR does not only discover new paths more quickly but also achieves higher coverage overall. This work thus showcases how starting with lean and optimized seeds can lead to faster, more comprehensive fuzzing campaigns -- and DIAR helps you find such seeds.
- These are slides of the talk given at IEEE International Conference on Software Testing Verification and Validation Workshop, ICSTW 2022.
zkStudyClub - Reef: Fast Succinct Non-Interactive Zero-Knowledge Regex ProofsAlex Pruden
This paper presents Reef, a system for generating publicly verifiable succinct non-interactive zero-knowledge proofs that a committed document matches or does not match a regular expression. We describe applications such as proving the strength of passwords, the provenance of email despite redactions, the validity of oblivious DNS queries, and the existence of mutations in DNA. Reef supports the Perl Compatible Regular Expression syntax, including wildcards, alternation, ranges, capture groups, Kleene star, negations, and lookarounds. Reef introduces a new type of automata, Skipping Alternating Finite Automata (SAFA), that skips irrelevant parts of a document when producing proofs without undermining soundness, and instantiates SAFA with a lookup argument. Our experimental evaluation confirms that Reef can generate proofs for documents with 32M characters; the proofs are small and cheap to verify (under a second).
Paper: https://eprint.iacr.org/2023/1886
Encryption in Microsoft 365 - ExpertsLive Netherlands 2024Albert Hoitingh
In this session I delve into the encryption technology used in Microsoft 365 and Microsoft Purview. Including the concepts of Customer Key and Double Key Encryption.
Securing your Kubernetes cluster_ a step-by-step guide to success !KatiaHIMEUR1
Today, after several years of existence, an extremely active community and an ultra-dynamic ecosystem, Kubernetes has established itself as the de facto standard in container orchestration. Thanks to a wide range of managed services, it has never been so easy to set up a ready-to-use Kubernetes cluster.
However, this ease of use means that the subject of security in Kubernetes is often left for later, or even neglected. This exposes companies to significant risks.
In this talk, I'll show you step-by-step how to secure your Kubernetes cluster for greater peace of mind and reliability.
Epistemic Interaction - tuning interfaces to provide information for AI supportAlan Dix
Paper presented at SYNERGY workshop at AVI 2024, Genoa, Italy. 3rd June 2024
https://alandix.com/academic/papers/synergy2024-epistemic/
As machine learning integrates deeper into human-computer interactions, the concept of epistemic interaction emerges, aiming to refine these interactions to enhance system adaptability. This approach encourages minor, intentional adjustments in user behaviour to enrich the data available for system learning. This paper introduces epistemic interaction within the context of human-system communication, illustrating how deliberate interaction design can improve system understanding and adaptation. Through concrete examples, we demonstrate the potential of epistemic interaction to significantly advance human-computer interaction by leveraging intuitive human communication strategies to inform system design and functionality, offering a novel pathway for enriching user-system engagements.
Pushing the limits of ePRTC: 100ns holdover for 100 daysAdtran
At WSTS 2024, Alon Stern explored the topic of parametric holdover and explained how recent research findings can be implemented in real-world PNT networks to achieve 100 nanoseconds of accuracy for up to 100 days.
Why You Should Replace Windows 11 with Nitrux Linux 3.5.0 for enhanced perfor...SOFTTECHHUB
The choice of an operating system plays a pivotal role in shaping our computing experience. For decades, Microsoft's Windows has dominated the market, offering a familiar and widely adopted platform for personal and professional use. However, as technological advancements continue to push the boundaries of innovation, alternative operating systems have emerged, challenging the status quo and offering users a fresh perspective on computing.
One such alternative that has garnered significant attention and acclaim is Nitrux Linux 3.5.0, a sleek, powerful, and user-friendly Linux distribution that promises to redefine the way we interact with our devices. With its focus on performance, security, and customization, Nitrux Linux presents a compelling case for those seeking to break free from the constraints of proprietary software and embrace the freedom and flexibility of open-source computing.
GraphRAG is All You need? LLM & Knowledge GraphGuy Korland
Guy Korland, CEO and Co-founder of FalkorDB, will review two articles on the integration of language models with knowledge graphs.
1. Unifying Large Language Models and Knowledge Graphs: A Roadmap.
https://arxiv.org/abs/2306.08302
2. Microsoft Research's GraphRAG paper and a review paper on various uses of knowledge graphs:
https://www.microsoft.com/en-us/research/blog/graphrag-unlocking-llm-discovery-on-narrative-private-data/
Climate Impact of Software Testing at Nordic Testing DaysKari Kakkonen
My slides at Nordic Testing Days 6.6.2024
Climate impact / sustainability of software testing discussed on the talk. ICT and testing must carry their part of global responsibility to help with the climat warming. We can minimize the carbon footprint but we can also have a carbon handprint, a positive impact on the climate. Quality characteristics can be added with sustainability, and then measured continuously. Test environments can be used less, and in smaller scale and on demand. Test techniques can be used in optimizing or minimizing number of tests. Test automation can be used to speed up testing.
SAP Sapphire 2024 - ASUG301 building better apps with SAP Fiori.pdfPeter Spielvogel
Building better applications for business users with SAP Fiori.
• What is SAP Fiori and why it matters to you
• How a better user experience drives measurable business benefits
• How to get started with SAP Fiori today
• How SAP Fiori elements accelerates application development
• How SAP Build Code includes SAP Fiori tools and other generative artificial intelligence capabilities
• How SAP Fiori paves the way for using AI in SAP apps
“Cadastral Maps for Socio-Economic Data Visualization and Integration for Land Use in Raniganj Mining Areas”
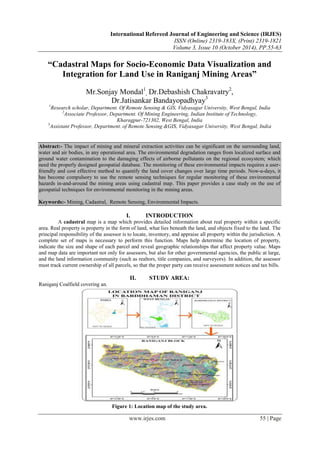
1. International Refereed Journal of Engineering and Science (IRJES)
ISSN (Online) 2319-183X, (Print) 2319-1821
Volume 3, Issue 10 (October 2014), PP.55-63
www.irjes.com 55 | Page
“Cadastral Maps for Socio-Economic Data Visualization and
Integration for Land Use in Raniganj Mining Areas”
Mr.Sonjay Mondal1
, Dr.Debashish Chakravatry2
,
Dr.Jatisankar Bandayopadhyay3
1
Research scholar, Department. Of Remote Sensing & GIS, Vidyasagar University, West Bengal, India
2
Associate Professor, Department. Of Mining Engineering, Indian Institute of Technology,
Kharagpur-721302, West Bengal, India
3
Assistant Professor, Department. of Remote Sensing &GIS, Vidyasagar University, West Bengal, India
Abstract:- The impact of mining and mineral extraction activities can be significant on the surrounding land,
water and air bodies, in any operational area. The environmental degradation ranges from localized surface and
ground water contamination to the damaging effects of airborne pollutants on the regional ecosystem; which
need the properly designed geospatial database. The monitoring of these environmental impacts requires a user-
friendly and cost effective method to quantify the land cover changes over large time periods. Now-a-days, it
has become compulsory to use the remote sensing techniques for regular monitoring of these environmental
hazards in-and-around the mining areas using cadastral map. This paper provides a case study on the use of
geospatial techniques for environmental monitoring in the mining areas.
Keywords:- Mining, Cadastral, Remote Sensing, Environmental Impacts.
I. INTRODUCTION
A cadastral map is a map which provides detailed information about real property within a specific
area. Real property is property in the form of land, what lies beneath the land, and objects fixed to the land. The
principal responsibility of the assessor is to locate, inventory, and appraise all property within the jurisdiction. A
complete set of maps is necessary to perform this function. Maps help determine the location of property,
indicate the size and shape of each parcel and reveal geographic relationships that affect property value. Maps
and map data are important not only for assessors, but also for other governmental agencies, the public at large,
and the land information community (such as realtors, title companies, and surveyors). In addition, the assessor
must track current ownership of all parcels, so that the proper party can receive assessment notices and tax bills.
II. STUDY AREA:
Raniganj Coalfield covering an.
Figure 1: Location map of the study area.
2. “Cadastral Maps For Socio-Economic Data Visualization And Integration For Land Use In Raniganj…
www.irjes.com 56 | Page
area of about 1652 sq. km. and bounded by Latitude 23o
30’& 23o
40’N, Longitude 87o
00’& 87o
10’E is located
in the eastern part of India. It is covered under Survey of India toposheet no. 73M/2 on RF 1:250,000. This
coalfield holds a premier position in India for having the largest share of reserve of superior grade non-coking
coal and considered as the birthplace of coal mining in the country.
III. AIM & OBJECTIVES OF MY STUDY
To categories the study area into environmental zones with mining using cadastral techniques.
To determine the present land used/land cover
To determine Socio Economic status
Environmental Management of Mineral Resources.
IV. PHYSIOGRAPHIC SETTING
The district Barddhaman is the second largest district of West Bengal having an area of 7,024 sq. Km.
it is located between the fertile and of Hugli flood plain in east, and lateritic uplands of west – the land that is
locally known as Rarh Bhumi. It extends from 220
56’ to 230
53’ north latitude and 860
48’ to 880
25’ east
longitude. The district is bounded on the north by Santal Parganas of Jharkhand, Birbhum and Murshidabad on
the east by Nadia; on the south by Hooghly, Bankura and Purulia and on the west by Dhanbad of Jharkhand
Purulia. Rivers Ajay and Damodar separate the district form Birbhum on the north and form Bankura on the
south & west, respectively. The River Bhagirathi traverse through the eastern edge of the district thus
separating Nadia on the east.(ref. District Environmental Atlas, 2005)
Continuous use of land over a long period of time out taking appropriate measures to conserve and
manage it. But very little work has been done previously on the pre history of this area, and fieldwork reported
here ,carried out in part fulfillment of my doctoral work, here the initial aim of locating stone age sites through
intensive exploration and then making a detailed study of their associated environment and land use pattern.
V. METHODOLOGY
Figure2: Flowchart showing methodology.
Selection of the study area and get to the all the primary details. Digitized the mining boundaries by
the geo rectified top sheets and superimpose the Environment planning. The buffering zone is prepared in the
Arc GIS software. Prepared the area of interest (AOI) from the satellite images
The Division zone form the satellite images are to be classified by the ERDAS SOFTWARE using. By
the field verification /ground tooth prepared map with scientific. Final attribute are prepared for a land use and
verified the classes by the field verification, spatial and spectral matching also.
3. “Cadastral Maps For Socio-Economic Data Visualization And Integration For Land Use In Raniganj…
www.irjes.com 57 | Page
VI. DATA USED
Remote
Sensing Data
Landsat ETM+
Satellite
image
LISS-IV from NRSC
Co-lateral
Data
Toposheet
Regional maps
1. Primary date collected from the mining Agency(Mine Planning, local /regional maps)
2. Toposheet have collected from the Geological survey of India in 1:50,000 scale.
3. Regional maps (Geology, Geo morphological and previous land use maps).
4. Cadastral sheets from survey building, Kolkata
5. Satellite image collected glcf site.
a. Land sat ETM+
Satellite image (date, 26-10-2001).
b. Google image.
VII. CADASTRAL CONCEPTS
The word "cadastre" came into English through French from Late Latin “capitastrum”, a register of the
poll tax, and the from the Greek “katastikhon”, meaning, a list or register.
Cadastre is a scientific term for a set of records showing the extent, value and ownership of land.
Particularly, a cadastre is a record of areas and values of land and of landholders that initially was accumulated
for purposes of taxation. The cadastre serves two other equally significant purposes. It offers a ready means of
accurate description and recognition of specific pieces of land and it performs as a continuous record of rights in
land. A cadastral map is a map which provides detailed information about real property within a specific area.
Real property is property in the form of land, what lies beneath the land, and objects fixed to the land.
Figure 3: cadastral sheet of the study area
Geo-referencing of cadastral sheet:
To geo-reference something means to define its existence in physical space. That is establishing its
location in terms of map projections or coordinate systems. The term is use both when establishing the relation
between raster and vector images and coordinates but also when determining the spatial location of other
geographical features. Examples would include establishing the correct position of an aerial photograph within
a map or finding the geographical coordinates of a place name or street address. This procedure is thus
imperative to data modelling in the field of geographic information system and other cartographic methods.
When data from different sources need to be combined and then used in a GIS application, becomes essential to
have a common referencing system. This is brought about by using various geo referencing techniques. Most
geo refereeing tasks are under taken either because the user wants to produce a new map or because they wants
to link two or more different datasets together by virtue of the fact that they relate to the some geographic
locations.
4. “Cadastral Maps For Socio-Economic Data Visualization And Integration For Land Use In Raniganj…
www.irjes.com 58 | Page
VIII. THE ROLE OF LAND-USE
Human systems depend critically on the state of the environment. Managing a sustainable evolution of
land-use systems at the regional scale concerns various themes of vital importance:
Land-use/cover changes affect the hydrological cycle both qualitatively and quantitatively by influencing
how precipitation is intercepted, evapotranspired, and retained in soils, which in turn determines the
amount and speed of runoff. Land-cover change also influences local soil erosion and nutrient losses. At
the scale of river basins, it determines water availability and the intensity and frequency of flooding;
Ecosystems and land in general store waste materials and provide critically important purification
functions. The ability to provide these services is threatened by pollution and land degradation due to
inappropriate land use, or over-exploitation that transgresses capacity thresholds. (options summer, 1999)
So SCIENTIFIC INVESTIGATION is the important part of my research work, I highly indicate the
investigation of mining area with respect to satellite images and demark the effected of surrounding area
and finally there sustainable environmental management.
Figure 4: Map showing for parcel wise land used/land cover map & plot No. and
Spatial adjustment in satellite images
XI. IMPACTS ON LAND USE
There might be a considerable impact on the land in my study area but the mining activities as there
are a lot of mines in and around this area. However, the economic needs of the local people who are
economically backward are being met to a large extent. Considering the existing Agro-climatic conditions, in
future there may be very little possibility for any change in the present land use pattern.
Figure 5: land used /landcover map of the study area
5. “Cadastral Maps For Socio-Economic Data Visualization And Integration For Land Use In Raniganj…
www.irjes.com 59 | Page
Remote sensing data with its various spectral and spatial resolutions, offers comprehensive and
accurate information for mapping and monitoring of land use/cover over a period of time. By analyzing the data
of different cut-off dates, impact of coal mining on land use and vegetation cover can be determined.
Land use/ cover map was prepared on the basis of image interpretation carried out based on the
satellite data for the year2009- 2010. Following land use/cover classes are identified in the Raniganj coalfield
region.
Figure 6: Pie graph showing area of land used /land cover classes
The figure used above is a replica Raniganj in Barddhaman district which represents a land used/ land
cover mapping. There are eight classification in the figure, namely Agricultural Land-Crop Land, Built-Up
Mining/ Industrial area, Settlement, Tree Clad Area, Transportation, Westland-Scrub land Open, Water bodies-
Lakes/Ponds, and Water bodies- River/Stream.
In that region agricultural land crop area holds maximum 50.33 % which other like Built-Up Mining/
Industrial area 7.14 %, Settlement 7.8 %, Tree Clad Area 3.13 %, Transportation 0.53 %, Westland-Scrub land
Open 0.9 % , but making water bodies 3.23 % and River/stream minimum area covered 0.53 % recorded finally
I have used a Bar graph to represent the classification in a diagram.
Figure 7: Transportation map of the study area
Feature class Area(sq.km)
Agricultural Land-Crop
Land
50.33
Built-Up Mining/ Industrial
area
7.14
settlement 7.8
Tree Clad Area 3.13
Transportation 0.53
Westland-Scrub land Open 0.9
Water bodies- Lakes/Ponds 3.23
Water bodies-
River/Stream
0.53
6. “Cadastral Maps For Socio-Economic Data Visualization And Integration For Land Use In Raniganj…
www.irjes.com 60 | Page
X. TRANSPORT NETWORK
Here I prepare a transport map. Here mainly found the road transport. To create this map I used the
LISS -iv imagery. There showing the connectivity of every each settlement. In this map just found a National
High Way (NH2) and beside these found some district road which are also metalled road. There is some village
road, this is unmetalled road or kuchha road and some extent of cart track and footpath road found.here a good
transportation or road network is created . network is growing to develop these Raniganj area .
The major corridor of the district is a part of the Grand Trunk Road (NH-2), which runs along the
entire length of the district from east of west. The total length is 157 km. another important road is Durgapur
Express way. The total length is 64.59km, out of which a length of 19 km falls within the district of
Barddhaman. But if we see that in Raniganj, there transportation system is better than in district condition. In
small places there Eastern Railway connective from Durgapur to Asansol and other hand NH2 road is there
Figure 8: population density map (2001) of the study area
Figure 9: Literate and illiterate map of the study area
7. “Cadastral Maps For Socio-Economic Data Visualization And Integration For Land Use In Raniganj…
www.irjes.com 61 | Page
Figure10 : Population density map (2011) of the study area
XI. IMPACTS DUE TO TRANSPORTATION OF THE MINERAL
Impact on existing environment & Local infrastructure
Major impact is Dust Generation
Increase in Gaseous Pollutants like SO2, NOx Noise Pollution Control measures
Installation of Dust Suppression System & Regular Water Sprinkling on haul roads
Proper maintenance of Transportation vehicles
Checking up for overloading of Transportation vehicle.
Regular Air Quality Monitoring to check increment of pollutants.
Open cast mechanized method of mining is being adopted with the benching pattern of 6m height x 6m width. It
involves deployment of machines like Wagon drill, excavator and development also followed by drilling,
blasting, excavation, transportation, communication, sorting, sizing blending and dispatch.
XII. EXISTING MANPOWER
The mine is working with adequate number of management and technical personnel with the
anticipated production of next five years. There is scope of further increase in the management and supervising
manpower along with the miners and the hazri workers. IncludingManagerial, Skilled, Unskilled Personnel &
laborers.
XIII. LAND DEGRADATION
Open cast mining causes various types environmental pollution. It is predicted that the process of
mining have little impact on the existing ecological conditions of the project area. The increase in production in
mine and other allied activities in the area shall have additional impact on abiotic and biotic environment of the
area (although not significant) various environmental safe guards have been proposed to implement in the form
of my study area report.
XIV. ENVIRONMENTAL CONCERNS
Open cast mining causes various types environmental pollution. It is predicted that the process of
mining have little impact on the existing ecological conditions of the my study area .The increase in production
in mine and other allied activities in the area shall have additional impact on abiotic and biotic environment of
the area (although not significant) Various environmental safe guards have been proposed to implement in the
form of my study area report.
8. “Cadastral Maps For Socio-Economic Data Visualization And Integration For Land Use In Raniganj…
www.irjes.com 62 | Page
XV. DESCRIPTION OF THE ENVIRONMENT
Meteorological data have been collected at the pre-defined station located in the study area.
Meteorological data such as Rainfall, Temperature, Humidity, Wind speed & Wind Direction have been
generated as the primary data. Secondary data on meteorology have also been collected from the nearest station
i.e. Keonjhar.
XVI. ENVIRONMENT MANAGEMENT PLAN
Measures for controlling air pollution
Regular water spraying on haul roads. The volume of dust rising from waste dump areas & ore, roads,
etc. by action of wind shall be checked by planting grasses and broad leaf trees. Ensuring transporting vehicles
not to cross stipulated speed. Exhaust fumes in the internal combustion engines used in excavators, dumpers,
dozers and other machinery shall be minimized by ensuring vigorous maintenance and stringent overhaul
schedules.
Measures for controlling water pollution
Proper drainage system shall be done within the study site. There will be no effluent discharge from
the project site, so the chance of water pollution is negligible. Appropriate measures shall be taken to ensure
that the surface water quality in the project area is within permissible limits. Before water is supplied for
consumption particularly for drinking purpose it has to be ensured that the water is free from any pathogens.
Occupational safety and health
To avoid any adverse effect on the health of workers due to dust, noise and vibration etc. extensive
measures has to be adapted related to safety aspect. Regular maintenance and testing of all equipments&
machineries as per manufacturer’s guidelines. Periodical medical examination of all workers by medical
specialists shall be conducted.
Socio economic measures
The work, does not involve any displacement of human habitation, hence no habilitation package is
needed for displacement. The activity envisages the deployment of local laborers. So, it is likely that the general
economic condition of the local people will improve. The peripheral development package will also improve
their health and sanitation. Health and education facilities created in the project shall be extended to villagers
also. Roads development in the project shall be utilized by the villagers. Providing employment to local people
will be the major factors for upliftment of the society.
9. “Cadastral Maps For Socio-Economic Data Visualization And Integration For Land Use In Raniganj…
www.irjes.com 63 | Page
Figure 11: Photographs collected from different places in the study area.
XVII. RESULTS AND DISCUSSIONS
A rapidly changing economic profile in mineral sector is putting a two-way pressure on environmental
and social changes on the ground. This is leading a two way pressure on environmental institution. On one hand
there is a growing public awareness demand for better environment management, while the level of non
compliance of polluted industries is increasing. Rapid growth in industrial & mineral sector is increasing
workload for the environmental regulators to process the application, proper monitoring & enforcing
compliance and to respond to large number of public complaints. The ability of state institutions to manage the
environmental & social impacts of mining is also lacking.
The study area showing that total coverage of the land like vegetation, forest, mining activity zone and
drainage cover area .but deeply see the total area is mining activity .that for the results is show the forest and
vegetation land is going to decrease from previous production or planting and also the increased mining
activity. Other part of the way is shown that pollution is so much speeded that surrounding area is cover by dust
.So the environment is highly polluted and not suitable for habitation. Malaria and other vector borne disease
are spreading in that area
XVIII. CONCLUSION
The present study will be very useful in assessment of some change in land use pattern due to mining
activity. The change in agriculture and forest land due to this activity will further help in actually finding out the
adverse effect on vegetation of the area. This result of study will certainly be helpful in designing the mining or
land use management plan and conservation of the study area which is a vital step in ecological planning .The
proposed infrastructures facility shall be of use to people of the area. The roads, transportation facilities and rest
sheds can be utilized by the community of the area. The revenue of the State Govt. shall be definitely increasing
due to the enhanced production. The study area is surrounded by industries from all sides.
REFERENCE
[1]. Land Use / Vegetation Cover Mapping of Raniganj Coalfield based on Satellite Data for the Year
2011;Central Mine Planning & Design Institute Ltd,
[2]. Oosterom. V.P., Lemmen. C., Ingvarsson.T., Molen.d.v.P., Ploeger.H., Quak.W., Stoter.J.,
Zevenbergen.J., The core cadastral domain model, 2005
[3]. Coşkun A.C., 2003. Forming the Digital Cadastral Maps from Current Cadastral Data: The Importance
of the Geodetic Control Points
[4]. Parida.K.P., Sanabada K.M., Mohanty3and.N.D.,Mohapatra,K.A., Cadastral Resurvey using RS, GIS,
DGPS & ETS in Bijepadmanabhapursasana of Digapahandi Tahasil, Ganjam District,
[5]. Standard on Manual Cadastral Maps and Parcel Identifiers.,2004
[6]. Standard on Manual Cadastral Maps and Parcel Identifiers pdf)
[7]. Bahaire, T. & Elliott-White, M. (1999). The application of geographical information systems (GIS) in
sustainable Tourism, 7, 159-174.
[8]. Barddhaman District Gazetter.
[9]. District Statistical Handbook
[10]. R. Kumar, P. Anandan, M lrani, J Bergen and Hanna, “Representation of scenes from collection of
images”
[11]. K. Rangarajan, M. Shah and D. Van Brackle, “Optimal corner detection” CVGIP vol: 48 pp: 230-
245,1989.
[12]. A. A. Shyam., “CADASTRAL INFORMATION SYSTEM USING RS & GIS” 2012.