This document summarizes a research paper that evaluates rangeland suitability for livestock production in Dire District, Ethiopia using remote sensing and GIS techniques. Specifically, the study:
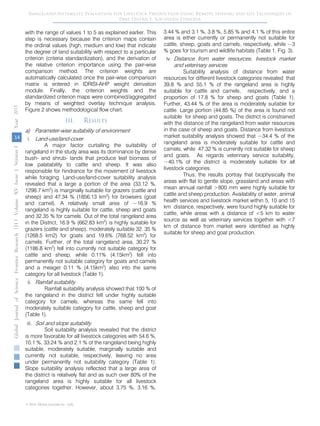
1) Analyzed environmental factors like land use/cover, soil, slope, and rainfall as well as socioeconomic factors including access to water, veterinary services, and markets.
2) Classified the study area into suitability classes (high, moderate, marginal, not suitable) for cattle, sheep, goats, and camels using these factors in a GIS multi-criteria analysis.
3) Found that 5.6-10.1% of land was highly suitable for different livestock, 44.7
The present study focuses on the nature and pattern of urban expansion of Madurai city over its surrounding region during the period from 2003 to 2008. Based on its proximity to the Madurai city, Preparation of various thematic data such Land use and Land cover using Land sat data. Create a land use land cover map from satellite imagery using supervised classification. Find out the areas from the classified data. The study is based on secondary data, the satellite imagery has downloaded from GLCF (Global Land Cover Facility) web site, for the study area (path101 row 67), the downloaded imagery subset using Imagery software to clip the study area. The clipped satellite imagery has used to prepare the land use and land cover map using supervised classification.
Applications of remote sensing and geographic information systems technologie...ILRI
Presentation by Olatoye T. A. (FRIN, Nigeria) and Odularu G. O. (FARA, Ghana) for the Agrifood chain toolkit conference: Livestock and fish value chains in East Africa, Kampala, 9-11 September 2013.
Land Use Land Cover Change Detection of Gulbarga City Using Remote Sensing an...ijsrd.com
Land use and land cover(LULC) recently these days became a major component to handle natural resources and managing changes occurring in the environment.which is due to expansion of the urban area it has lead to critical losses of agriculture land,vegetation land and water bodies.followed by this the urban sprawl created a environmental issues. For example :decreased air quality and increase in the temperature etc. Land use and land cover change is driven by human actions and also drives changes that limit availability of products and services for human and animals, and it can undermine ecological wellbeing also. Land use and land cover is an important component in understanding various interactions of the human activities with the environment and thus it is necessary to be able to simulate changes. Therefore, this study was aimed at understanding land use and land cover change in Gulbarga city. In this work we took Gulbarga city to study the urban expansion and LULC change that took place in 2001 and 2012 to know the changes happened in the year 2012 by comparing with data of 2001.remote sensing methodology is used in this study which provides major coverage mapping & classification of land cover features such as vegetation,soil,water,forest etc. A wide range of environmental parameters can be measured including the land use, vegetation types, surface temperatures , soil types, precipitation, phytoplankton, turbidity, surface elevation and geology.satellite images of two different years i.e 2001 and 2012 are taken in to consideration.after image processing classification is done so as to classify images in to various different land use categories.
LAND USE /LAND COVER CLASSIFICATION AND CHANGE DETECTION USING GEOGRAPHICAL I...IAEME Publication
Land use and land cover change has become a central component in current strategies for managing natural resources and monitoring environmental changes. Geographical information system and image processing techniques used for the analysis of land use/land cover and change detection of Sukhana Basin of Aurangabad District, Maharashtra state. The tools used ArcGIS10.1 and ERDAS IMAGINE9.1, landsat images of 1996, 2003and 2014. From land use / land cover change detection it is found that during 1996-2014, water bodies cover have loss of 4 Sq. Km. Barren land have 146 Sq.Km. loss and forest area with 96 Sq.Km. loss. It is found that urbanization area has gain of 51 Sq.Km. and agricultural land cover also have gain of 195 Sq.Km.
GIS Applications for Smart Agriculture-Case Studies & Research Prospects.AdityaAllamraju1
My special webinar talk about 'GIS Applications for Smart Agriculture-Case Studies & Research Prospects’ is a part of the webinar series on October 31st, 2020 organized by the TGISlab, a GIS Consultancy that is an initiative to fill the gap in GIS/Remote Sensing field to aware people about space technology for Earth Science & its applications. TGISLab works on different GIS Applications work and offers training/webinars/workshops to a wider community. It is based at Ahmedabad in Gujarat, India.
Remote sensing is the acquiring of information from a distance and also the art and science of making measurements of the earth using airborne- or satellite-based sensors, is used in GIS. GIS is a collection of computer-based tools for organizing information from a variety of data sources to map and examine changes on Earth. Global Positioning System or GPS is a space-based radio navigation system that helps pinpoint a three-dimensional position to about a meter of accuracy (for example latitude, longitude and altitude) and provide nano-second precise time anywhere on Earth.
Remote sensing based water management from the watershed to the field levelCIMMYT
Remote sensing –Beyond images
Mexico 14-15 December 2013
The workshop was organized by CIMMYT Global Conservation Agriculture Program (GCAP) and funded by the Bill & Melinda Gates Foundation (BMGF), the Mexican Secretariat of Agriculture, Livestock, Rural Development, Fisheries and Food (SAGARPA), the International Maize and Wheat Improvement Center (CIMMYT), CGIAR Research Program on Maize, the Cereal System Initiative for South Asia (CSISA) and the Sustainable Modernization of the Traditional Agriculture (MasAgro)
Land Use and Land Cover change monitoring of Surajpur Wetland, Uttar Pradesh:...Arnab Saha
Abstract:
Wetlands are extremely important areas throughout the world for wildlife protection, recreation, sediment control and flood prevention. Wetlands are important bird’s habitats and birds use them for feeding, roosting, nesting and rearing their young. In Surajpur Wetland are mainly used for agriculture, fisheries, reclamation for harboring and irrigation purposes. In this paper an attempt is made to study the changes in land use and land cover in Surajpur wetland area over 11 years’ period (2003-2014). LULC is an important component in understanding the interactions of the human activities with the environment and thus it is necessary to be able to simulate changes. The land cover mapping of study area was attempted using remotely sensed images of Landsat and Google Earth imagery. The study area was classified into five categories on the basis of field study, geographical conditions, and remote sensing data. LULC changes have been detected by image processing method in EDRAS imagine 2014 and ArcGIS 10.3. The eleven years’ time period of 2003-2014 shows the major type of land use change. Vegetation area that occupied about around 60 per cent of the Surajpur wetland area in 2003 has decreased to 34.25 percent in 2014. Wetland is increased 8.17 percent and Urban area, Fallow land and Water body also have experienced change. Finally, through the work it is recommended that the wetlands need detail mapping through the use of advance remote sensing techniques like microwave and LIDAR for restoration and management of wetland.
Keywords: LULC, ArcGIS, Surajpur, ERDAS, Remote Sensing
43 % of Earth’s terrestrial vegetated surface is degraded with limited capacity to supply benefits to humans.
Degraded landscapes often result in lower Soil Organic Carbon and overall poor soil health.
Understanding drivers of Land Degradation and processes of Soil Organic Carbon loss are key for informing effective interventions .
Participatory rural appraisals (PRA) were conducted in July 14 to 30, 2016 in AGP-II project target districts: Erar waldiya and Dire Teyara in Harari region of Ethiopia. PRA exercises were conducted using various PRA tools which included review of secondary data, focus group discussions, field observations (Transact walk) and pair-wise ranking. The tools were used to identify the biophysical and socio-economic constraints, opportunities and developments within the kebeles. Agricultural and animal productions are common in the surveyed Kebeles of the AGP-II target districts. Mixed farming is widely practiced in the kebeles of both districts. Staple food crops like maize and sorghum, and cash crops like vegetables and khat (Catha edulis Forsk) are commonly produced across all targets of AGP-II districts and also as region as well. Growing maize and sorghum in khat alleys is another cropping system practiced in both districts. The PRA work has also identified various categories of constraints to increasing crop production in the areas. The major bottlenecks include lack of improved crop varieties, low soil fertility, deforestation, moisture stress, disease and insect pests, and lack of awareness on soil fertility crop management. In most of the PRA Kebeles, it was found that continuous cropping, complete removal of crop residues from farm lands, soil erosion, deforestation, absence of fallowing, and inadequate soil fertility management practices are the major causes for low soil fertility and crop yields. In most cases, farmers apply Di-ammonium phosphate (DAP), urea and farmyard manure to improve soil fertility and crop yield. However, very few farmers use integrated application of chemical fertilizers and farmyard manure for crop production. In addition, no scientifically formulated and recommended fertilizer rates are available for the specific soils and environments. Thus, due to the lack of scientifically recommended rates of fertilizers and high costs of mineral fertilizers, farmers often use smaller rates of mineral N and P fertilizers based on haphazard estimations.
Spectroscopy - A new paradigm for Evidence-based Land &Soil Management recomm...Stankovic G
AfriLAB: Regional Soil Laboratory Network for Africa | First meeting. 21 - 24 May 2019 | Nairobi, Kenya
Ermias Betemariam, Erick Towett & Andrew Sila World Agroforestry (ICRAF), Kenya
Land suitability and availability for biofuel feedstock production in sub-Sah...SIANI
Presented as part of the seminar: South at the Steering Wheel - Improving sustainability in land investment for bioenergy in sub-Saharan Africa
29th May 2012, 08:00 - 17:30
Naturvårdsverket (Swedish EPA), Stockholm, Sweden
Speaker: Dr. Helen Watson, University of Kwazulu Natal (South Africa)
Helen Watson discusses assessing land suitability as often based on finding suitable land for a
specific feedstock. Her concerns include:
The limitations of the Integrated Biodiversity Assessment Tool (IBAT)(Dragisic et al., 2010) for African conditions
The lack of consideration of good management practices in agro-environmental zoning methodology, and the proposed exclusion of slopes steeper than 20% from being zoned as suitable, although such slopes are routinely used in commercial production
The lack of long term, spatially extensive data on the wide range of climatic parameters needed to predict yield performances in particular (1 km2) parcels.
The need for research on what changes in animal migration patterns could follow from climate change, and ensuring that any new fencing for bioenergy projects would not infer with such changes.
The inclusion of archaeologically and historically/culturally significant areas and sites into GIS. Literature on such sites often lacks GPS co-ordinates.
Methods & processes of active stakeholder engagement in successful land use for bioenergy
Mapping of Planning Land Use Based GIS in Sub-District Kintamani, BaliIJEAB
Research land use plans implemented in Kintamani Sub-district, Bangli Regency, Provence of Bali. The Soil samples were collected by overlaying maps of soil types, land use maps, maps of slope, so we get a map of the land unit with 48 sample points. . The scoring method used to analyze slope, soil type and rainfall. The results of the analysis are used to plan the direction of land use in the Kintamani district. Land use is as a buffer zone and protected areas, land outside the forest area. The existing condition of the land is owned by farmers, the use of land in the buffer zone, with intercropping and organic matter or mulching, while in protected areas which are land use under the conditions then existing rules soil and water conservation.
An exploratory study on farmer’s vernacular knowledge about the land characte...Agriculture Journal IJOEAR
Local people and small scale farmer had a broad understanding of their land characteristics and soil quality to choose crop. Though Maximum farmers in our country are illiterate and little educated; they have no enough scientific knowledge about land type, soil quality and crop suitability. But they possess vast indigenous knowledge by living in a same environment for a long period of time. They have developed some strategies that helped them to attain a higher degree of satisfaction in farming. So therefore it is very important to explore the farmer's vernacular knowledge about the land type, soil quality and crop suitability. To address this indigenous knowledge this study investigates the farmer's vernacular knowledge about the land type, soil quality and crop suitability in Lower Ganga Flood Plain in Bangladesh. The information was collected from one Mouza in Nagarkanda upazila, Faridpur district Lower Ganga Flood Plain in Bangladesh. Qualitative and quantitative both data were used in this study. The data were collected from primary sources (such as questionnaire survey, FGD) and secondary data sources (such as books, journals, and published and unpublished research reports). Data were analyzed by exploratory statistics. Graphs and graph tables were created by MS excel. By analyzing the Field data it was investigated that farmers of the study area recognized four elevation levels of land; i). High Land (Vitta) ii). Medium Land (Taner Jomi) iii). Low Land (Nall/Dhop) iv).Very Low (Beel) based on its elevation, flood depth, land use, and crop suitability. The farmers of the study area possess considerable knowledge of the soils quality, moisture conditions of that area. The farmers of the study area distinguish soil into three categories primarily on the basis of color, texture, organic matter content, drainage, and fertility of soils. They use indigenous methods such as visual observation while color, tasting by tongue, feeling, vegetation cover and rubbing with fingers to determine various soil properties. Thus Farmers' knowledge of soils is, therefore, a vast resource we summarized in this paper.
Water, land and soil management strategies to intensify cereal-legume farming...africa-rising
Poster prepared by Fred Kizito, Davie Kadyampakeni, Asamoah Larbi, Eliasu Salifu and Abdul Rahman Nurudeen for the AfrIca RISING West Africa Review and Planning Meeting, Accra, 30 March–1 April 2016
Instructions for Submissions thorugh G- Classroom.pptxJheel Barad
This presentation provides a briefing on how to upload submissions and documents in Google Classroom. It was prepared as part of an orientation for new Sainik School in-service teacher trainees. As a training officer, my goal is to ensure that you are comfortable and proficient with this essential tool for managing assignments and fostering student engagement.
2024.06.01 Introducing a competency framework for languag learning materials ...Sandy Millin
http://sandymillin.wordpress.com/iateflwebinar2024
Published classroom materials form the basis of syllabuses, drive teacher professional development, and have a potentially huge influence on learners, teachers and education systems. All teachers also create their own materials, whether a few sentences on a blackboard, a highly-structured fully-realised online course, or anything in between. Despite this, the knowledge and skills needed to create effective language learning materials are rarely part of teacher training, and are mostly learnt by trial and error.
Knowledge and skills frameworks, generally called competency frameworks, for ELT teachers, trainers and managers have existed for a few years now. However, until I created one for my MA dissertation, there wasn’t one drawing together what we need to know and do to be able to effectively produce language learning materials.
This webinar will introduce you to my framework, highlighting the key competencies I identified from my research. It will also show how anybody involved in language teaching (any language, not just English!), teacher training, managing schools or developing language learning materials can benefit from using the framework.
We all have good and bad thoughts from time to time and situation to situation. We are bombarded daily with spiraling thoughts(both negative and positive) creating all-consuming feel , making us difficult to manage with associated suffering. Good thoughts are like our Mob Signal (Positive thought) amidst noise(negative thought) in the atmosphere. Negative thoughts like noise outweigh positive thoughts. These thoughts often create unwanted confusion, trouble, stress and frustration in our mind as well as chaos in our physical world. Negative thoughts are also known as “distorted thinking”.
The Indian economy is classified into different sectors to simplify the analysis and understanding of economic activities. For Class 10, it's essential to grasp the sectors of the Indian economy, understand their characteristics, and recognize their importance. This guide will provide detailed notes on the Sectors of the Indian Economy Class 10, using specific long-tail keywords to enhance comprehension.
For more information, visit-www.vavaclasses.com
The Roman Empire A Historical Colossus.pdfkaushalkr1407
The Roman Empire, a vast and enduring power, stands as one of history's most remarkable civilizations, leaving an indelible imprint on the world. It emerged from the Roman Republic, transitioning into an imperial powerhouse under the leadership of Augustus Caesar in 27 BCE. This transformation marked the beginning of an era defined by unprecedented territorial expansion, architectural marvels, and profound cultural influence.
The empire's roots lie in the city of Rome, founded, according to legend, by Romulus in 753 BCE. Over centuries, Rome evolved from a small settlement to a formidable republic, characterized by a complex political system with elected officials and checks on power. However, internal strife, class conflicts, and military ambitions paved the way for the end of the Republic. Julius Caesar’s dictatorship and subsequent assassination in 44 BCE created a power vacuum, leading to a civil war. Octavian, later Augustus, emerged victorious, heralding the Roman Empire’s birth.
Under Augustus, the empire experienced the Pax Romana, a 200-year period of relative peace and stability. Augustus reformed the military, established efficient administrative systems, and initiated grand construction projects. The empire's borders expanded, encompassing territories from Britain to Egypt and from Spain to the Euphrates. Roman legions, renowned for their discipline and engineering prowess, secured and maintained these vast territories, building roads, fortifications, and cities that facilitated control and integration.
The Roman Empire’s society was hierarchical, with a rigid class system. At the top were the patricians, wealthy elites who held significant political power. Below them were the plebeians, free citizens with limited political influence, and the vast numbers of slaves who formed the backbone of the economy. The family unit was central, governed by the paterfamilias, the male head who held absolute authority.
Culturally, the Romans were eclectic, absorbing and adapting elements from the civilizations they encountered, particularly the Greeks. Roman art, literature, and philosophy reflected this synthesis, creating a rich cultural tapestry. Latin, the Roman language, became the lingua franca of the Western world, influencing numerous modern languages.
Roman architecture and engineering achievements were monumental. They perfected the arch, vault, and dome, constructing enduring structures like the Colosseum, Pantheon, and aqueducts. These engineering marvels not only showcased Roman ingenuity but also served practical purposes, from public entertainment to water supply.
The Art Pastor's Guide to Sabbath | Steve ThomasonSteve Thomason
What is the purpose of the Sabbath Law in the Torah. It is interesting to compare how the context of the law shifts from Exodus to Deuteronomy. Who gets to rest, and why?
How to Create Map Views in the Odoo 17 ERPCeline George
The map views are useful for providing a geographical representation of data. They allow users to visualize and analyze the data in a more intuitive manner.