Download to read offline
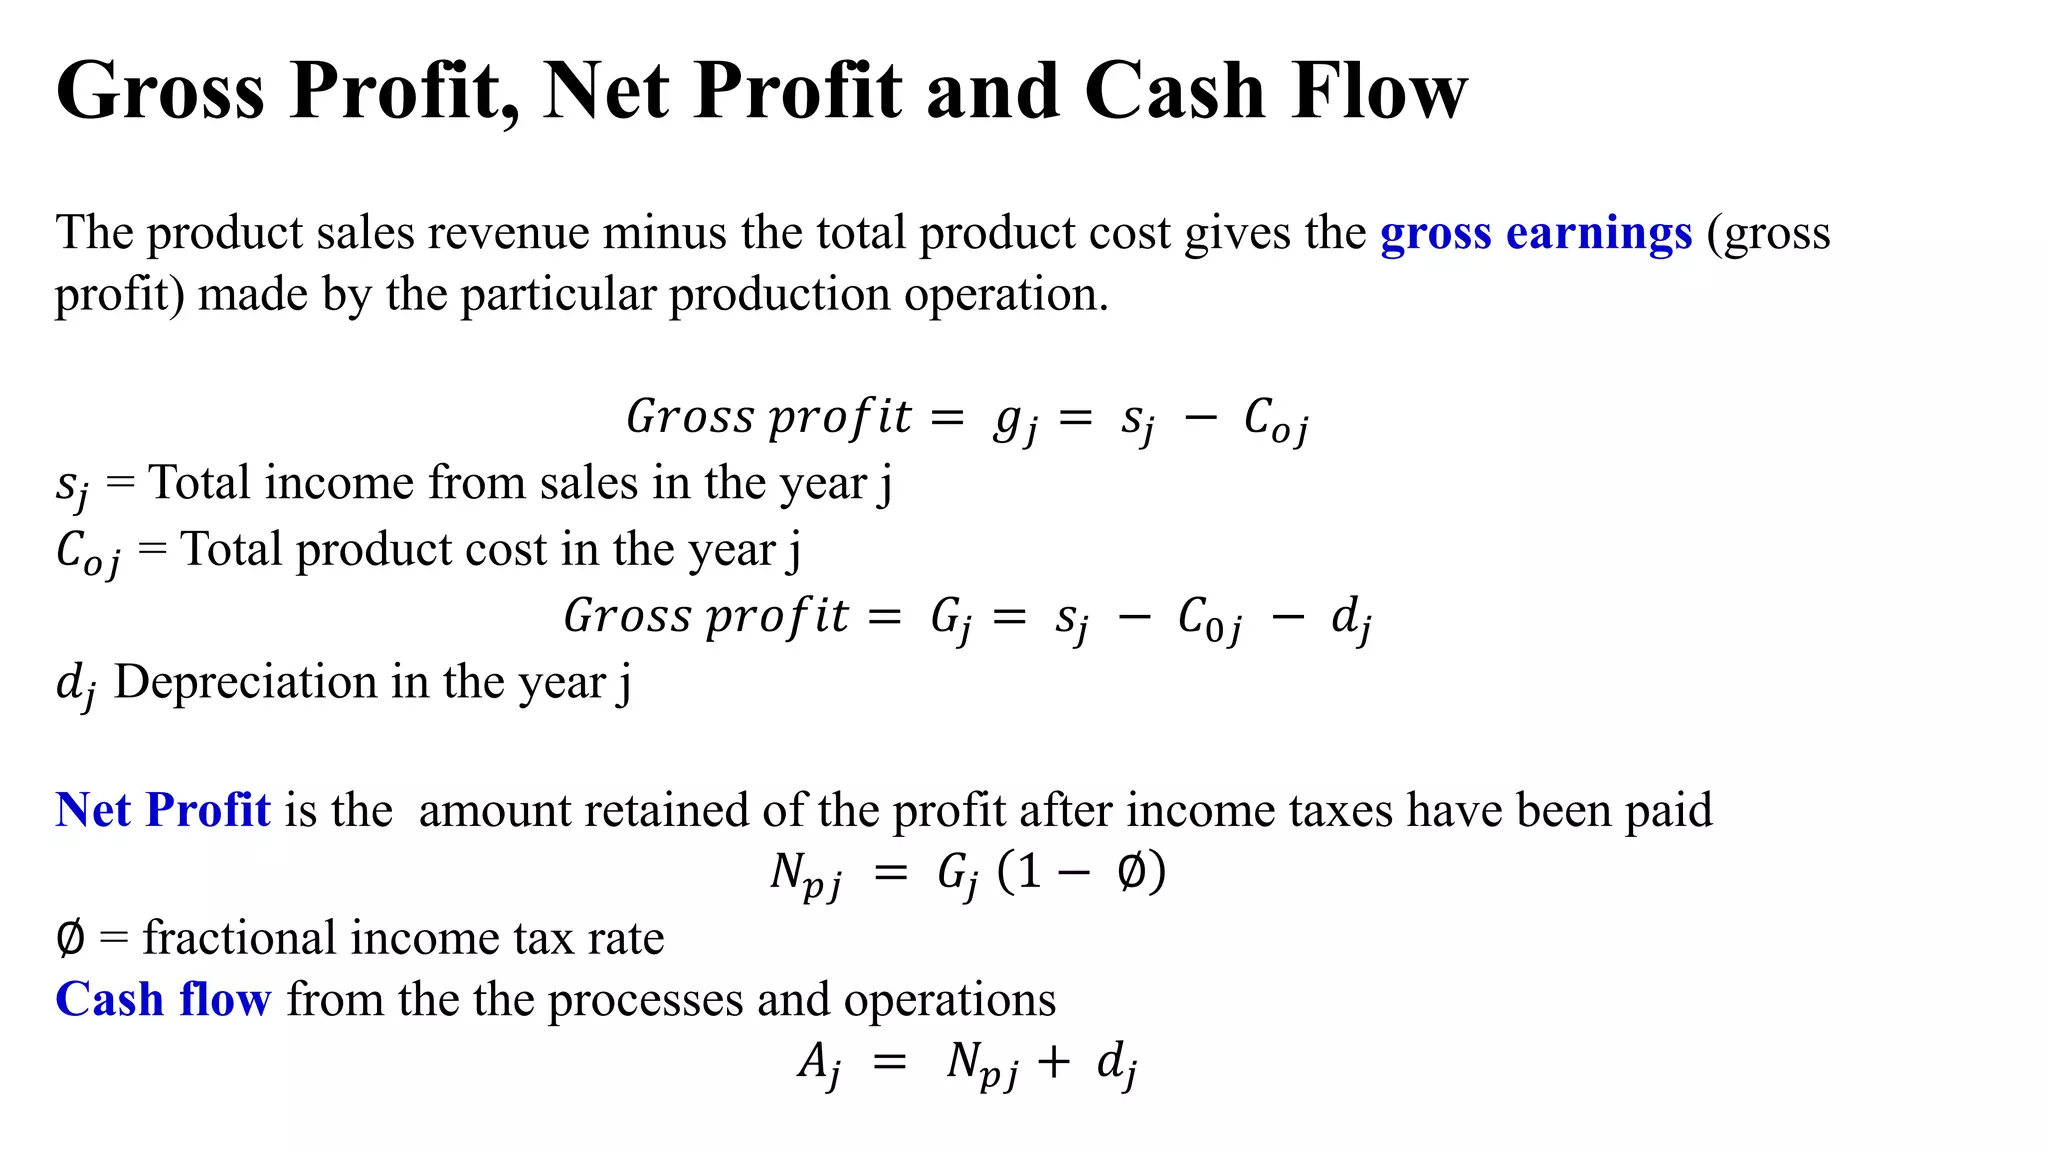
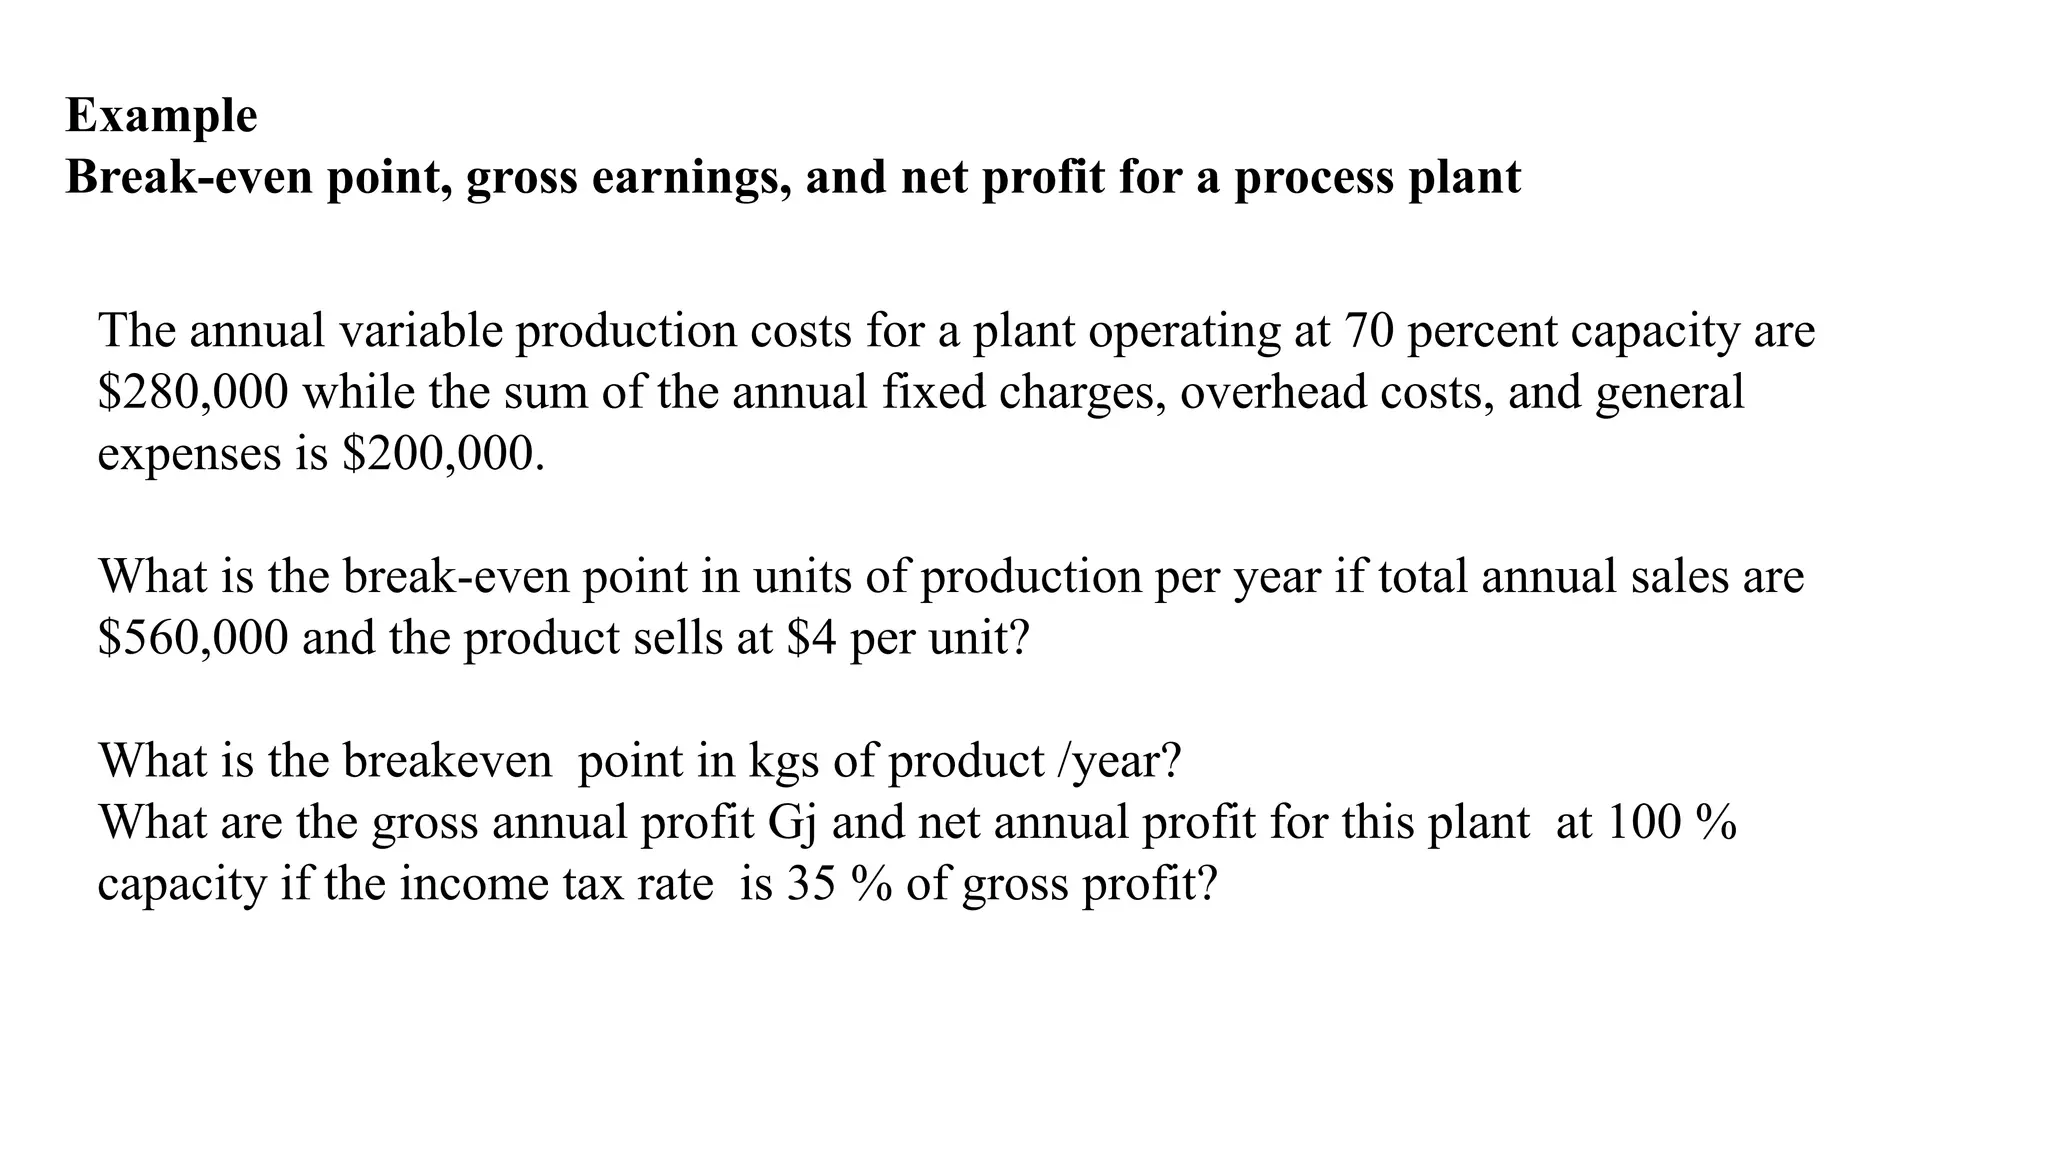
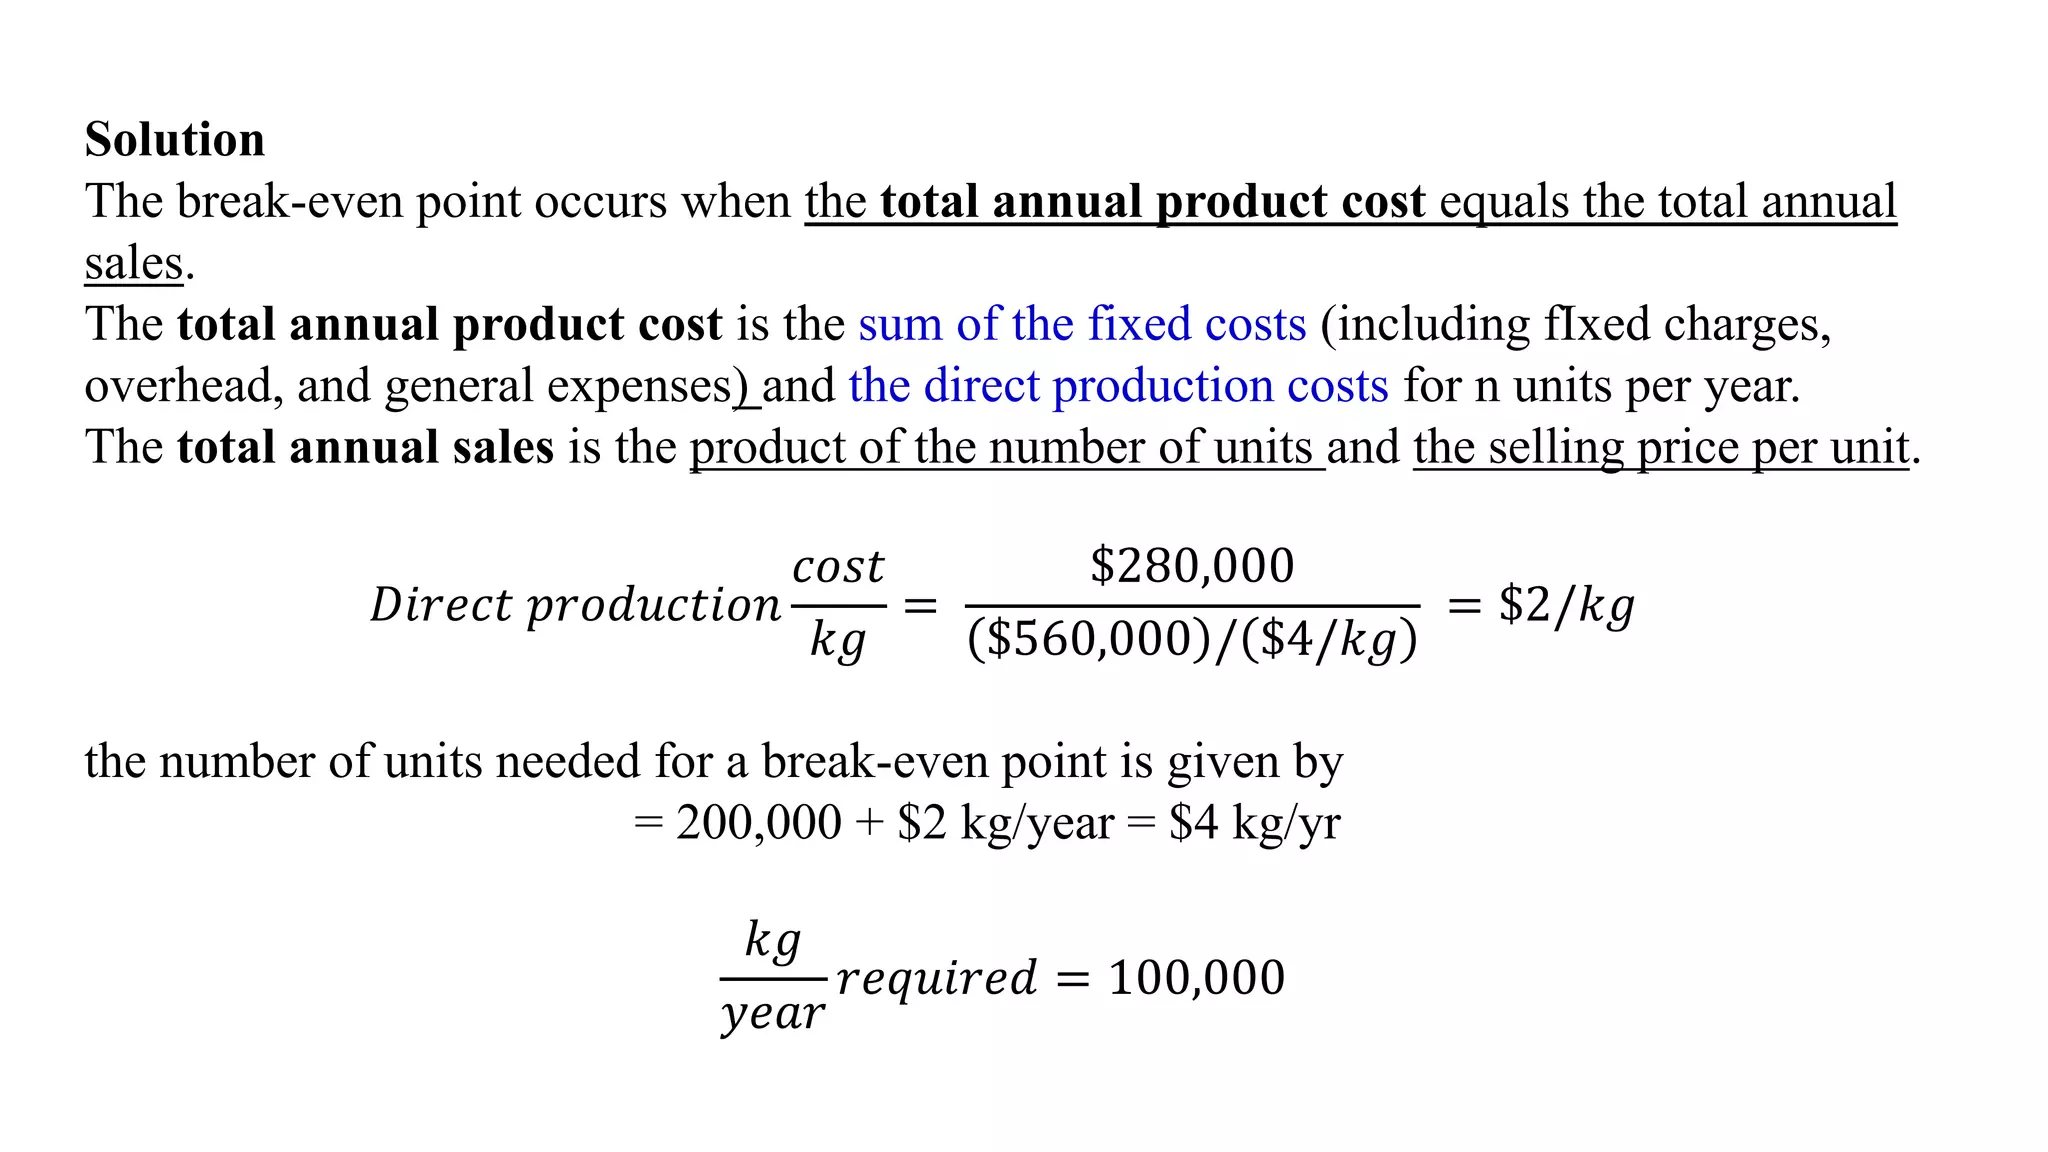
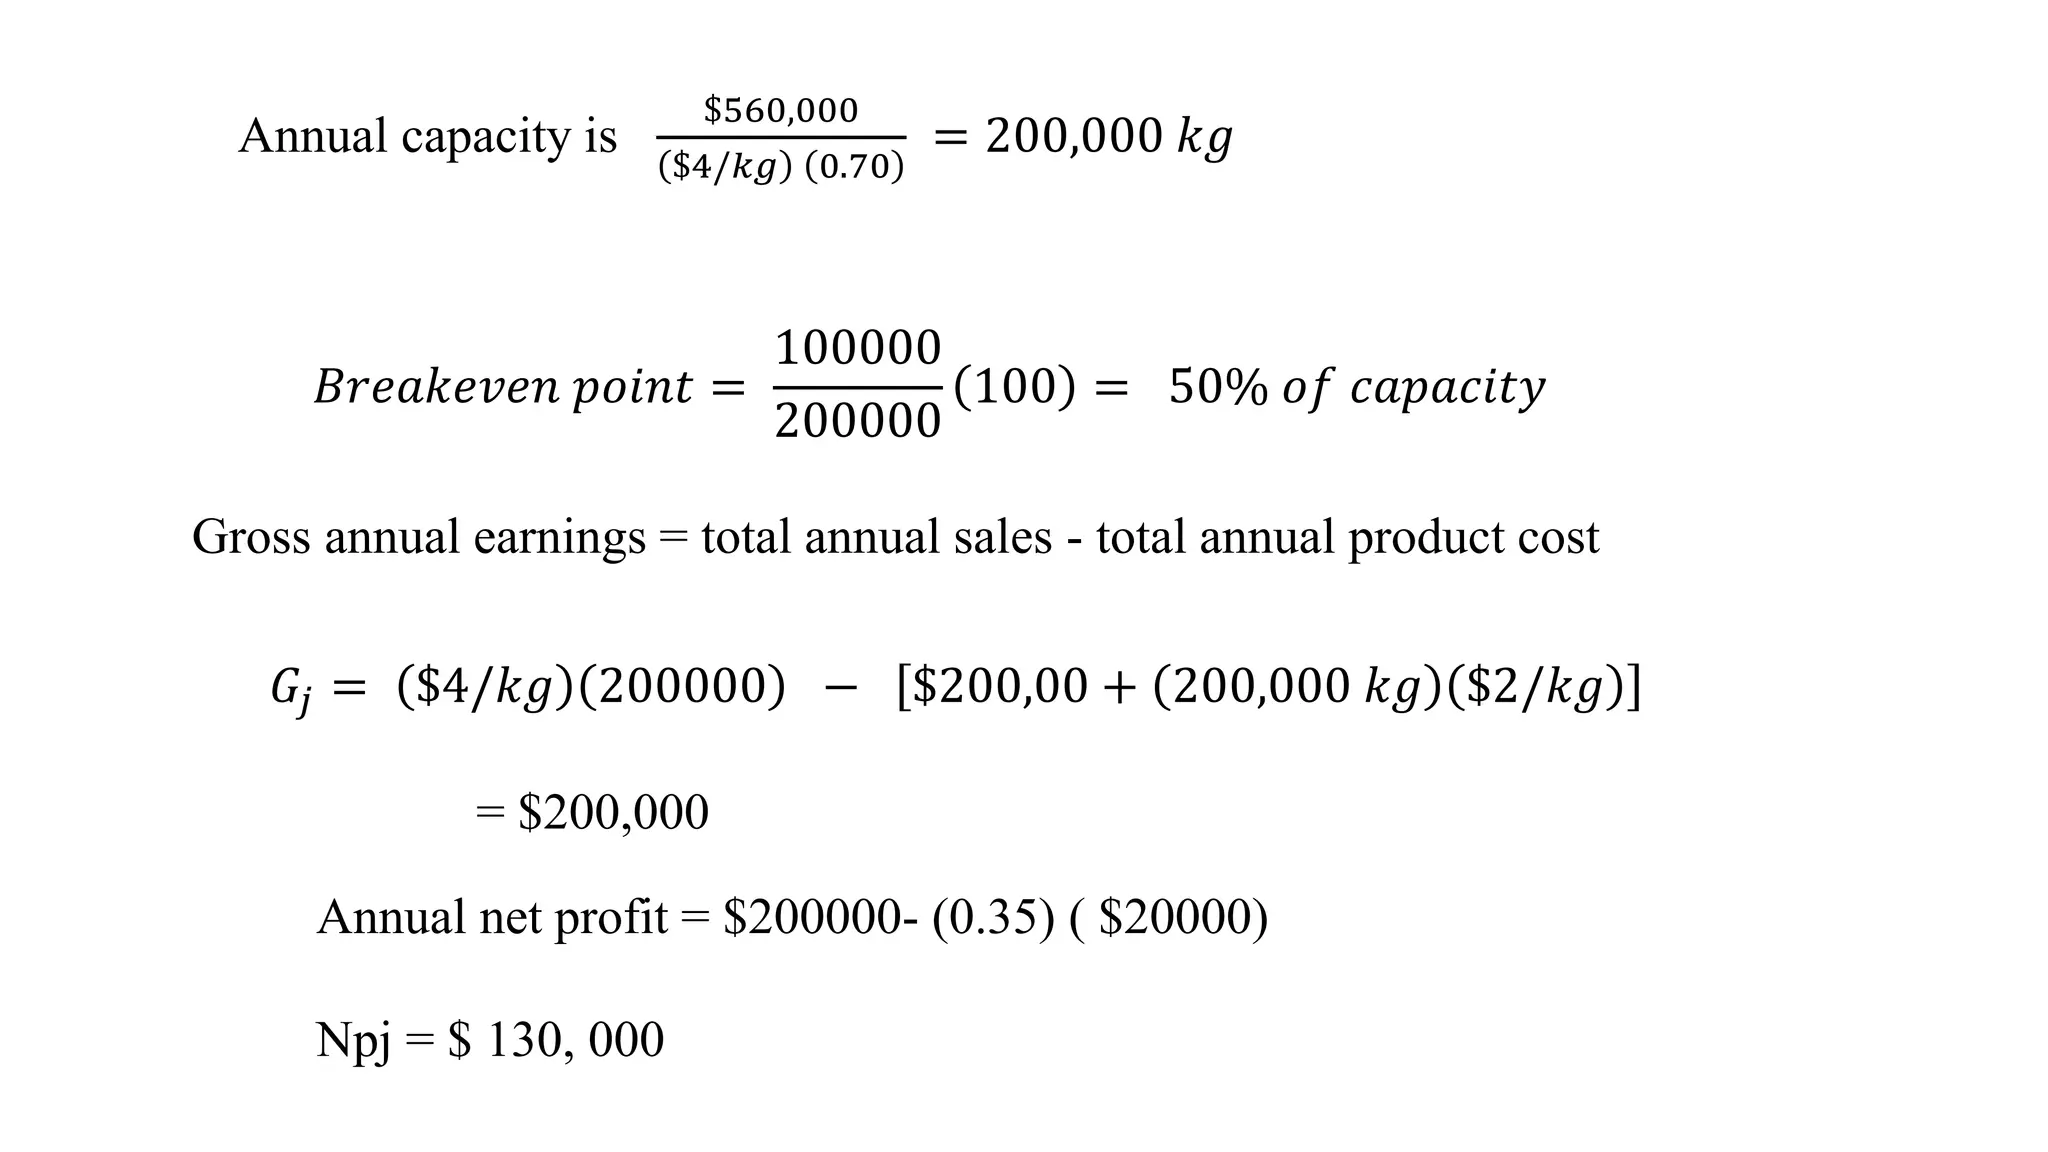

The document discusses the concepts of gross profit, net profit, and cash flow in production operations, detailing how gross profit is calculated from sales revenue and total product costs. It also explains the break-even point in terms of production costs and sales revenue, providing a sample calculation for a plant operating at 70% capacity. Additionally, it references various engineering economy textbooks used for preparation.