Downloaded 211 times


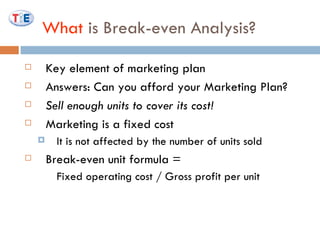
![Example: Basic Calculations Sum Calculation Price Item Description $26 - $6 $50 - $24 $100 - 50 $50 + $0 25 * $2 $4 * 25 $20 Net Profit [Pre-Tax Net Profit – Tax] $6 Tax $26 Pre-Tax Net Profit [Gross Profit – Total Fixed Cost] $24 Total Fixed Cost (Marketing) $50 Gross Profit [Revenue – Total Variable Cost] $50 Total Variable Cost [COGS + Other VC] $0 Other Variable Costs $50 COGS [Units Sold * Cost of Unit] $100 Revenue [Unit Sale Price * Units Sold] 25 Total Units Sold $4 Sale Price of unit $2 Cost of Each unit](https://image.slidesharecdn.com/revisedbreakevenanalysis-1234385074772253-1/85/Marketing-II-Break-Even-Analysis-5-320.jpg)
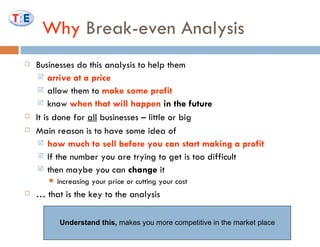
![Specifics: Break-even Units $20 $26 - $6 Net Profit [Pre-Tax Net Profit – Tax] $6 Tax $24 Total Fixed Cost (Marketing) $26 $50 - $24 Pre-Tax Net Profit [Gross Profit – Total Fixed Cost] $50 + $0 $50 Total Variable Cost [COGS + Other VC] 25 * $2 $50 COGS [Units Sold * Cost of Unit] $0 Other Variable Costs Sum Calculation Price Item Description $24/$2 $50/25 $100 * $50 $4 * 25 $12 Break-even Units = Fixed Operating Cost/Gross Profit Per Unit $2 Gross Profit Per Unit = Total Gross Profits/Units Sold $50 Gross Profit [Revenue – Total Variable Cost] $100 Revenue [Unit Sale Price * Units Sold] 25 Total Units Sold $4 Sale Price of unit $2 Cost of Each unit](https://image.slidesharecdn.com/revisedbreakevenanalysis-1234385074772253-1/85/Marketing-II-Break-Even-Analysis-6-320.jpg)
![Change in Units Sold $12 $24/$2 Break-even Units = Fixed Operating Cost/Gross Profit Per Unit $0 $0 - $0 Net Profit [Pre-Tax Net Profit – Tax] $0 Tax $0 $24 - $24 Pre-Tax Net Profit [Gross Profit – Total Fixed Cost] $24 Total Fixed Cost (Marketing) $24 + $0 $24 Total Variable Cost [COGS + Other VC] $0 Other Variable Costs 12 * $2 $24 COGS [Units Sold * Cost of Unit] Sum Calculation Price Item Description $24/12 $48 - $24 $4 * 12 $2 Gross Profit Per Unit = Total Gross Profits/Units Sold $24 Gross Profit [Revenue – Total Variable Cost] $48 Revenue [Unit Sale Price * Units Sold] 12 Total Units Sold $4 Sale Price of unit $2 Cost of Each unit](https://image.slidesharecdn.com/revisedbreakevenanalysis-1234385074772253-1/85/Marketing-II-Break-Even-Analysis-7-320.jpg)
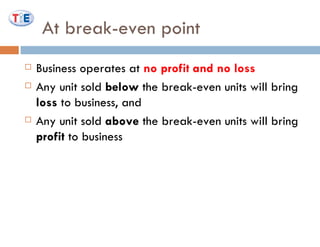
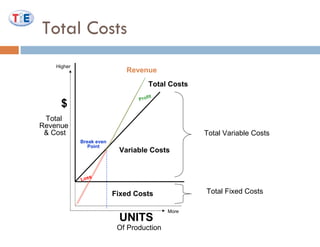
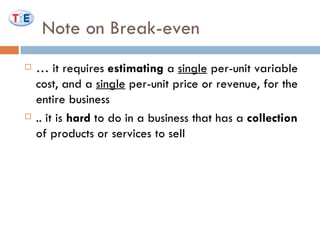
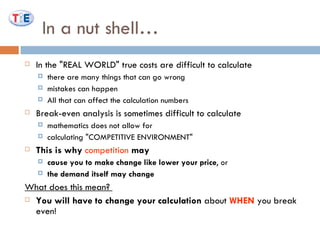
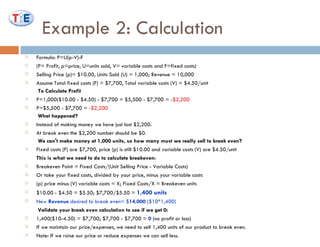

The document discusses break-even analysis, which is a key element of marketing plans. It defines break-even analysis as the number of units a business must sell to cover its fixed costs. The document provides an example calculation showing how to determine break-even units. It also notes that break-even analysis helps businesses understand what price and sales volume are needed to start generating a profit. However, break-even analysis becomes more difficult when a business has multiple products or services.


