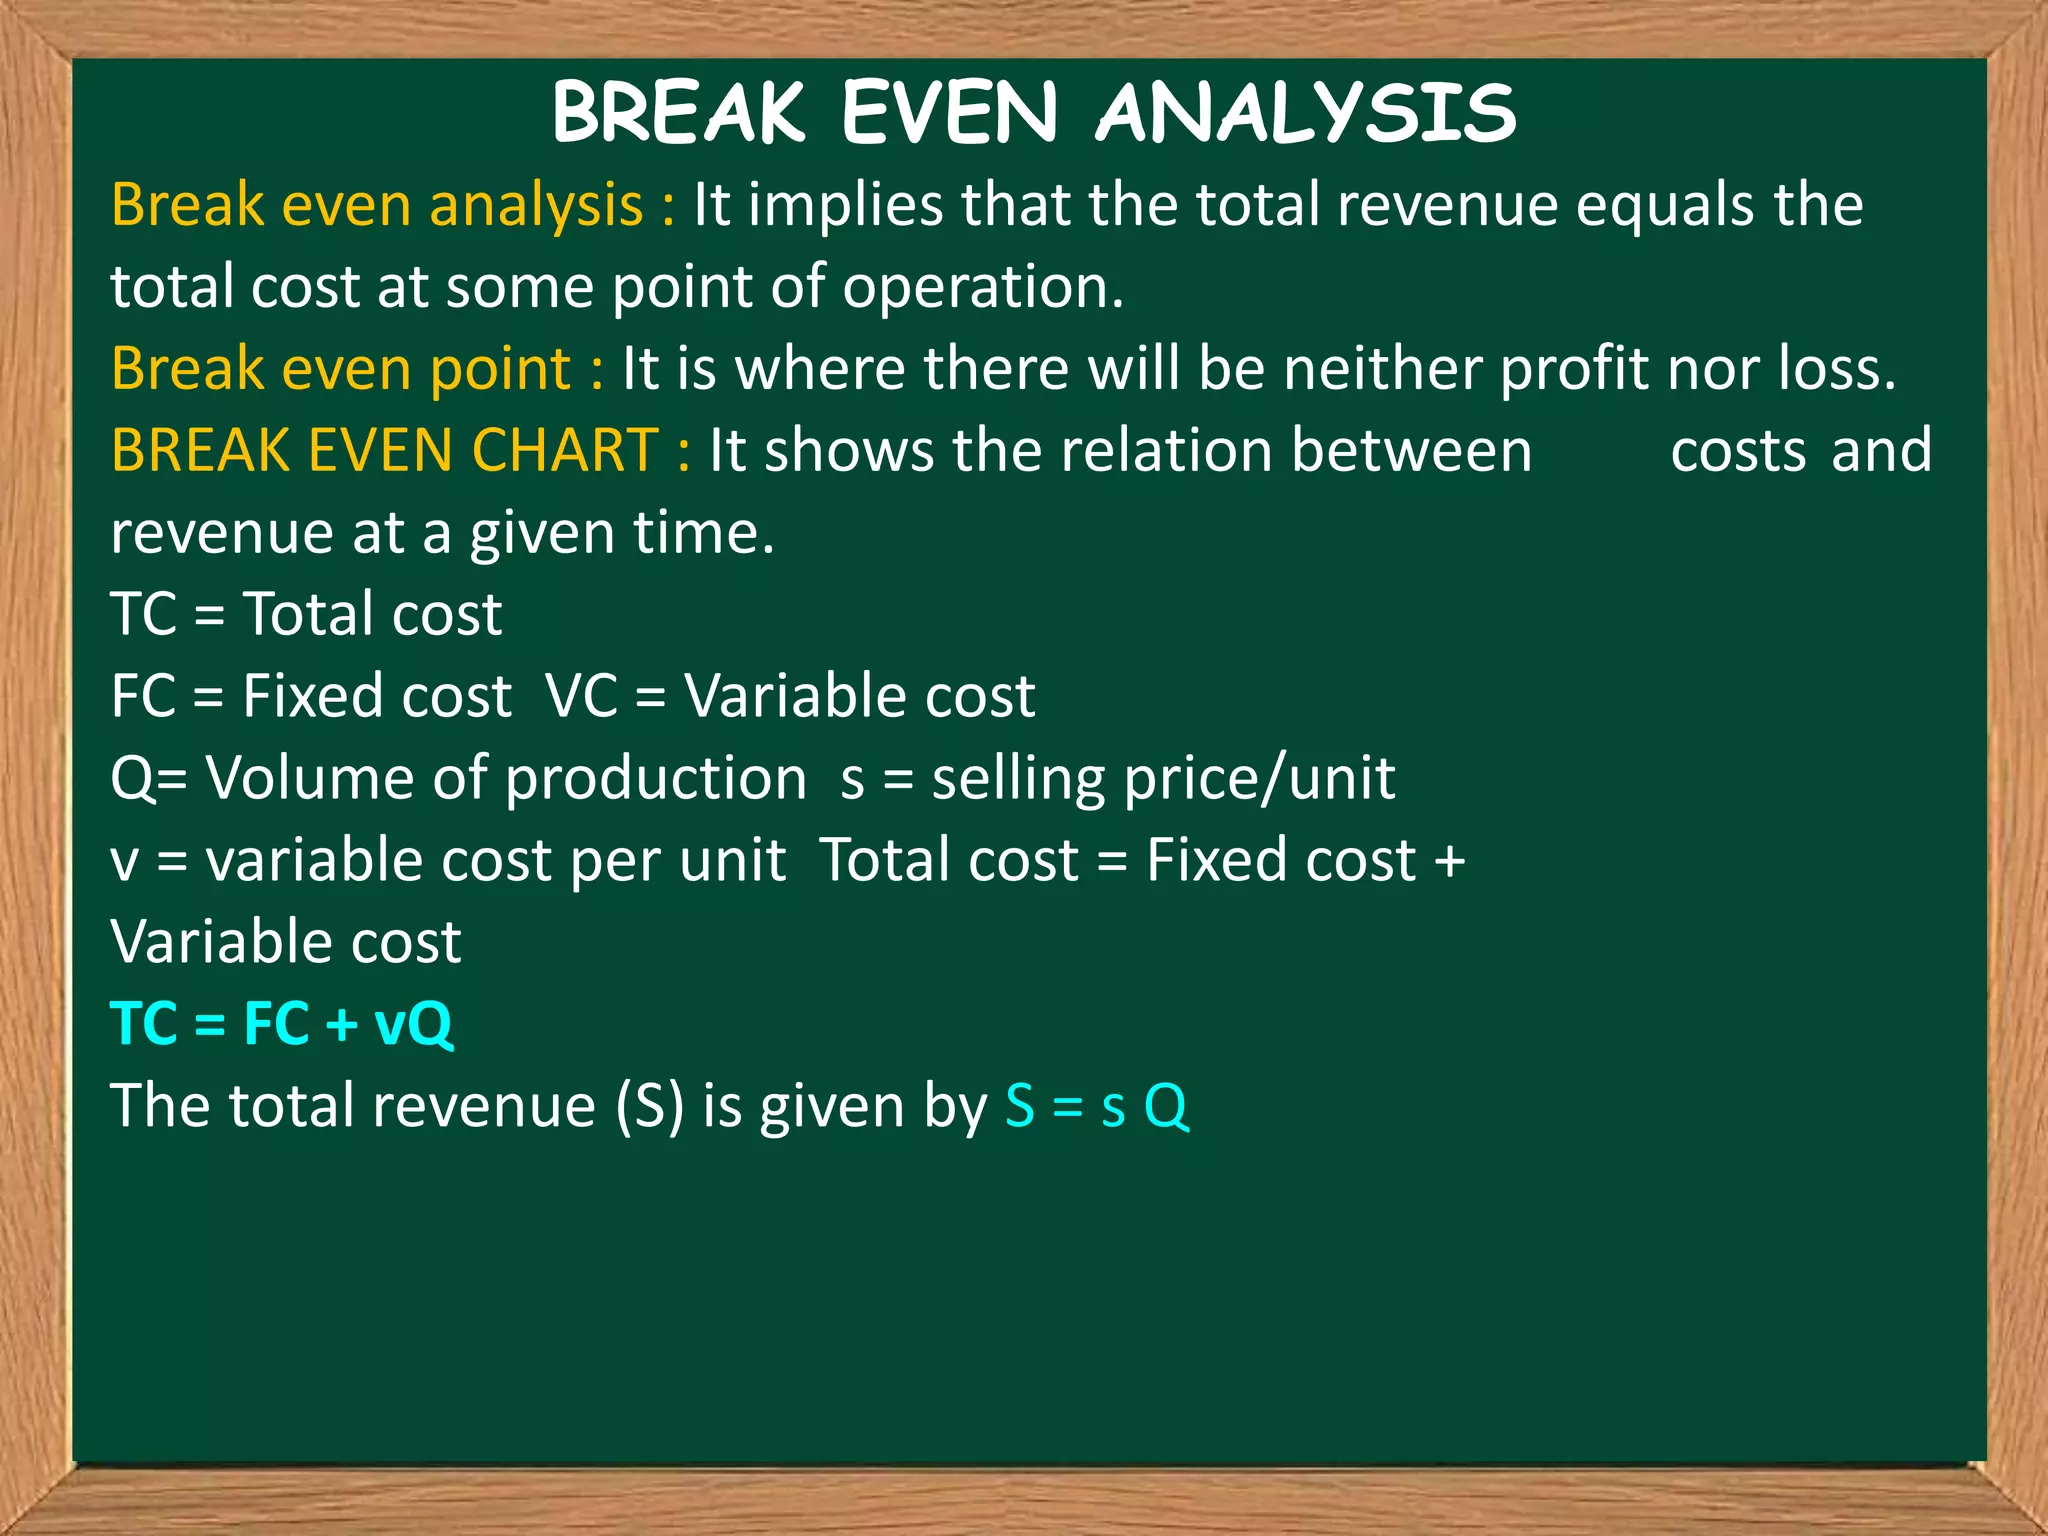
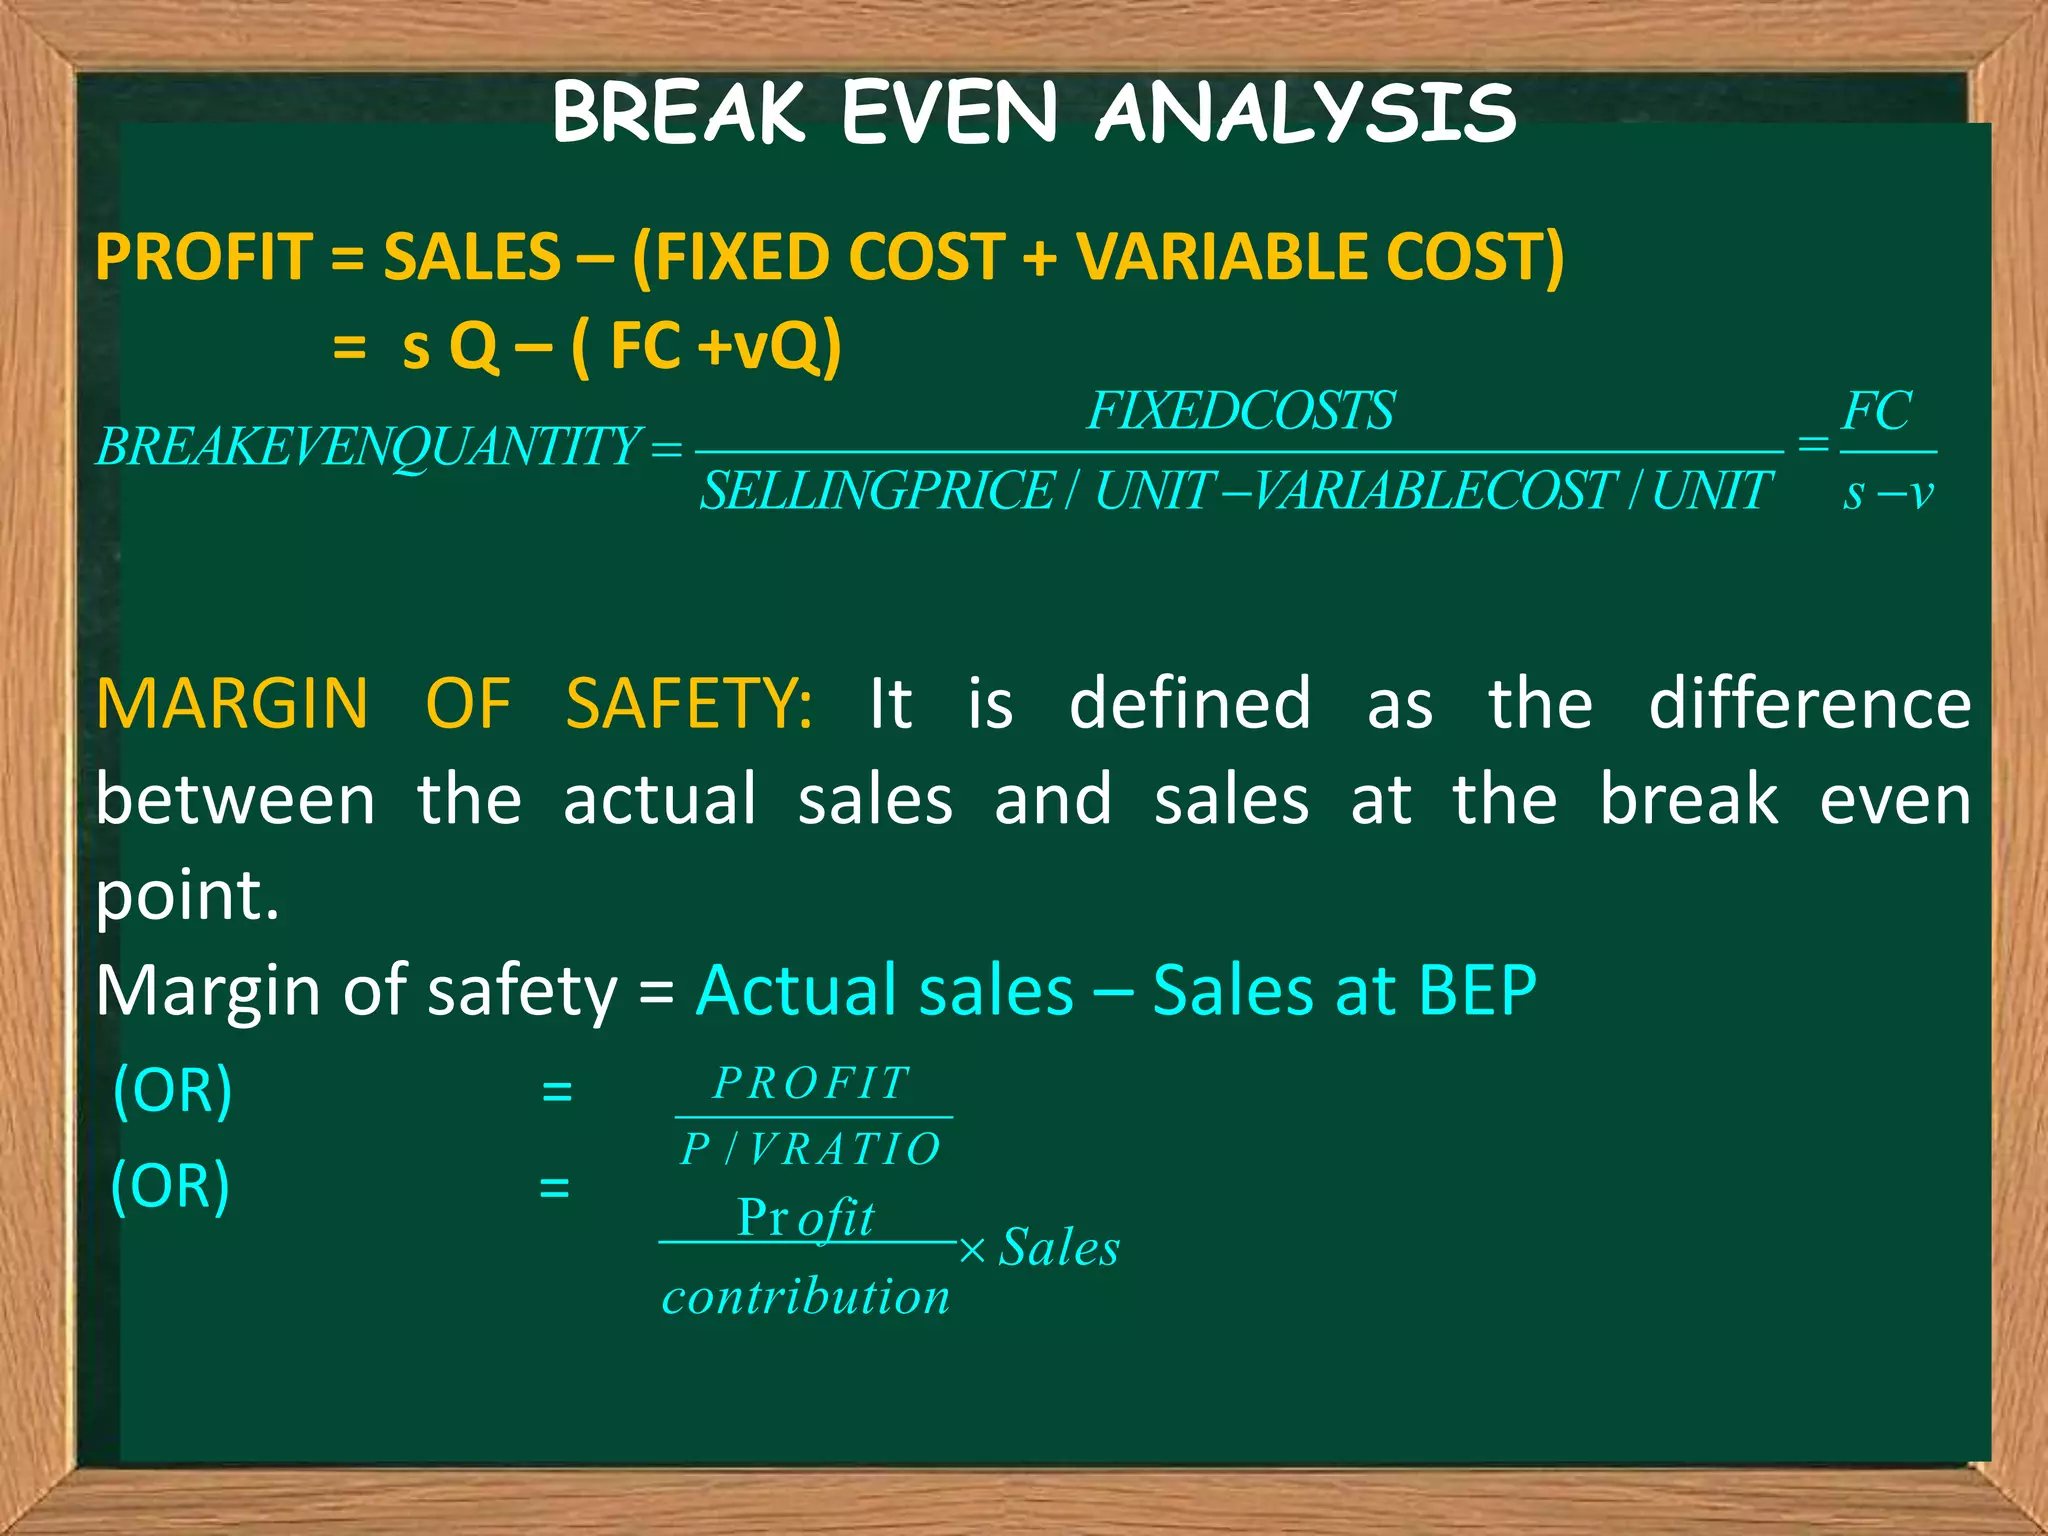
BREAK EVEN ANALYSIS
Break even analysis : It implies that the total revenue equals the
total cost at some point of operation.
Break even point : It is where there will be neither profit nor loss.
costs and
BREAK EVEN CHART : It shows the relation between
revenue at a given time.
TC = Total cost
FC = Fixed cost VC = Variable cost
Q= Volume of production s = selling price/unit
v = variable cost per unit Total cost = Fixed cost +
Variable cost
TC = FC + vQ
The total revenue (S) is given by S = s Q
SELLING PRICE OF A PRODUCT
1. Prime cost = Direct material cost + Direct labour
cost+ Direct Expenses.
2. Factory Cost = Prime cost + Factory overhead.
3. Cost of production = Factory cost + Office &
Administrative overhead.
4. Cost of Sales = Cost of goods sold +Selling &
Distribution overhead.
5. Sales = Cost of sales+ profit.
6. Selling price/Unit = Sales/Quantity sold
BREAK EVEN CHART
BREAK EVEN ANALYSIS
The linear plots of the total cost and total
sales revenue are shown in the fig.
The intersection point of the above two
lines is called break even point & the
corresponding quantity in the X axis is
the break even quantity.
For any production quantity which is less
than the break even quantity the firm
will make loss because total cost > total
revenue.
For any production quantity which is
more than the break even quantity the
firm will make profit because total
revenue > total cost.
BREAK EVEN ANALYSIS
PROFIT = SALES – (FIXED COST + VARIABLE COST)
= s Q – ( FC +vQ)
MARGIN OF SAFETY: It is defined as the difference
between the actual sales and sales at the break even
point.
Margin of safety = Actual sales – Sales at BEP
(OR)
(OR)
=
=
FIXEDCOSTS
BREAKEVENQUANTITY  
FC
SELLINGPRICE/ UNITVARIABLECOST /UNIT s v
PRO FIT
P / VRATIO
contribution
Pr ofit
 Sales
BREAK EVEN ANALYSIS.ppt

BREAK EVEN ANALYSIS.ppt

  • 1.
    BREAK EVEN ANALYSIS Breakeven analysis : It implies that the total revenue equals the total cost at some point of operation. Break even point : It is where there will be neither profit nor loss. costs and BREAK EVEN CHART : It shows the relation between revenue at a given time. TC = Total cost FC = Fixed cost VC = Variable cost Q= Volume of production s = selling price/unit v = variable cost per unit Total cost = Fixed cost + Variable cost TC = FC + vQ The total revenue (S) is given by S = s Q
  • 2.
    SELLING PRICE OFA PRODUCT 1. Prime cost = Direct material cost + Direct labour cost+ Direct Expenses. 2. Factory Cost = Prime cost + Factory overhead. 3. Cost of production = Factory cost + Office & Administrative overhead. 4. Cost of Sales = Cost of goods sold +Selling & Distribution overhead. 5. Sales = Cost of sales+ profit. 6. Selling price/Unit = Sales/Quantity sold
  • 3.
  • 4.
    BREAK EVEN ANALYSIS Thelinear plots of the total cost and total sales revenue are shown in the fig. The intersection point of the above two lines is called break even point & the corresponding quantity in the X axis is the break even quantity. For any production quantity which is less than the break even quantity the firm will make loss because total cost > total revenue. For any production quantity which is more than the break even quantity the firm will make profit because total revenue > total cost.
  • 5.
    BREAK EVEN ANALYSIS PROFIT= SALES – (FIXED COST + VARIABLE COST) = s Q – ( FC +vQ) MARGIN OF SAFETY: It is defined as the difference between the actual sales and sales at the break even point. Margin of safety = Actual sales – Sales at BEP (OR) (OR) = = FIXEDCOSTS BREAKEVENQUANTITY   FC SELLINGPRICE/ UNITVARIABLECOST /UNIT s v PRO FIT P / VRATIO contribution Pr ofit  Sales