Download to read offline


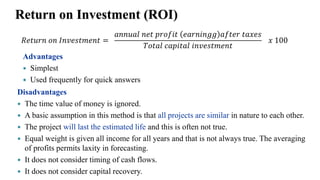


This document discusses various methods for evaluating project profitability and investment decisions. It describes quantitative measures like return on investment, return on average investment, payback period, net present worth, and internal rate of return. It also discusses qualitative, intangible factors like employee morale, safety, corporate image, and management goals. The document provides definitions and limitations of different profitability measures. It categorizes project types and notes profitability is difficult to define but important for decision making and maximizing returns on investment.