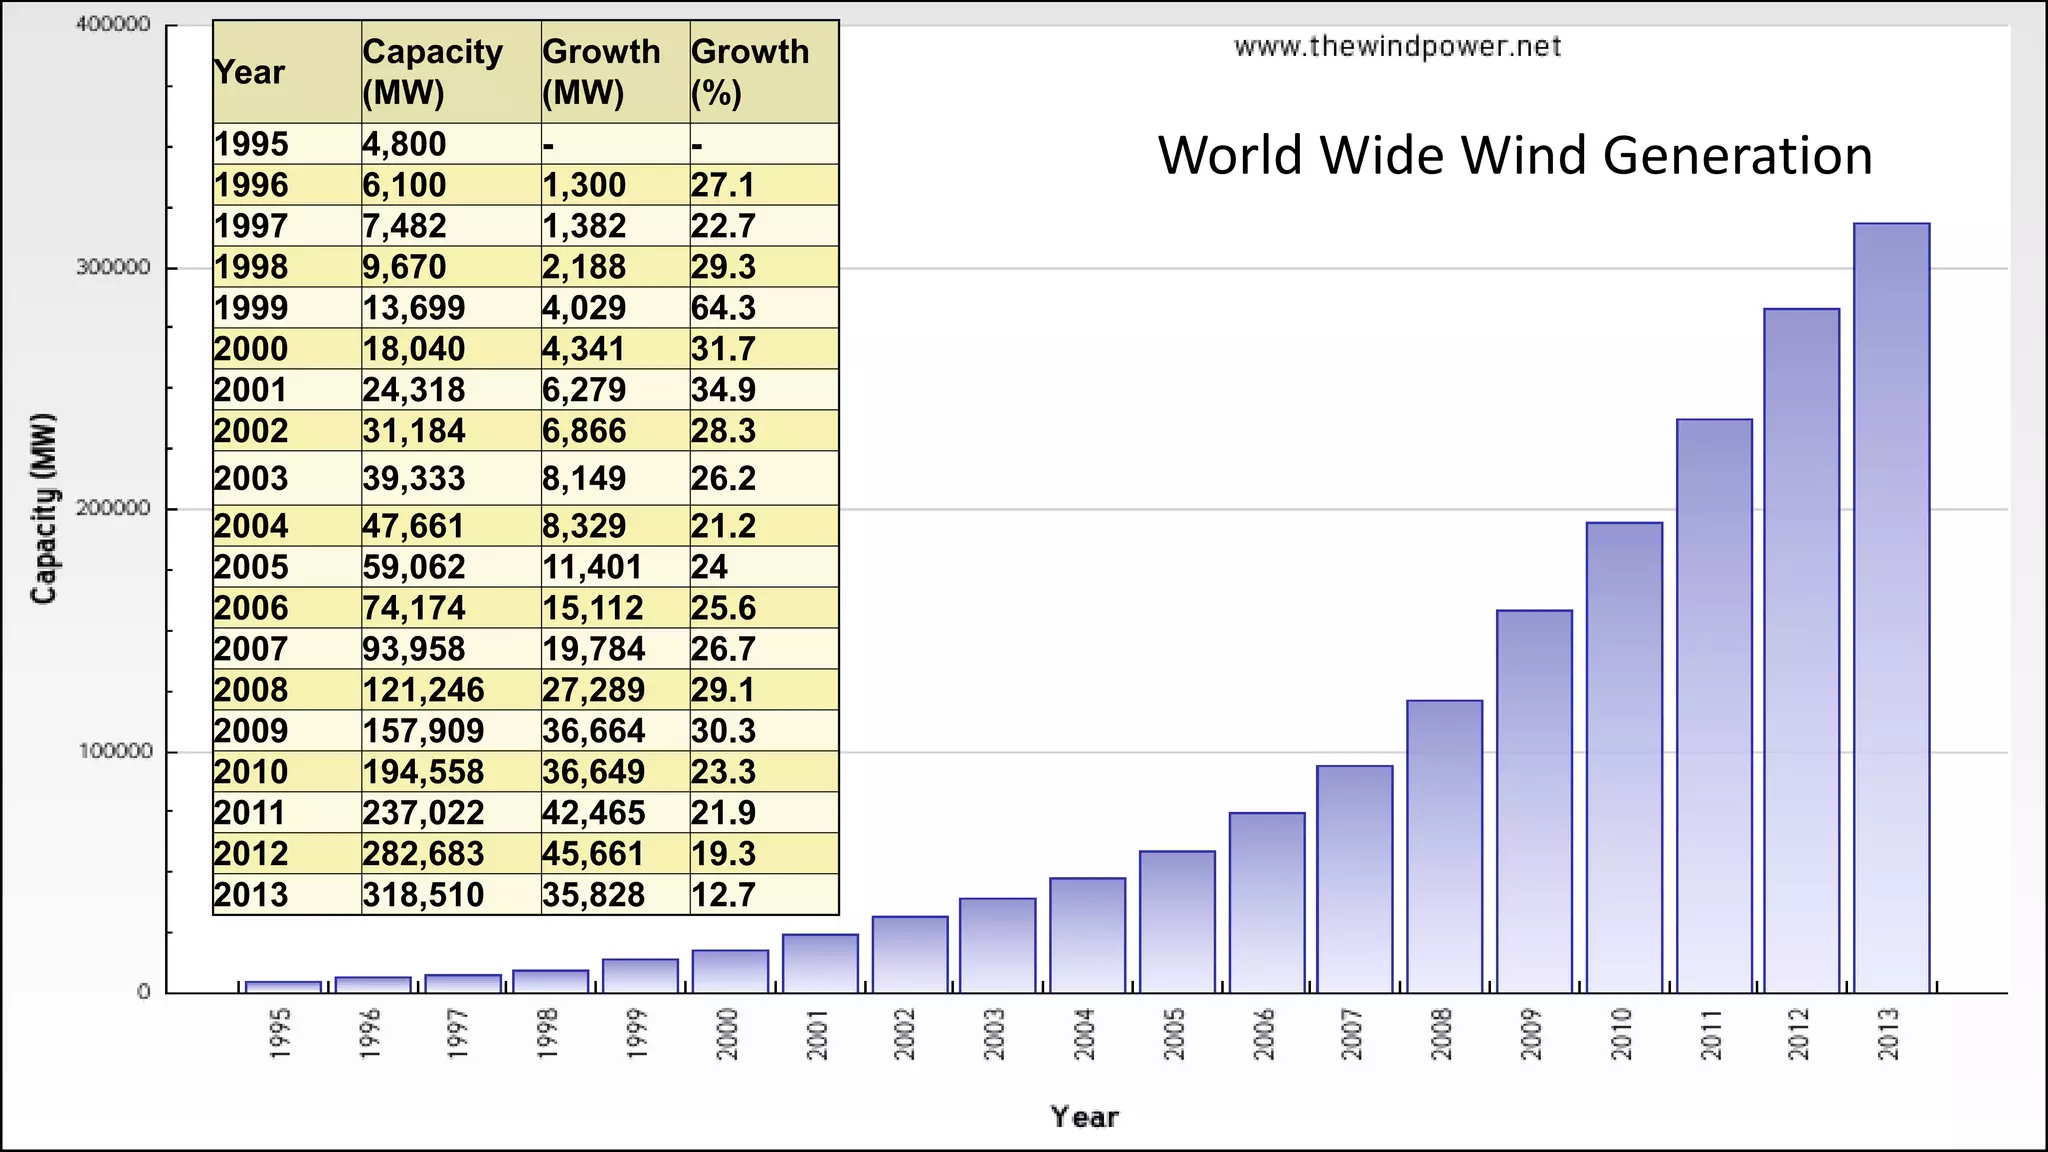
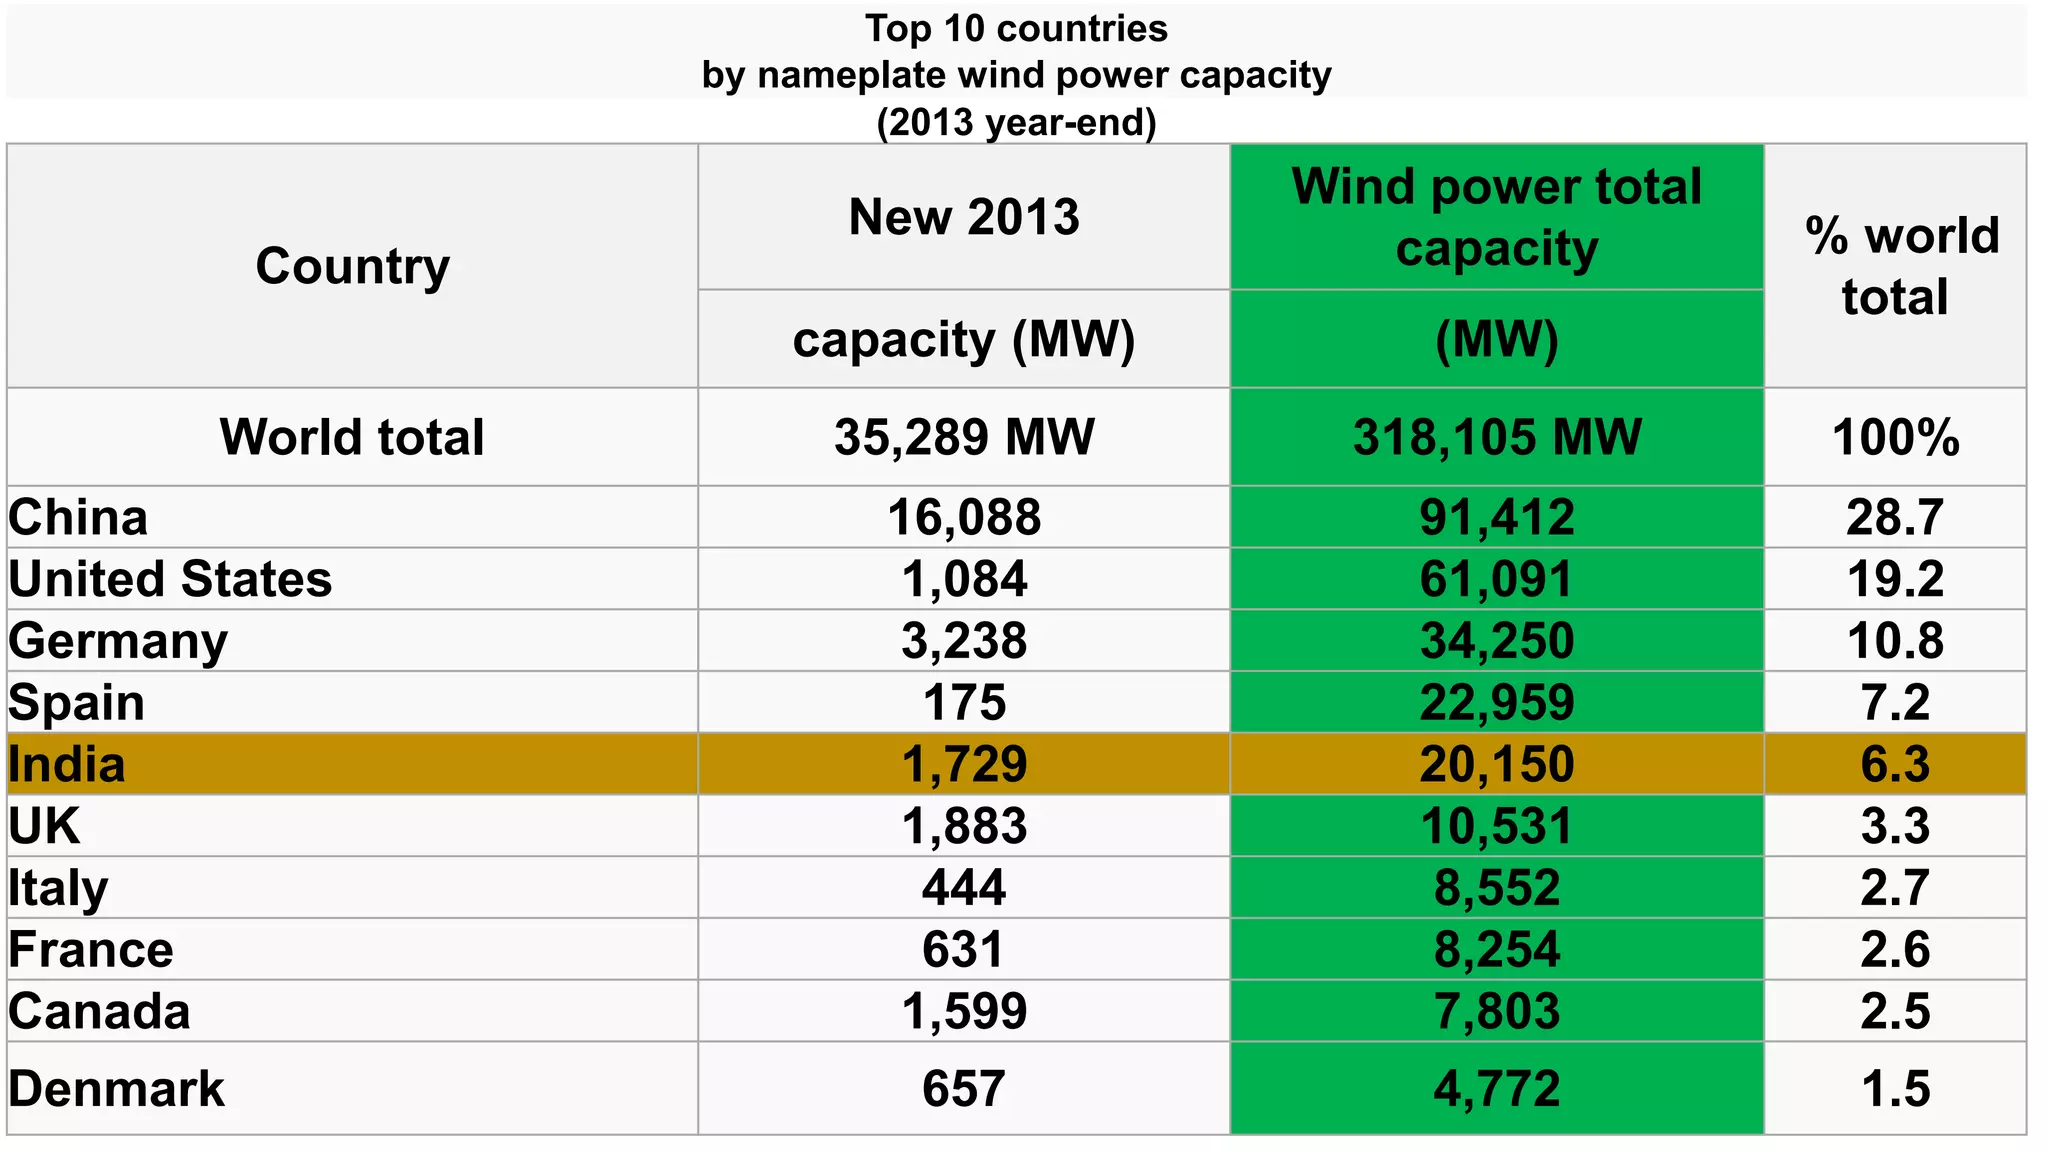
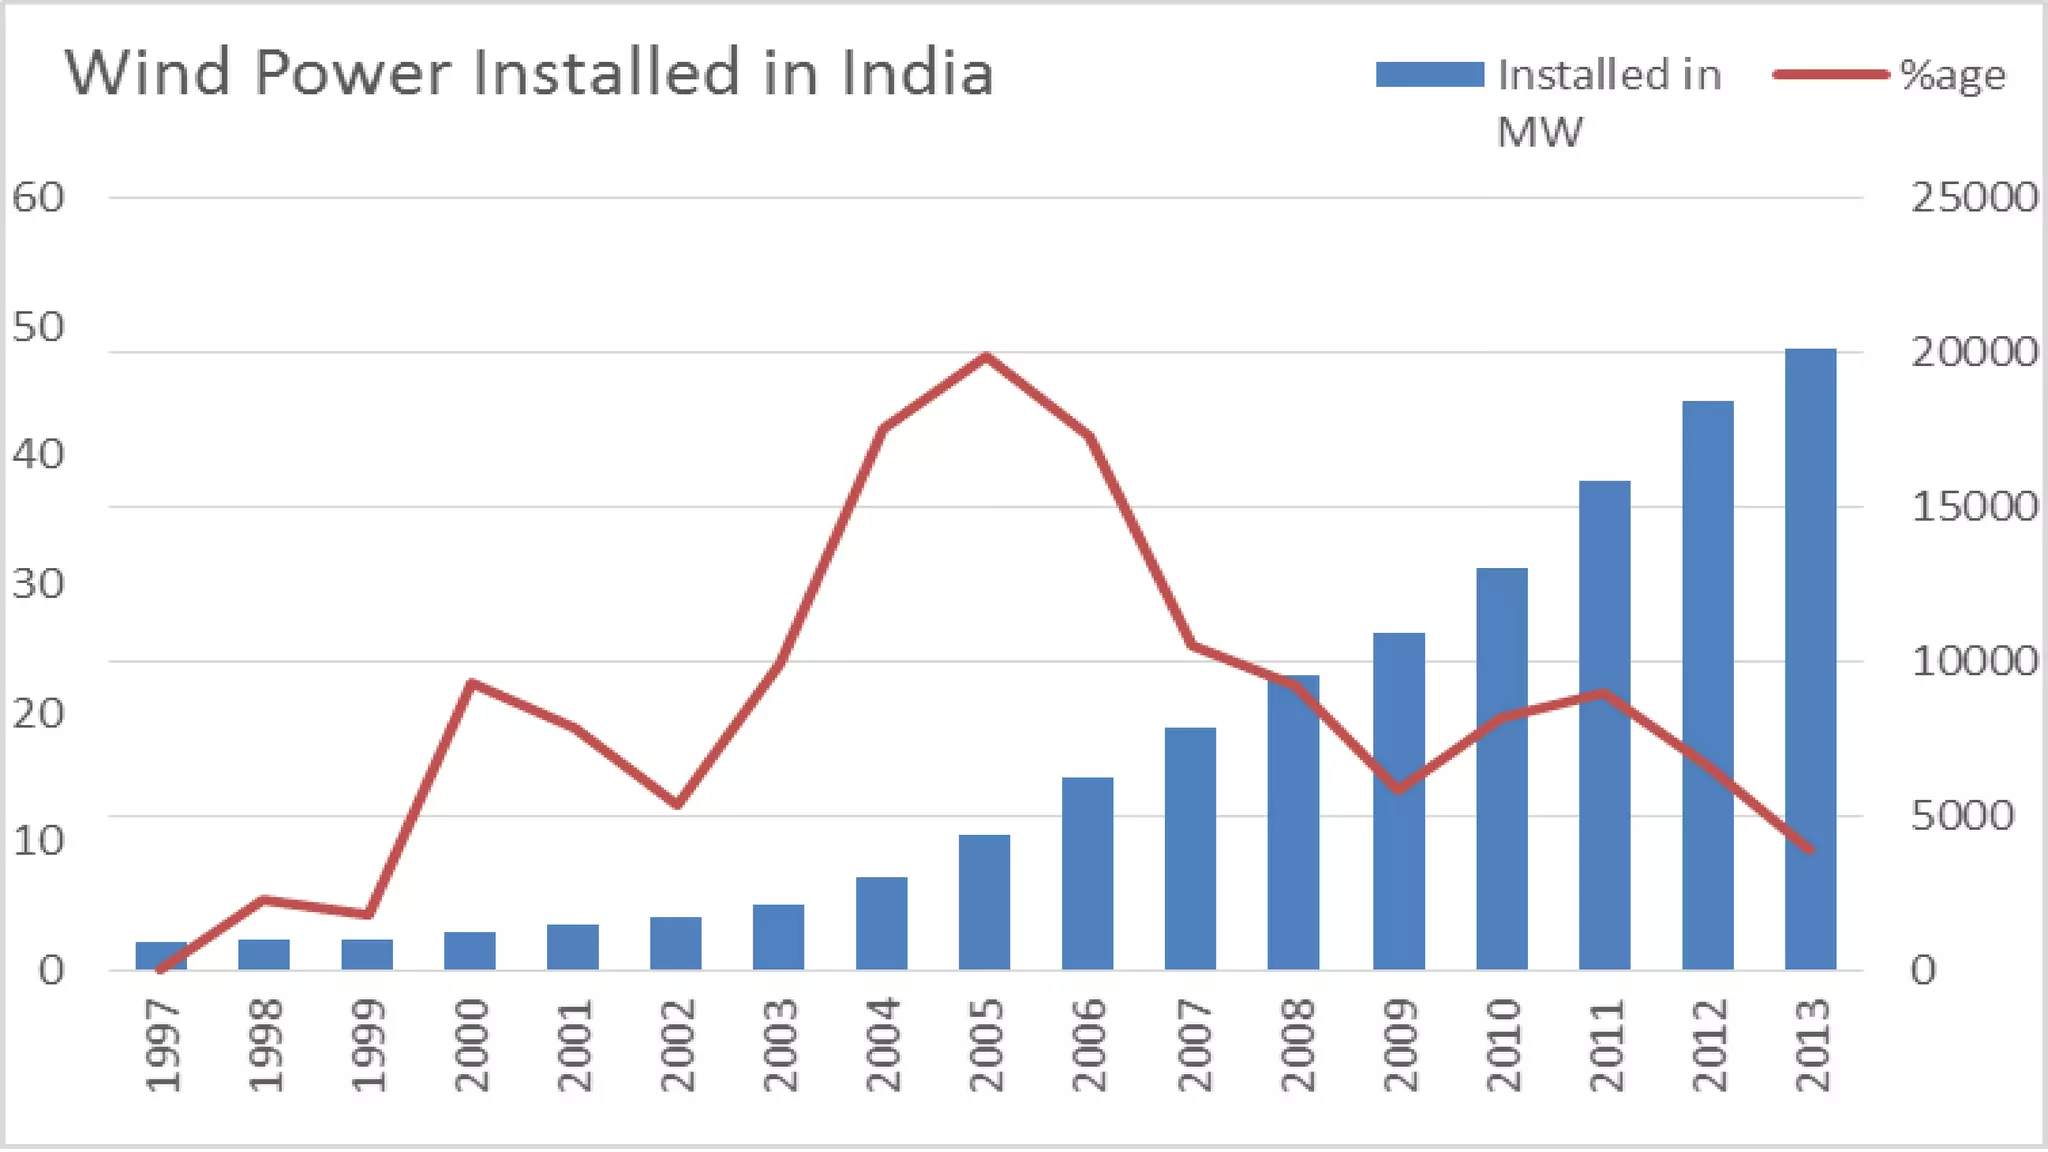
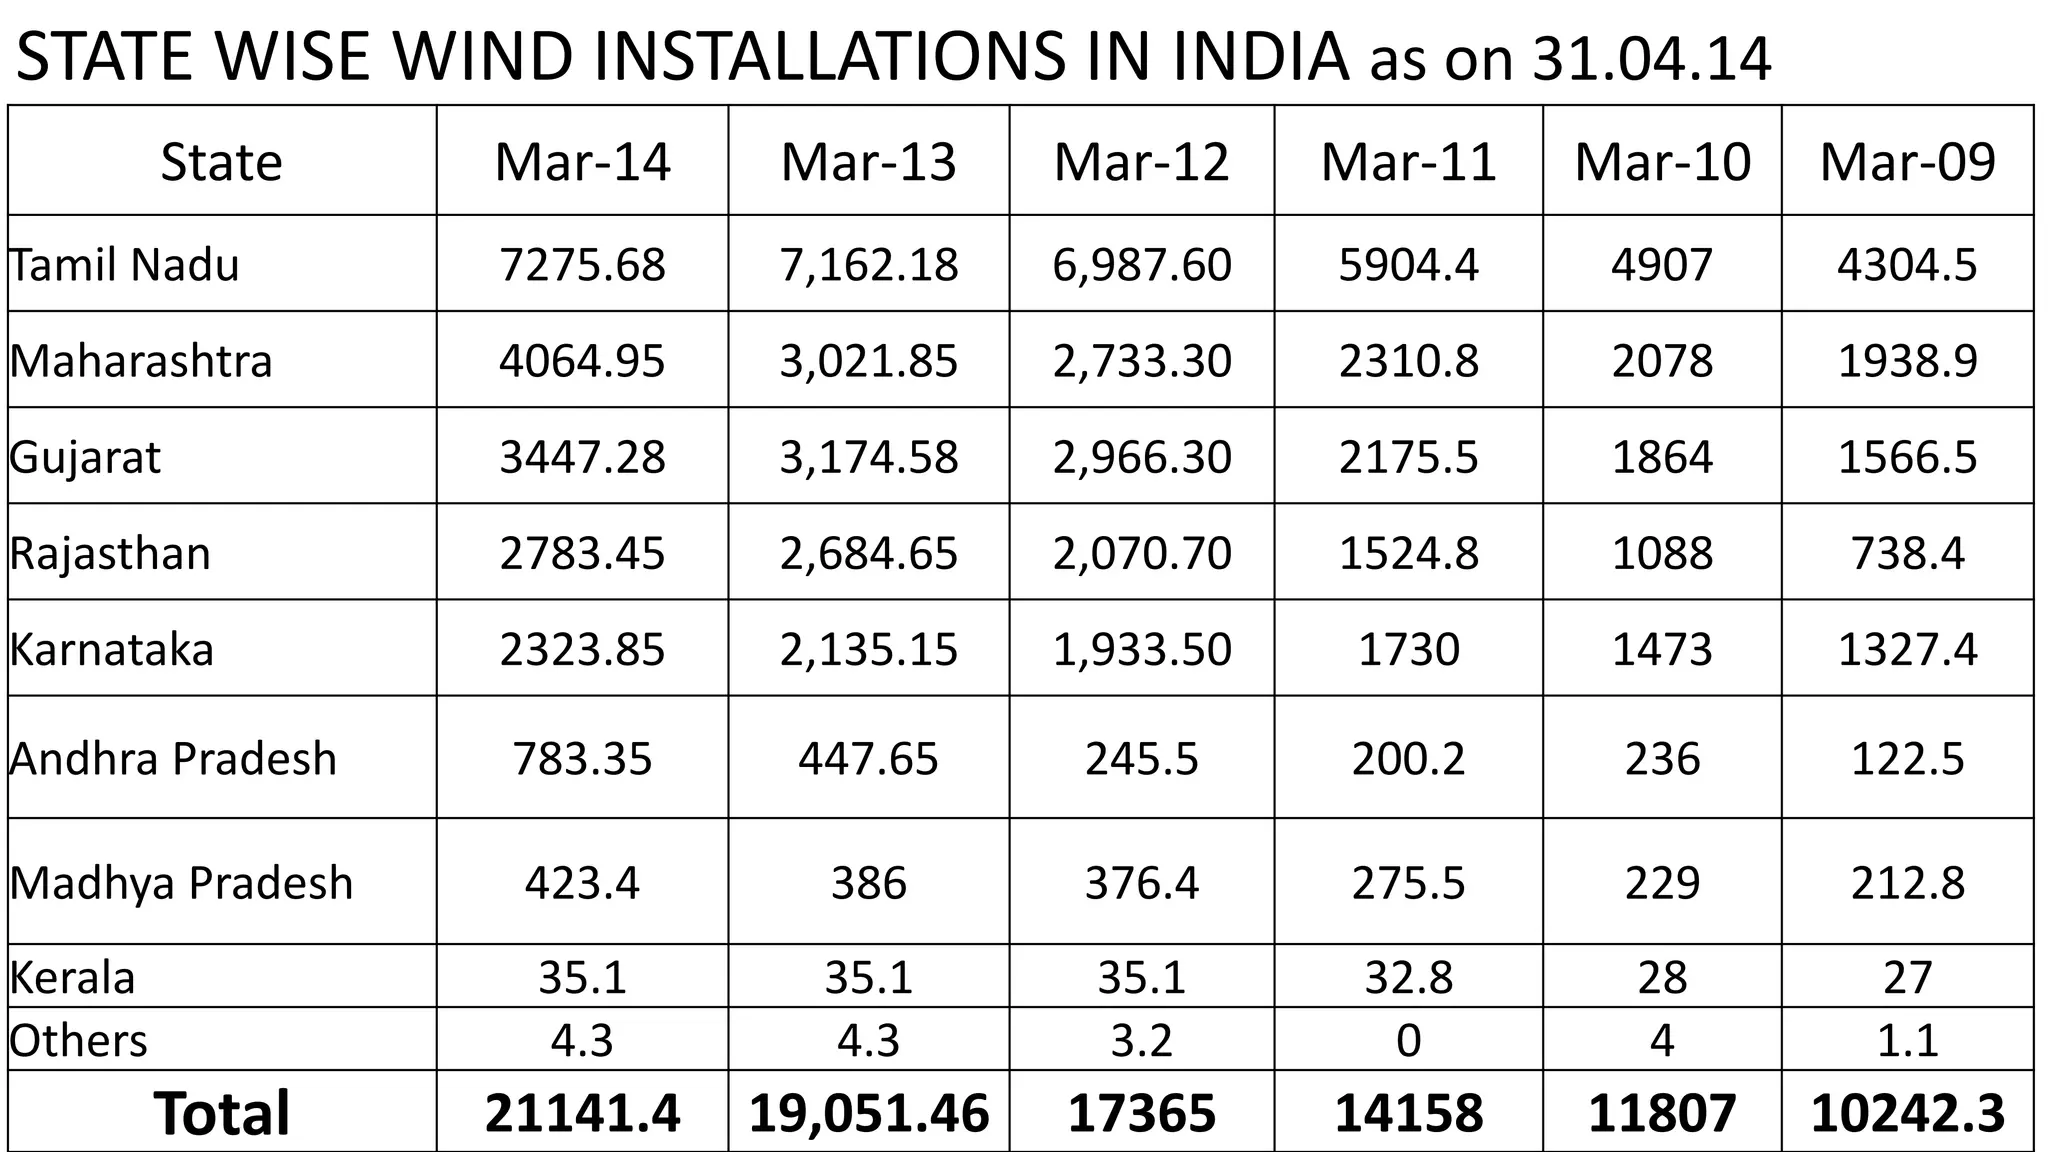
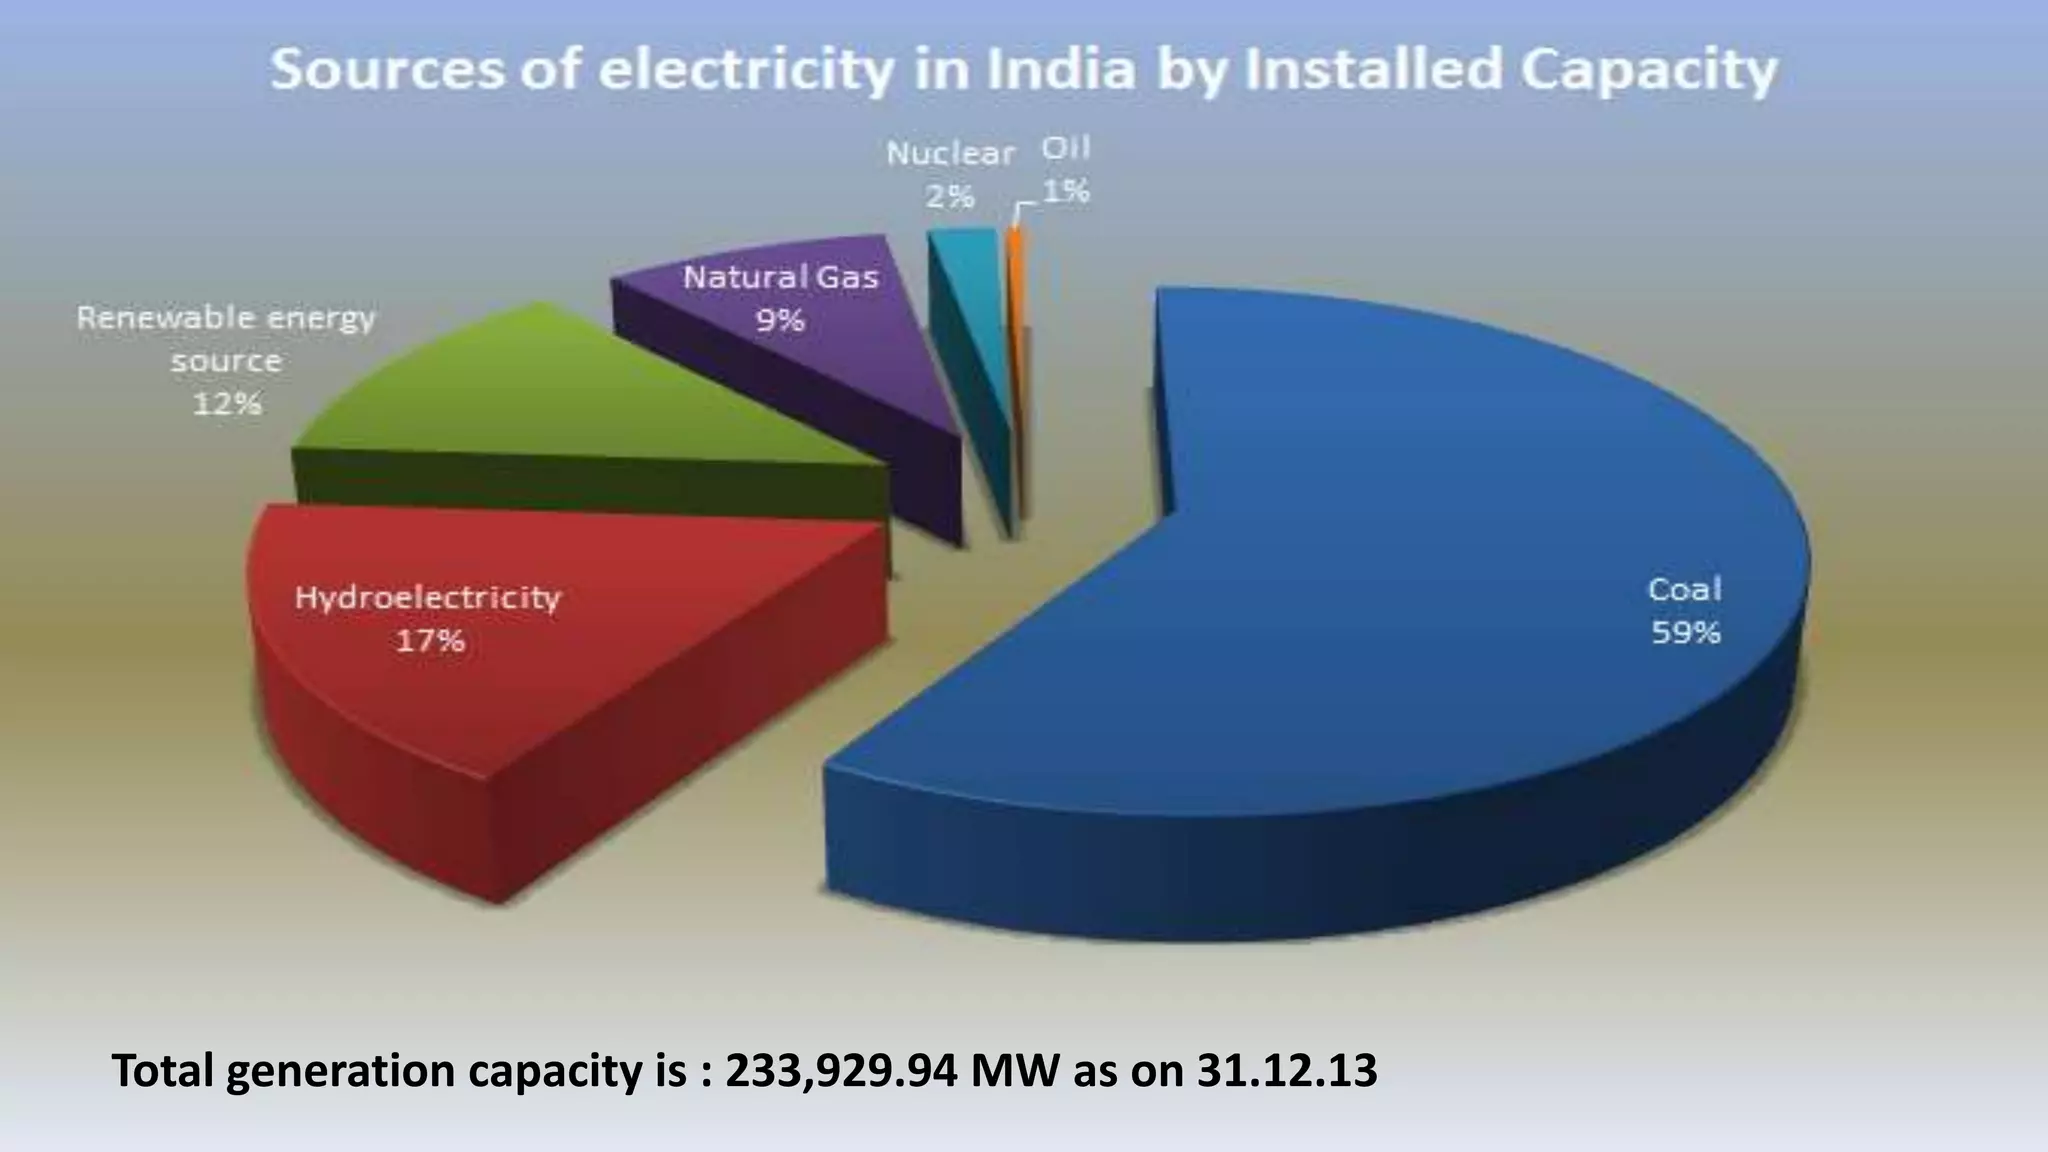
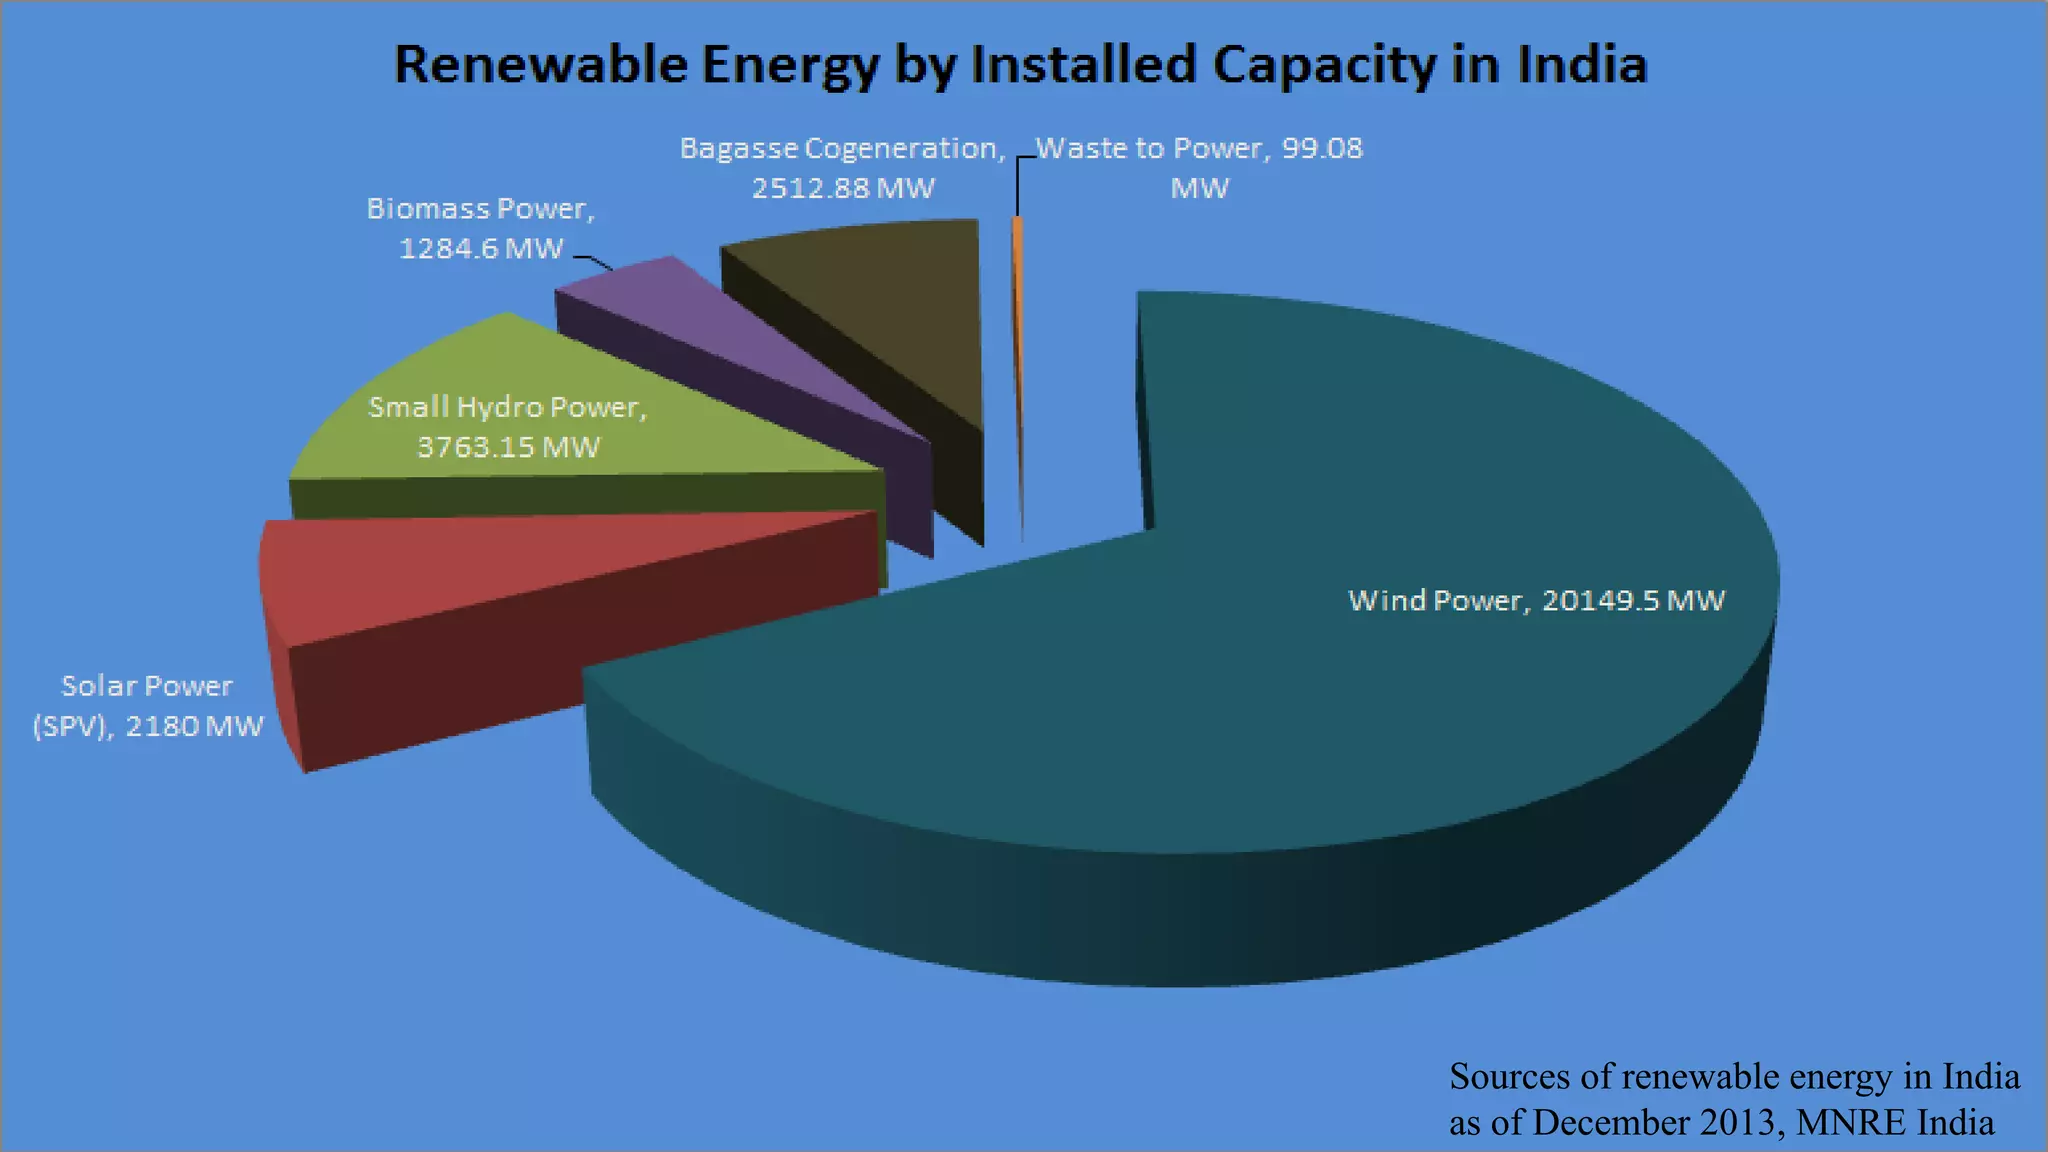
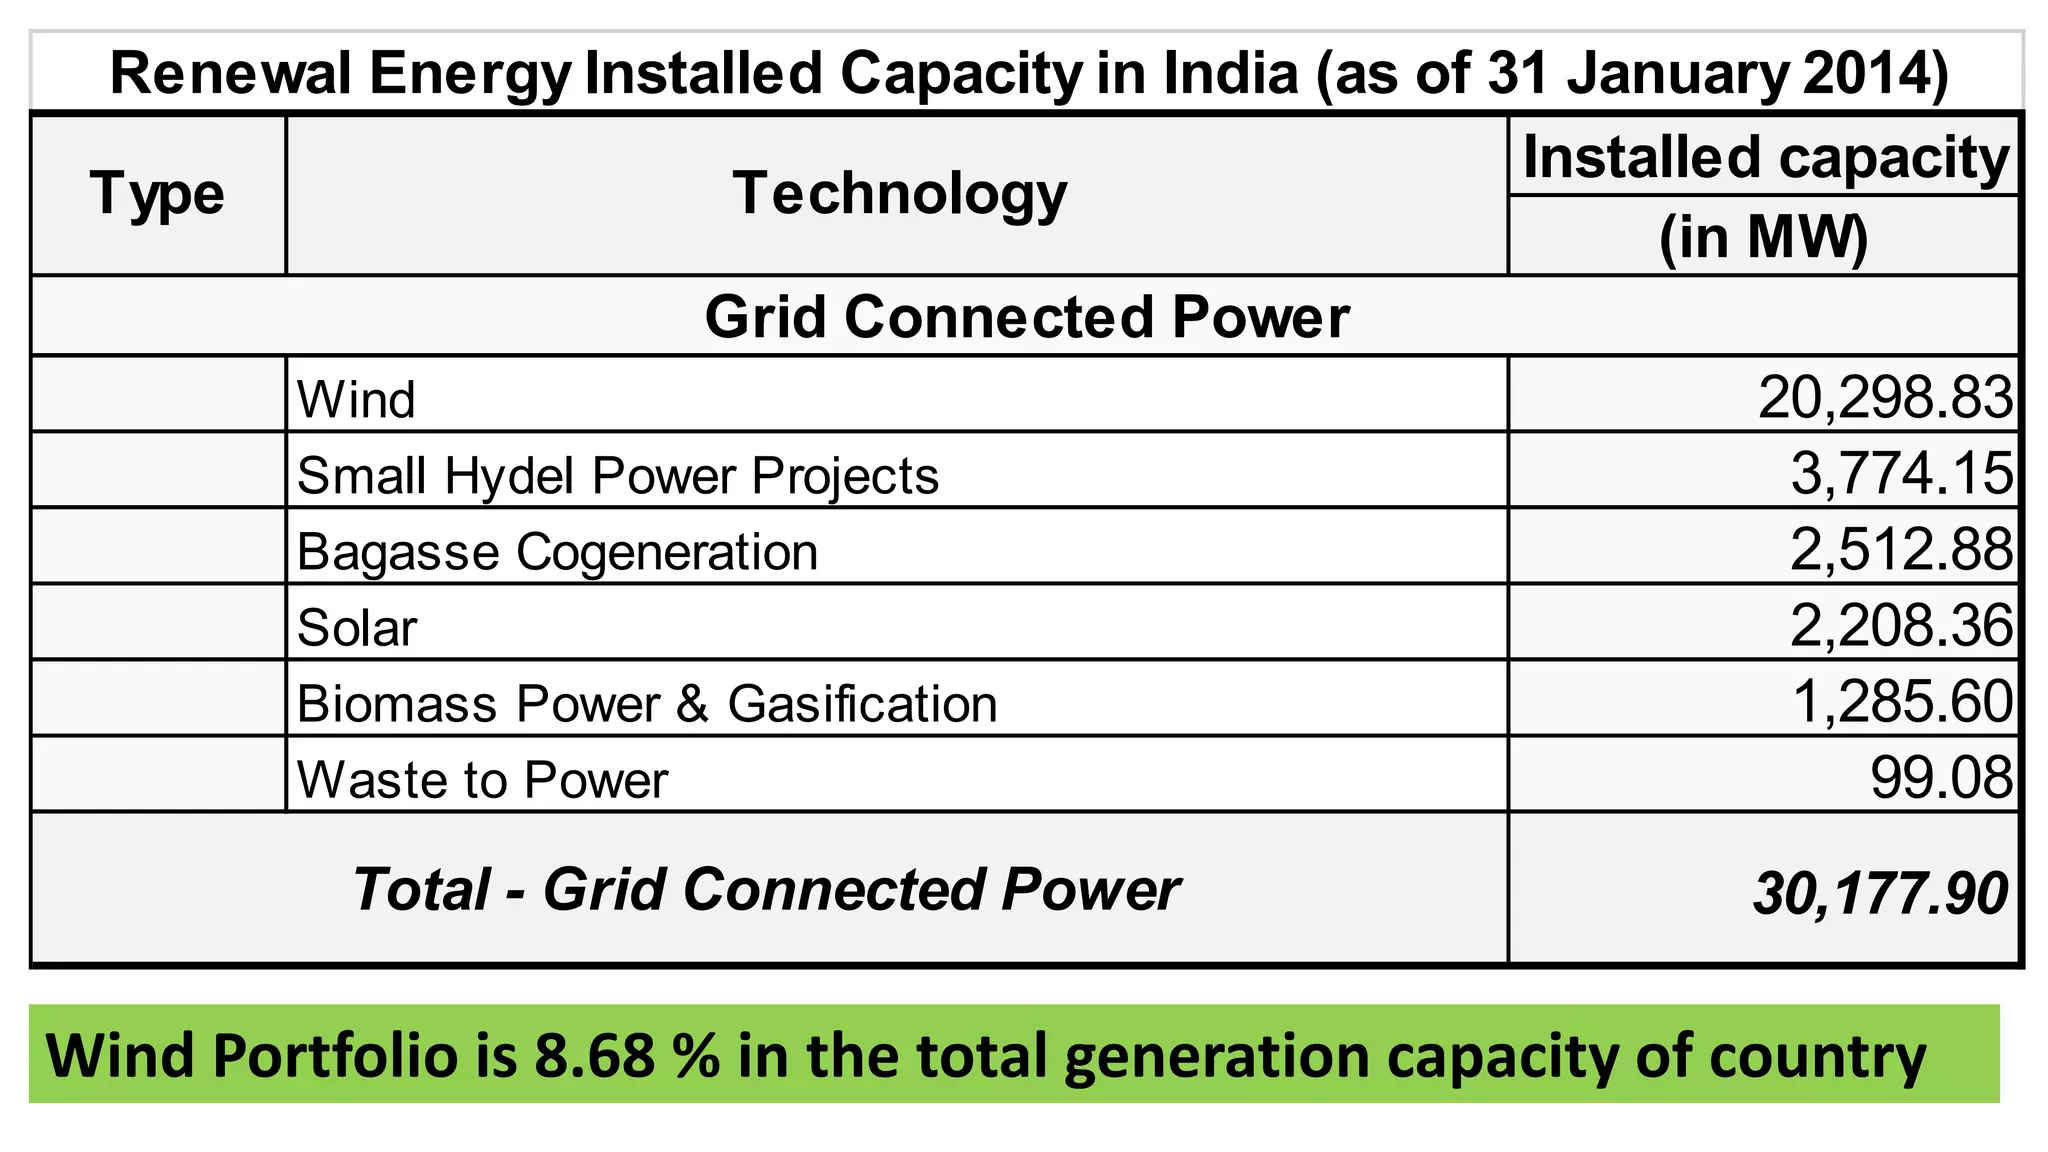
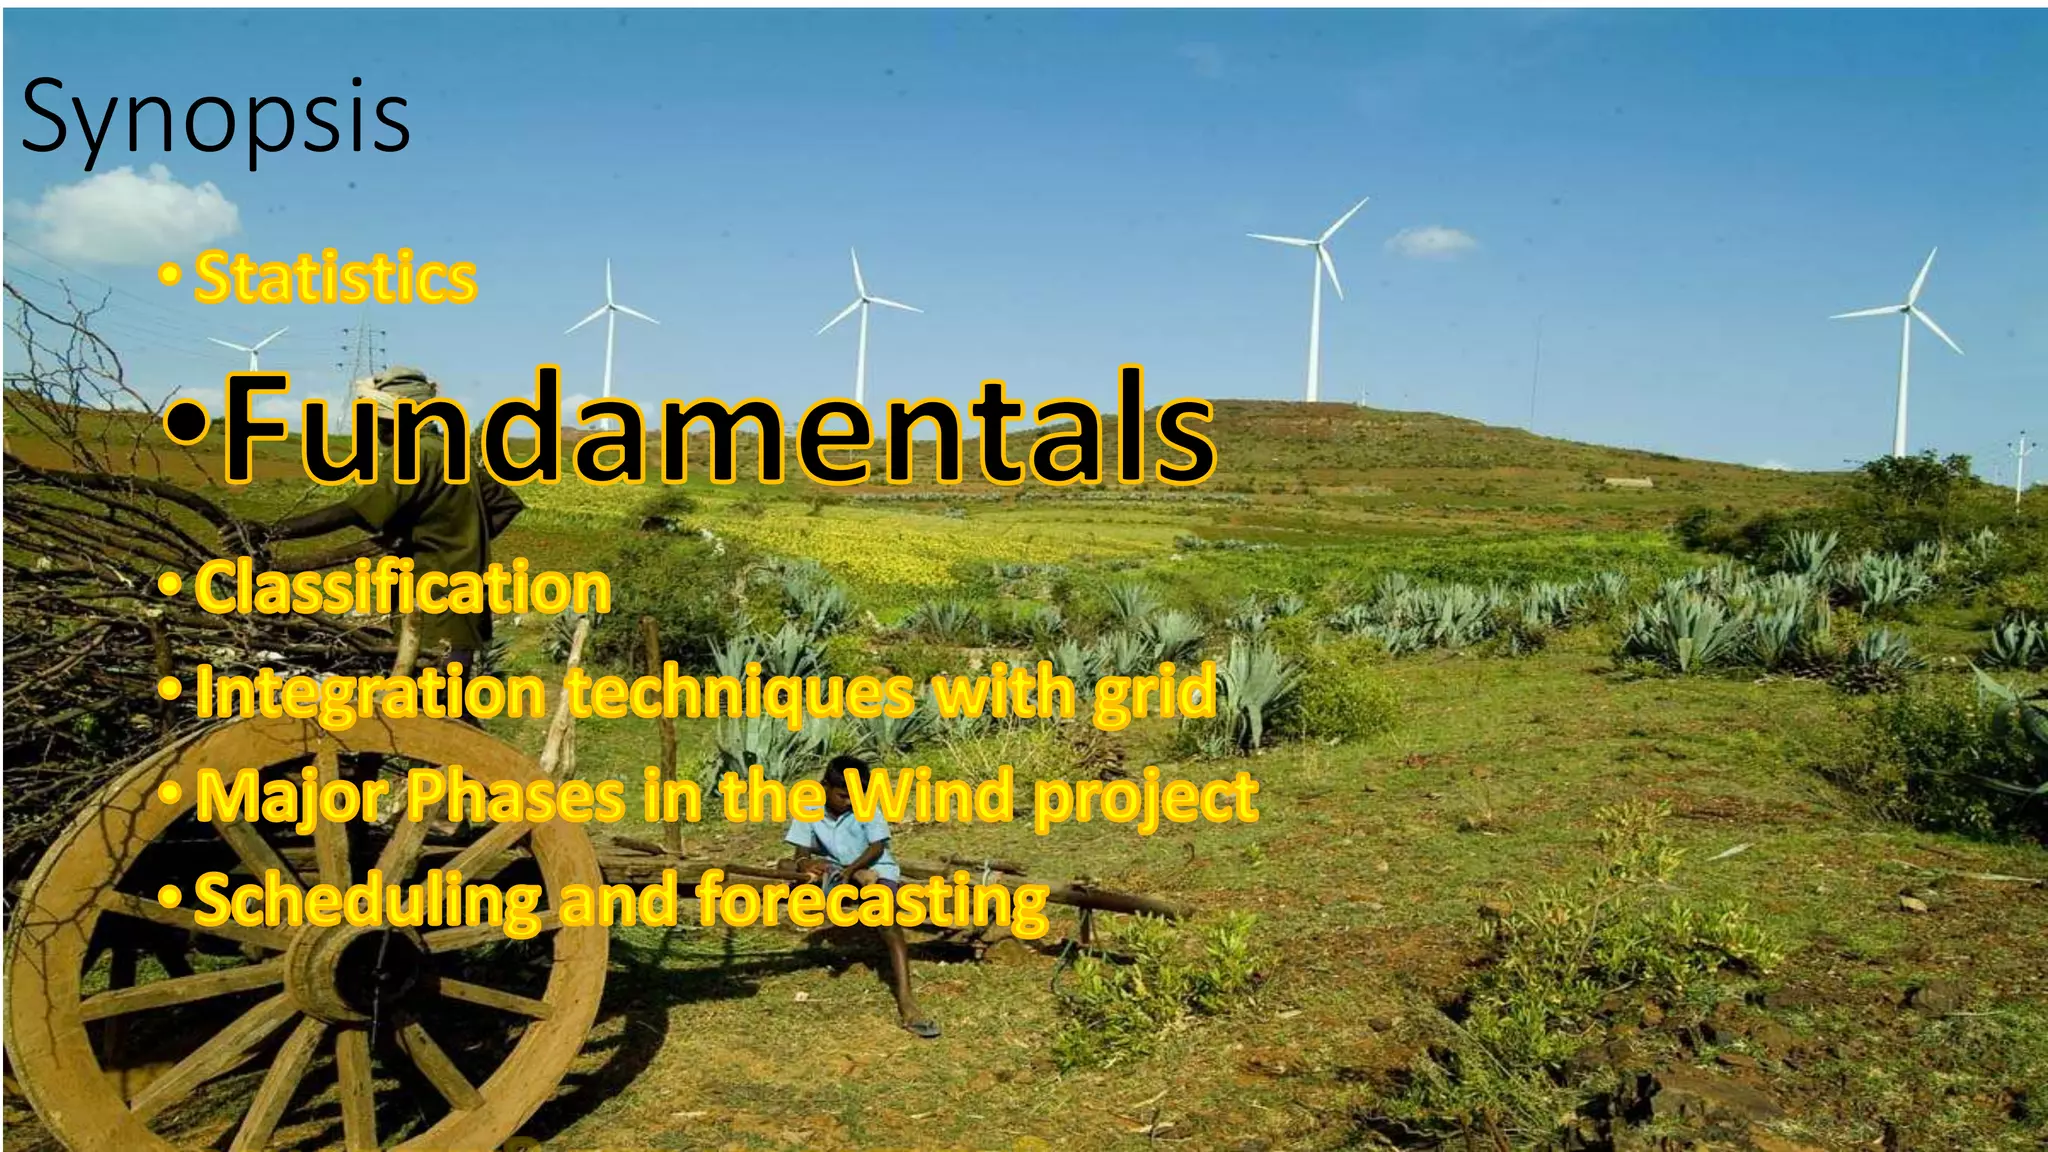
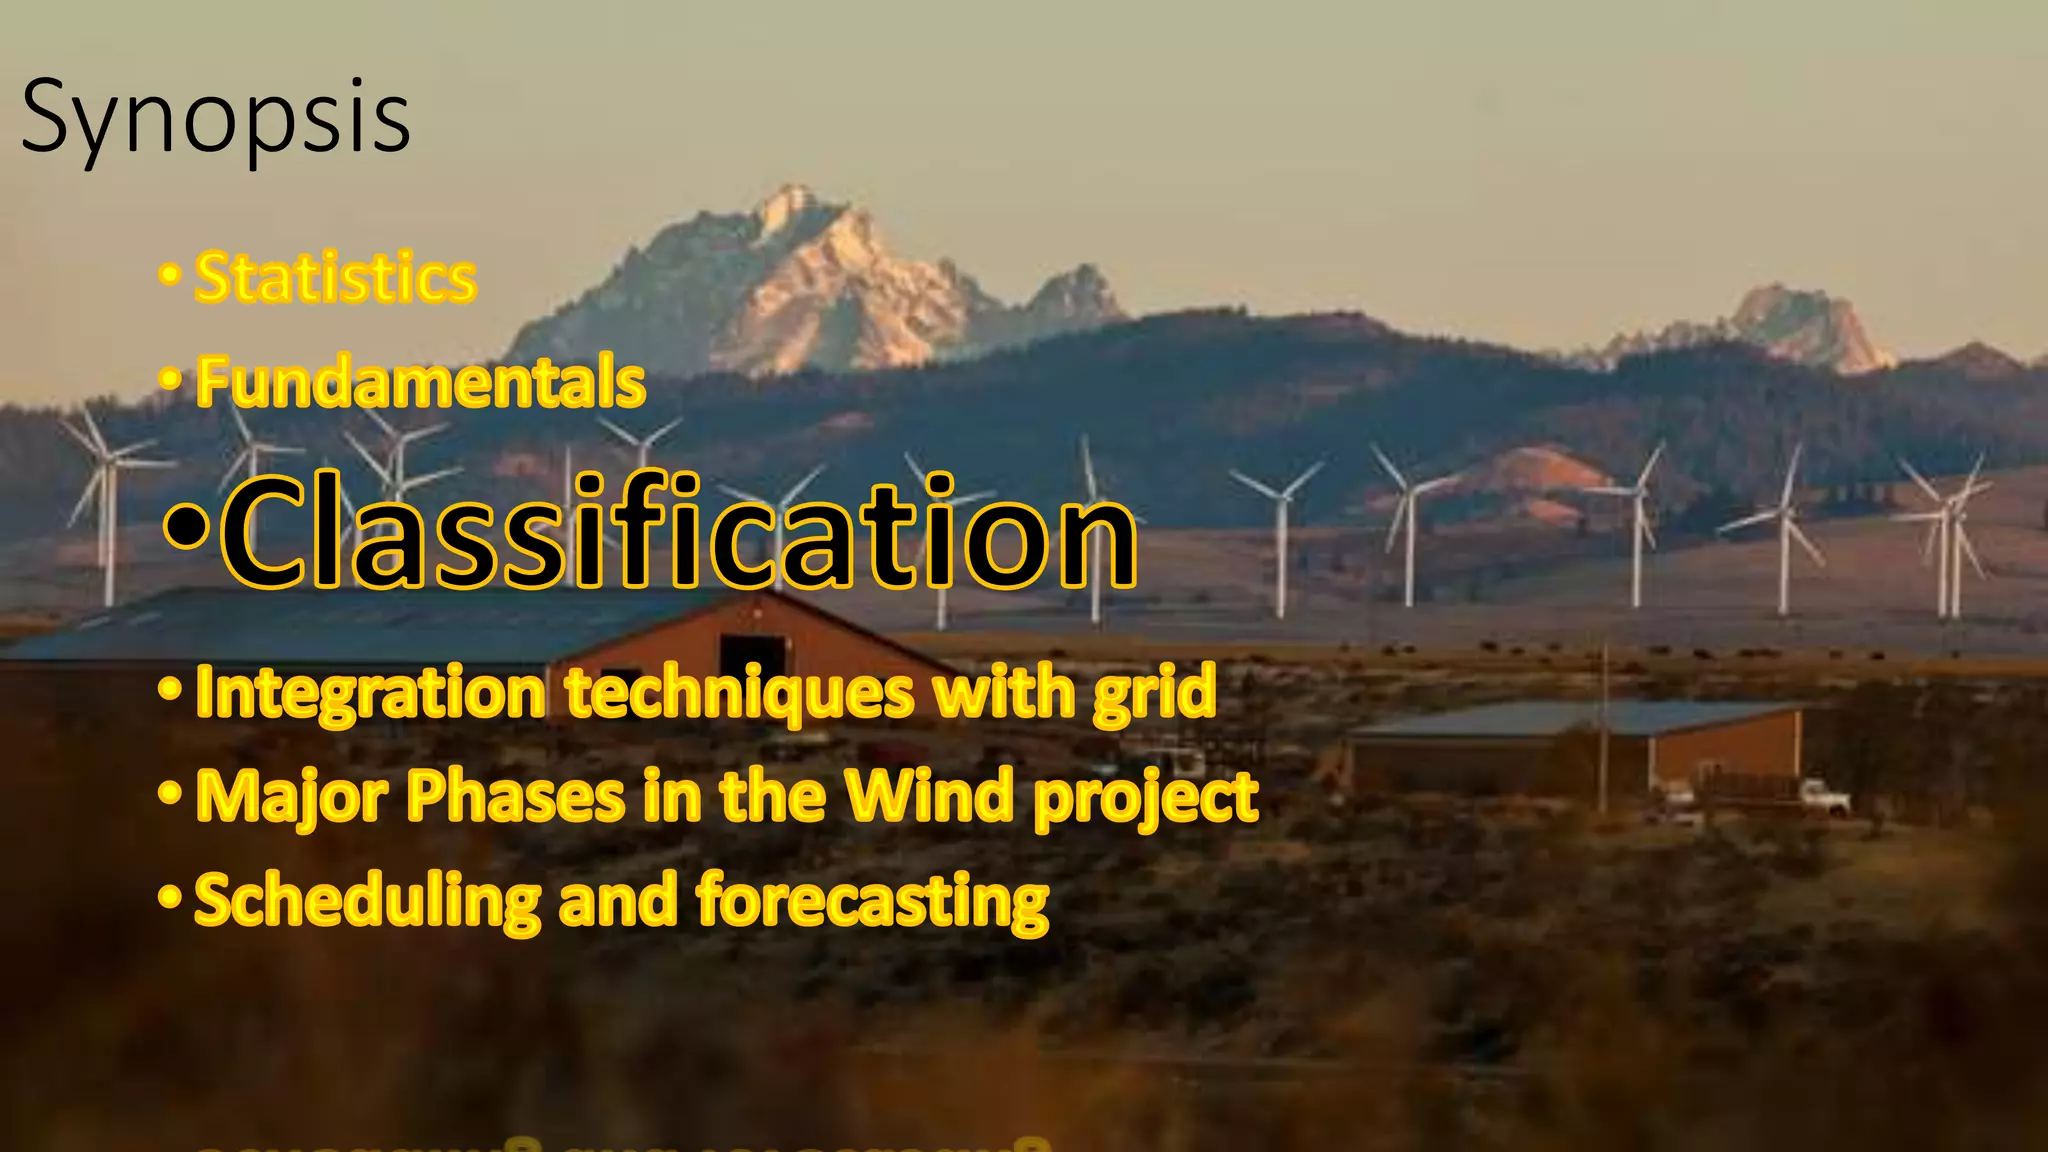
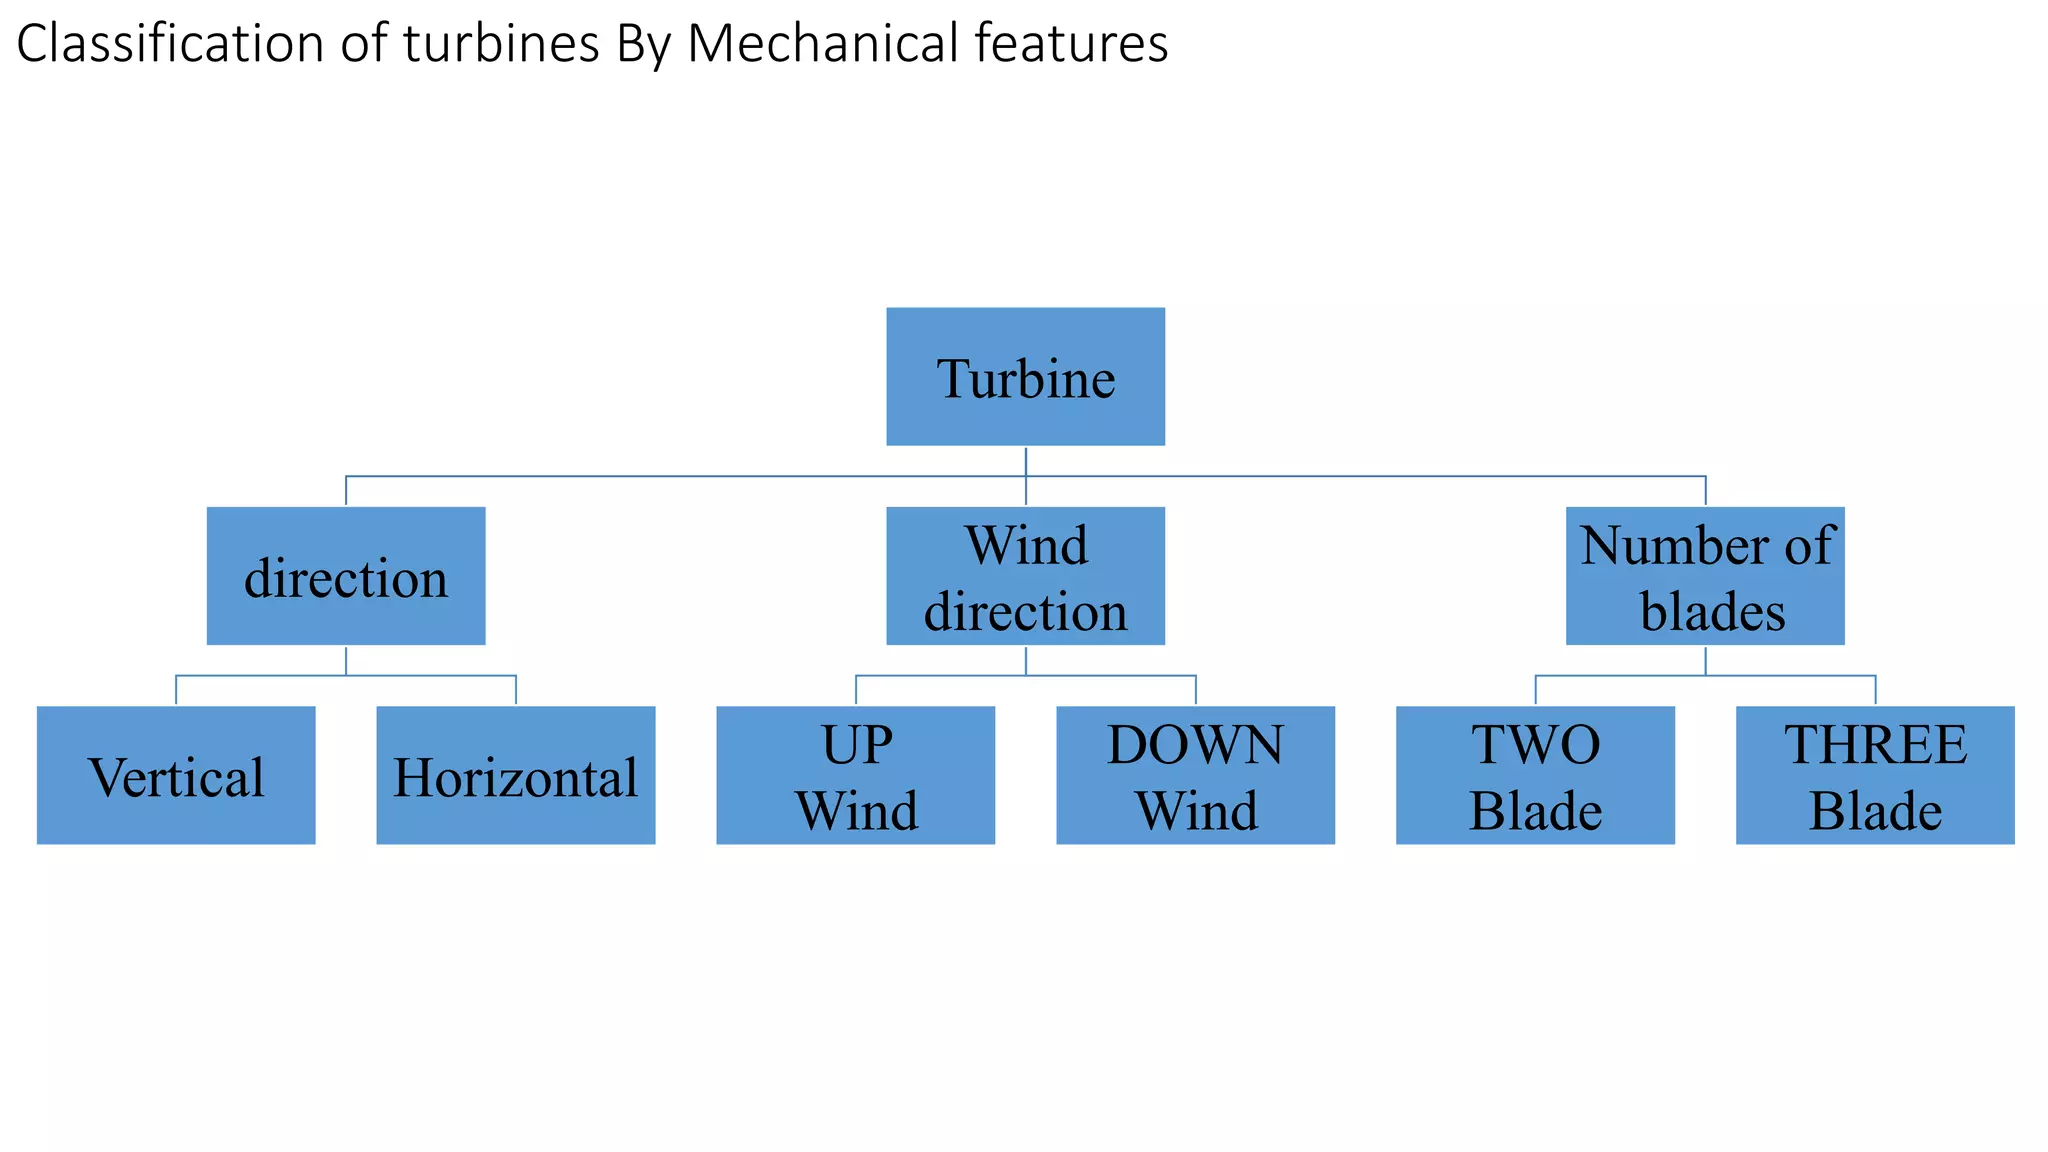
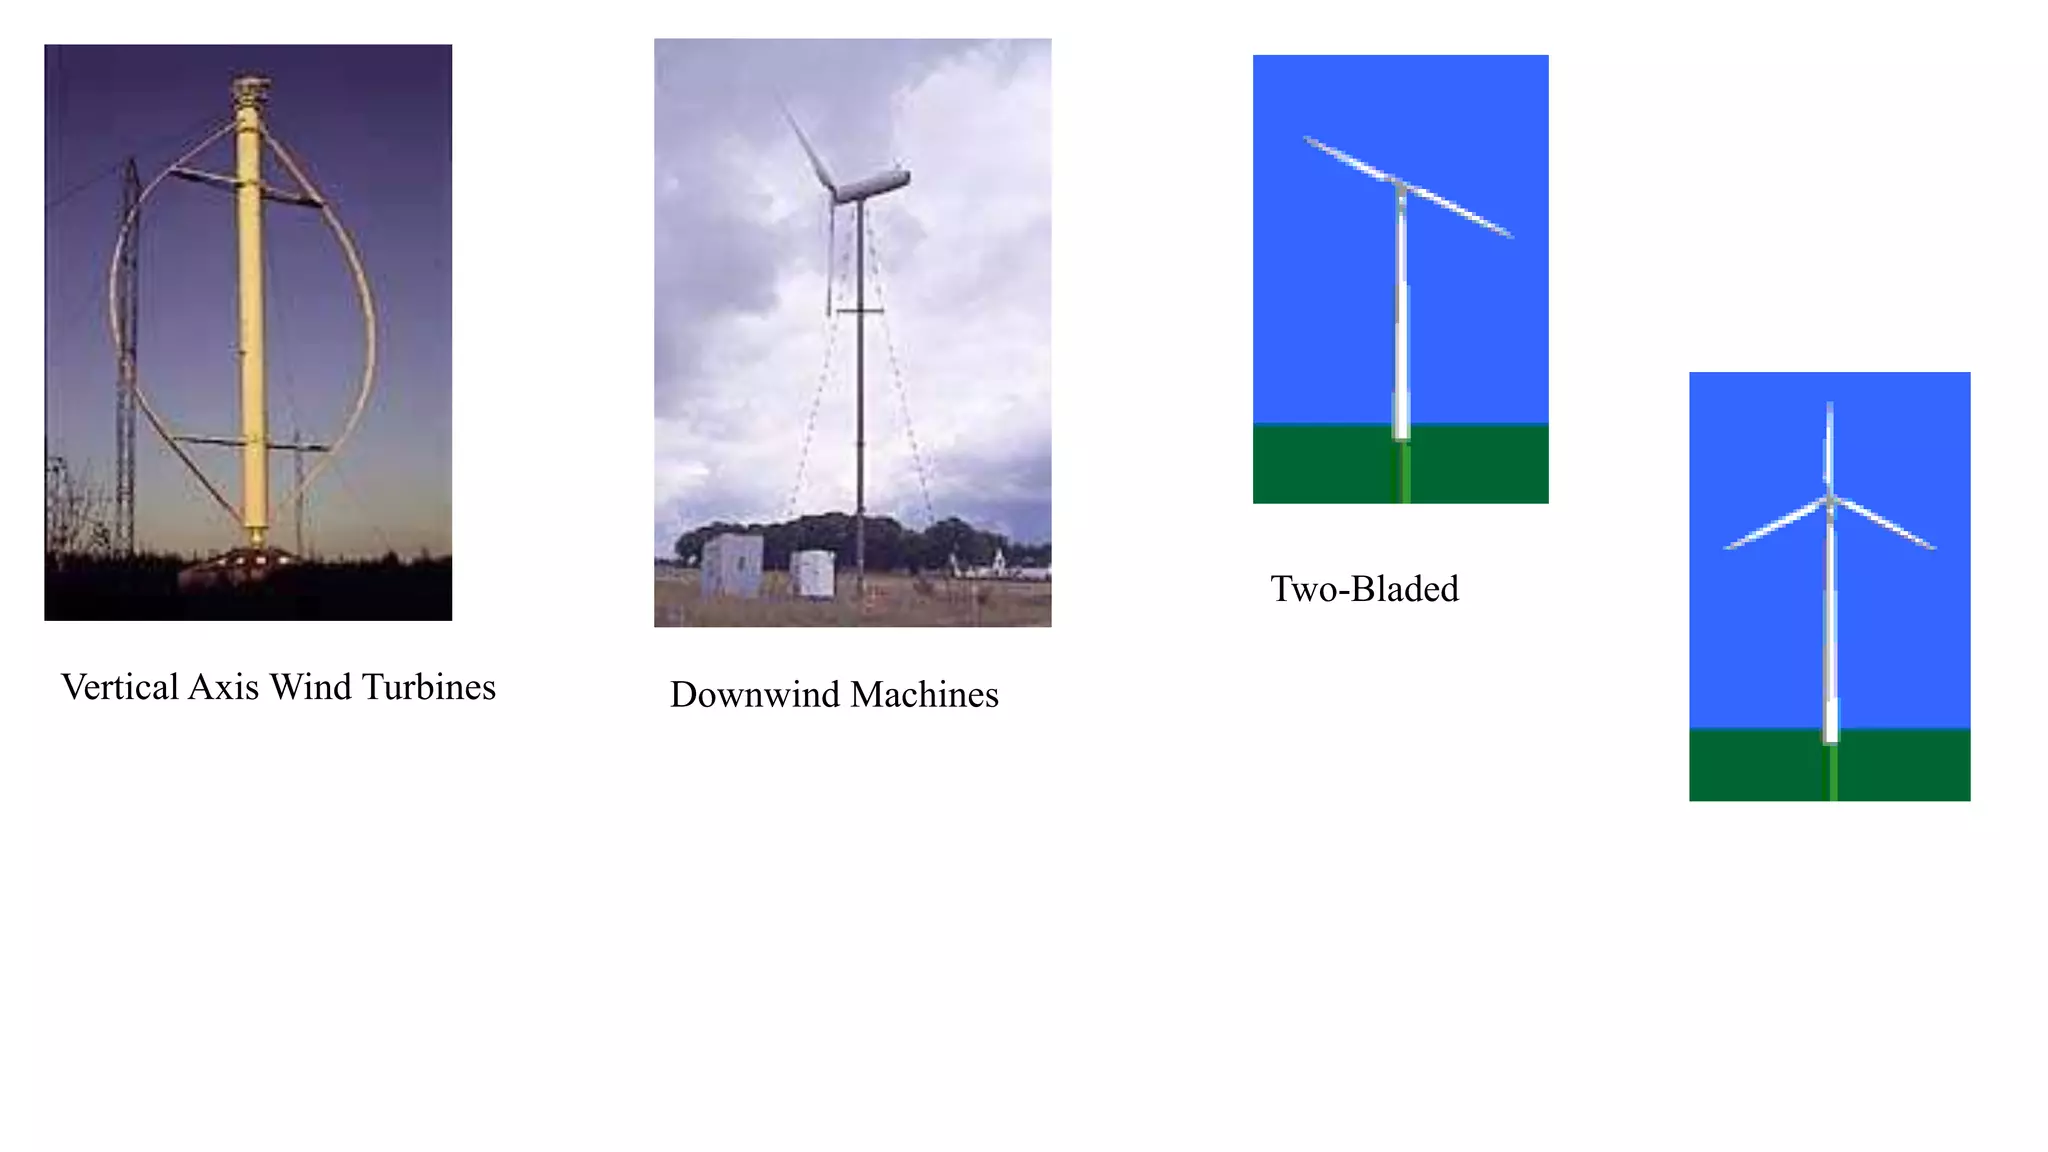
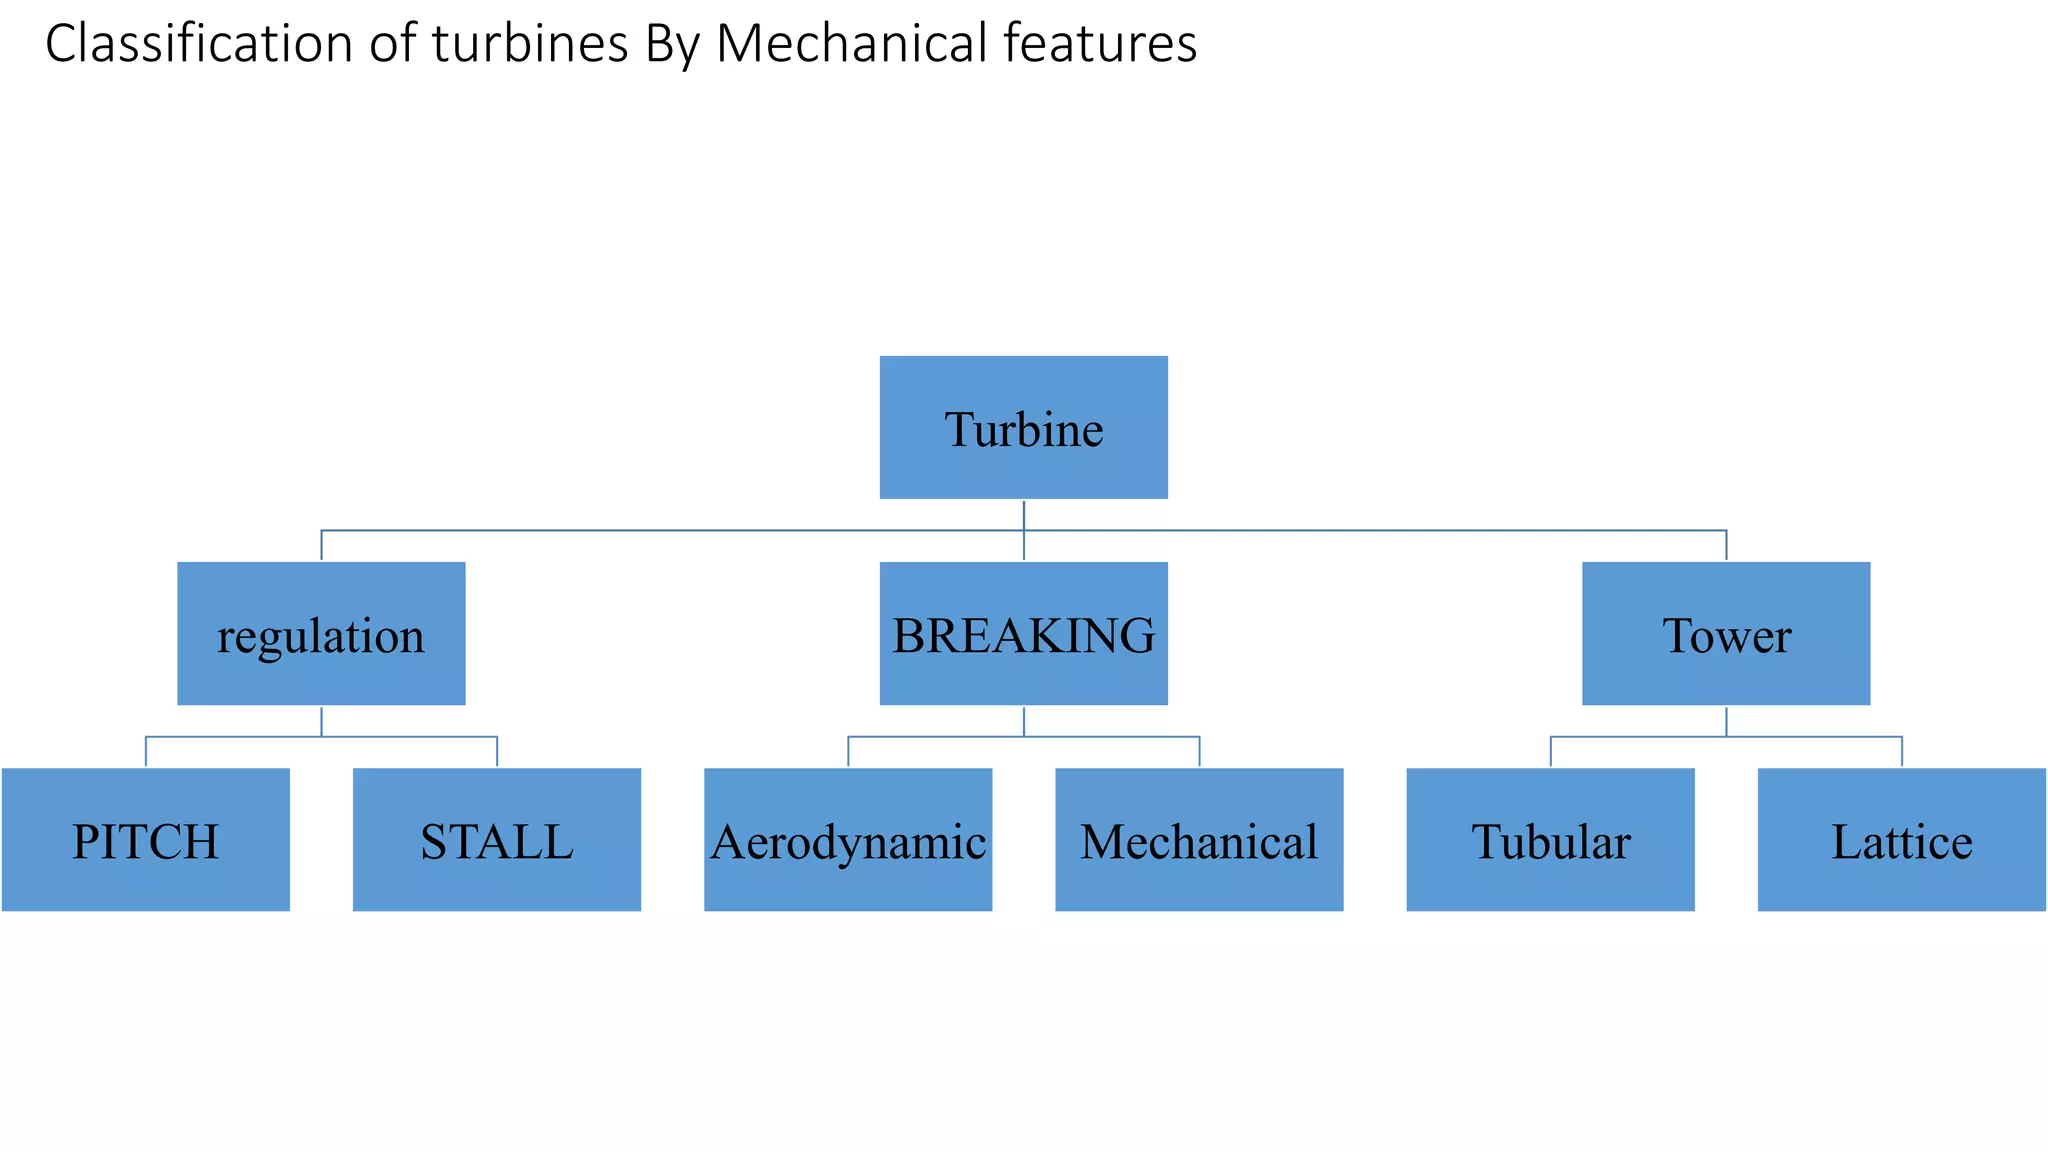
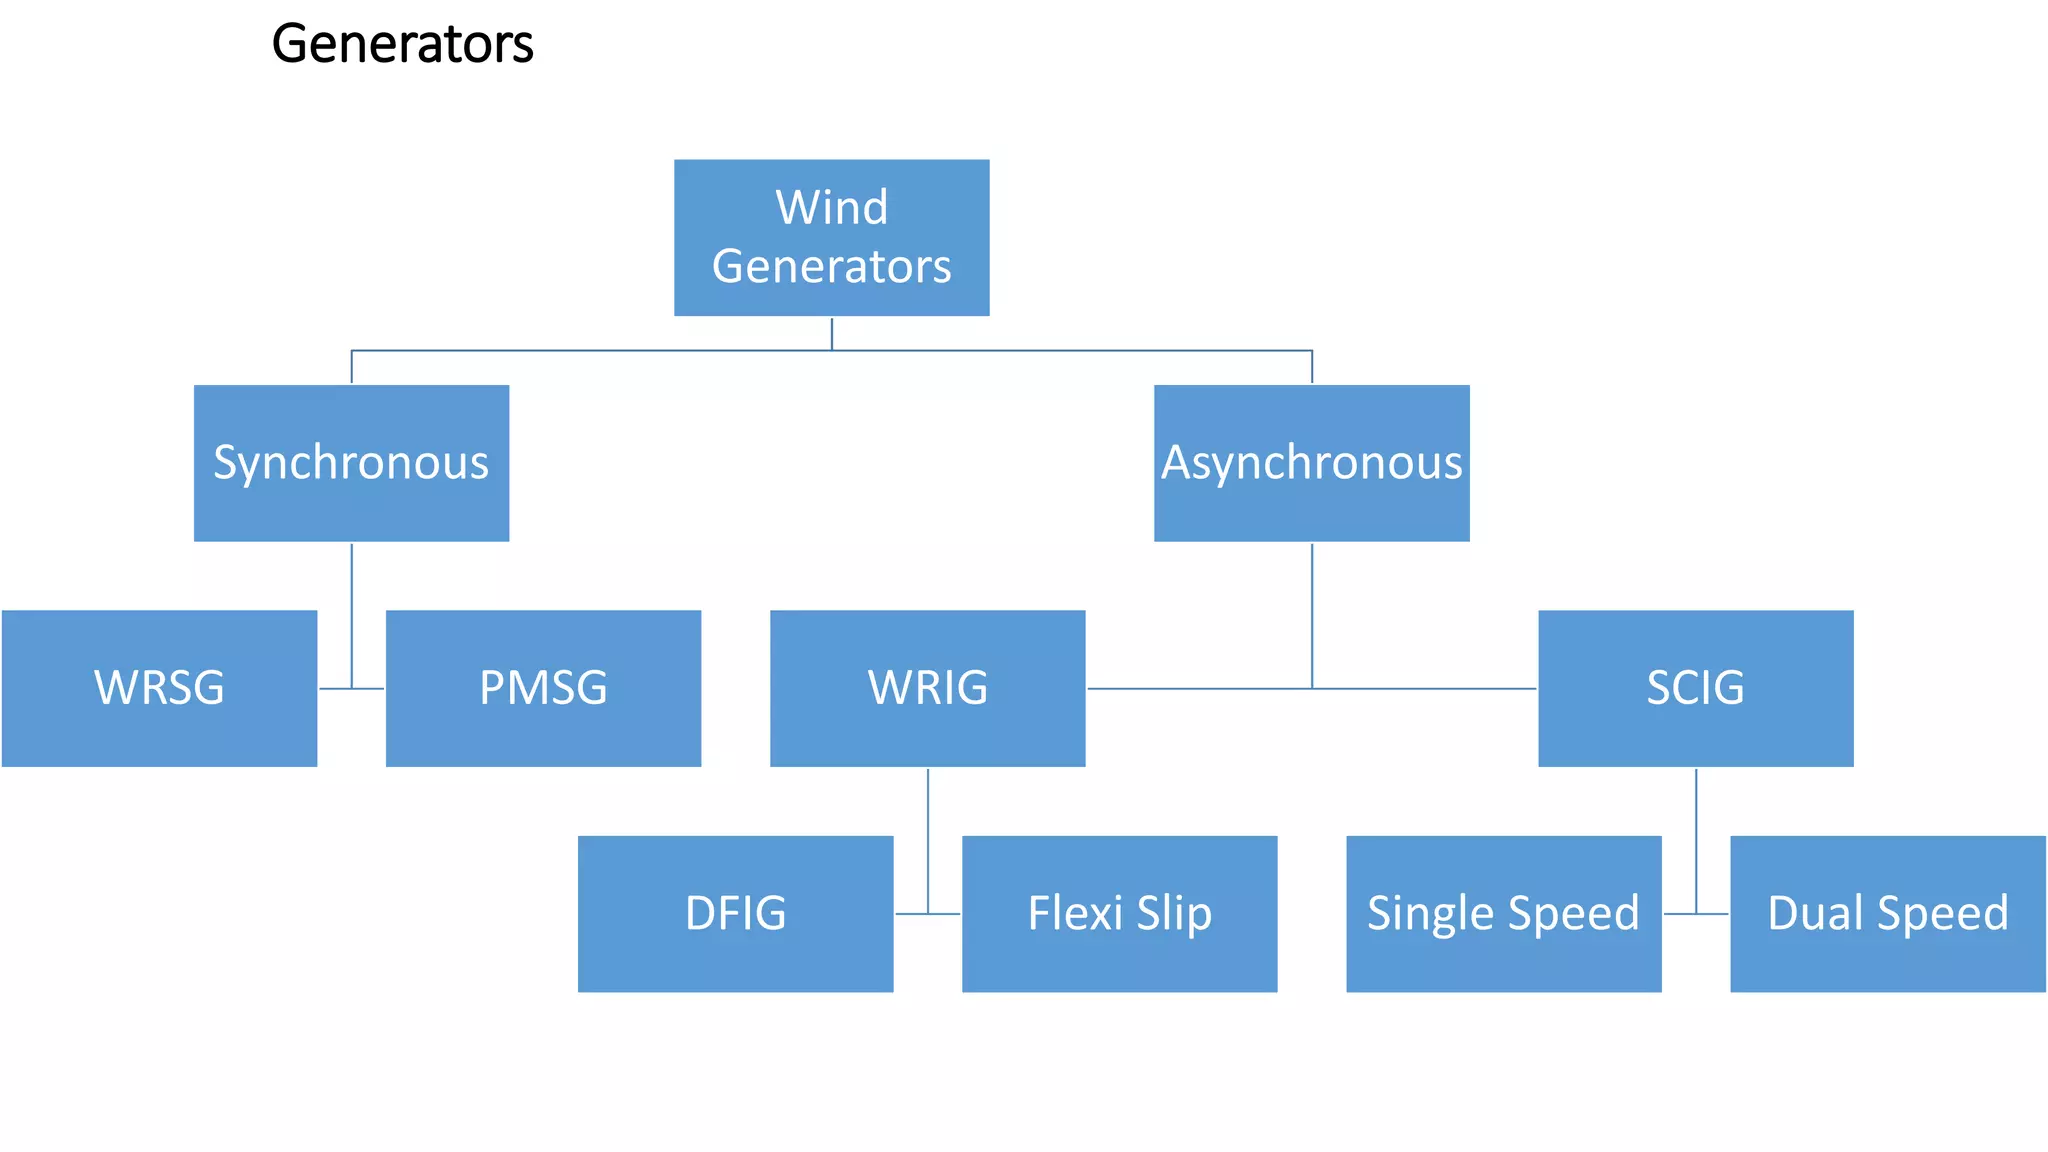
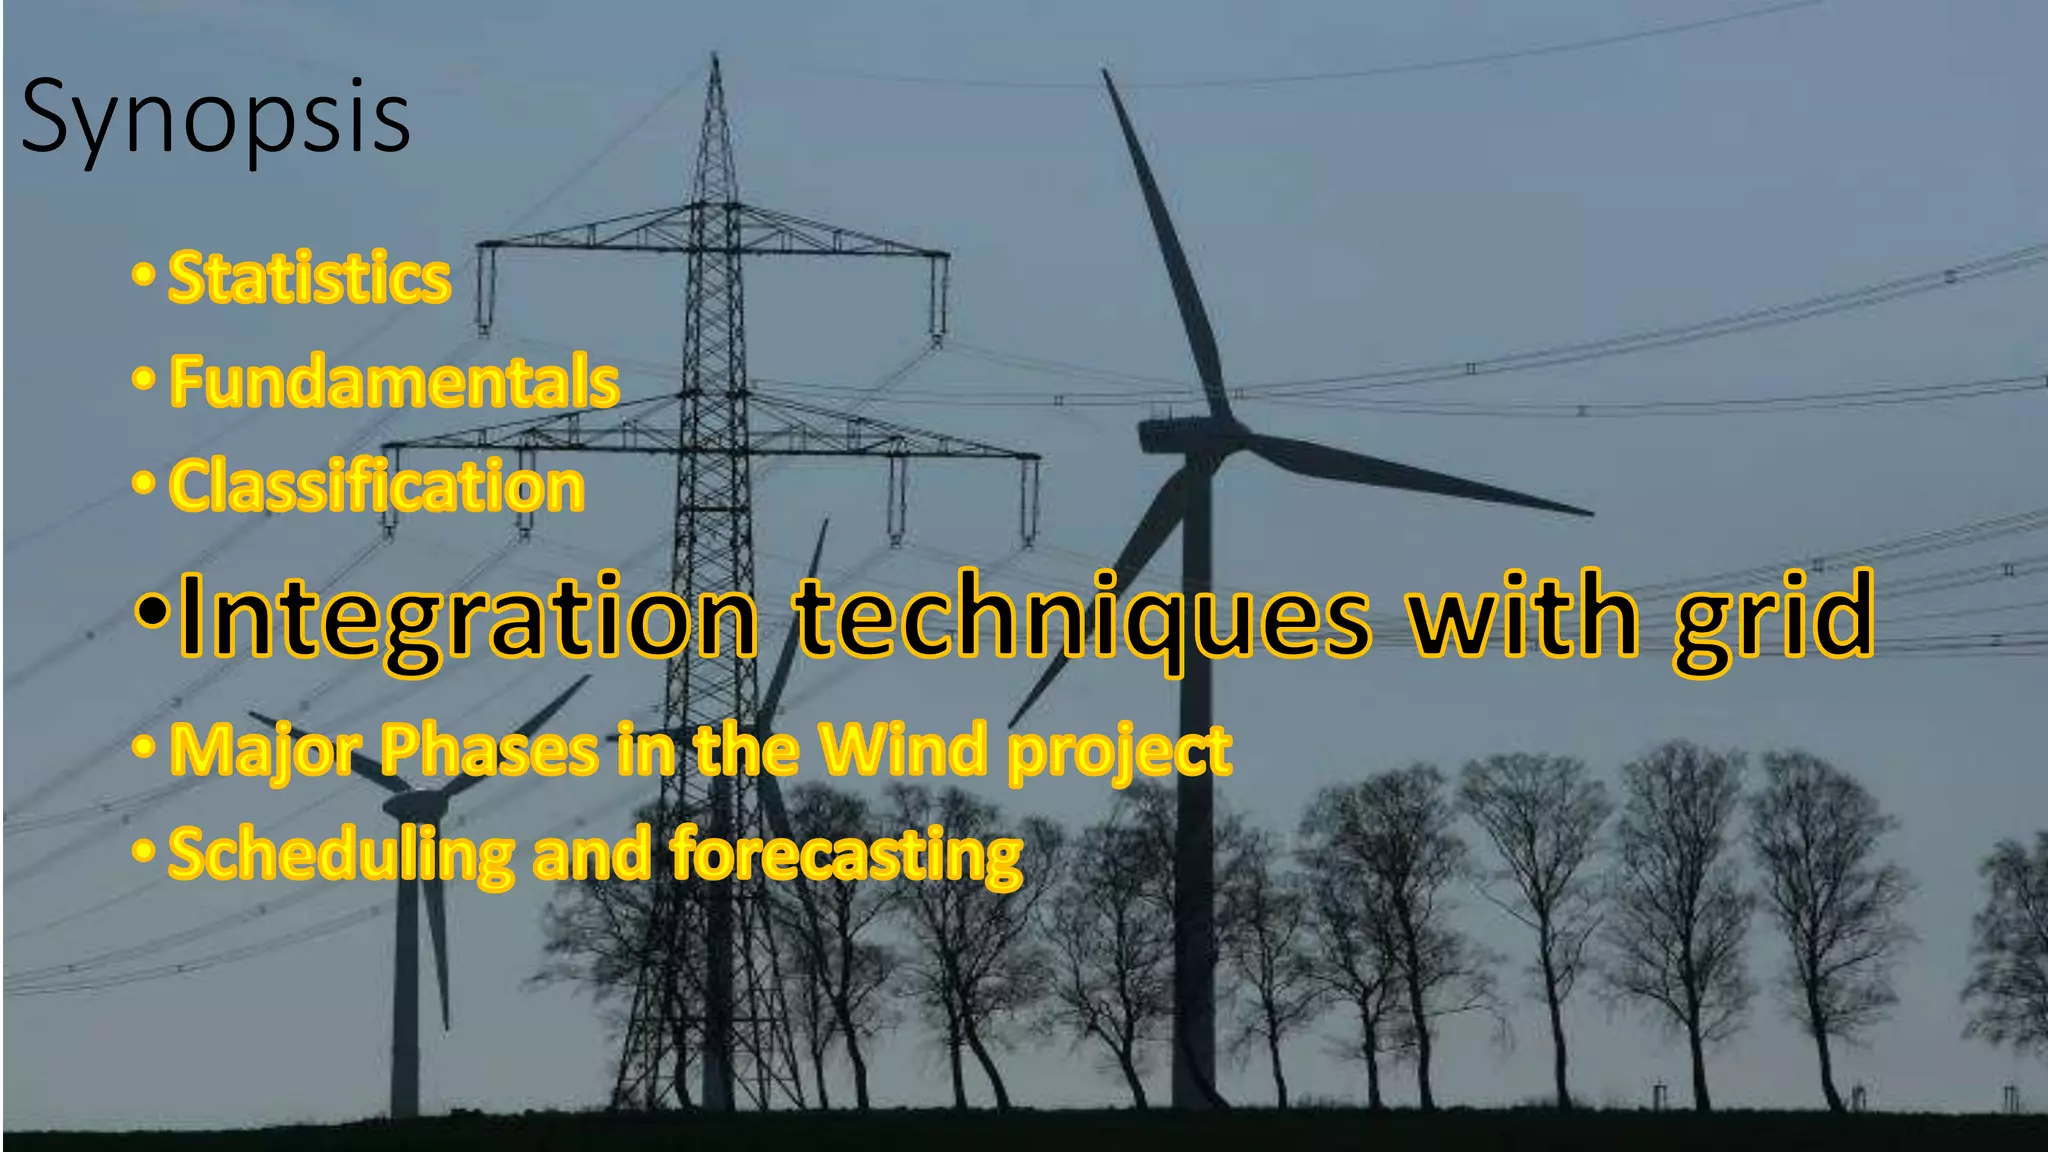
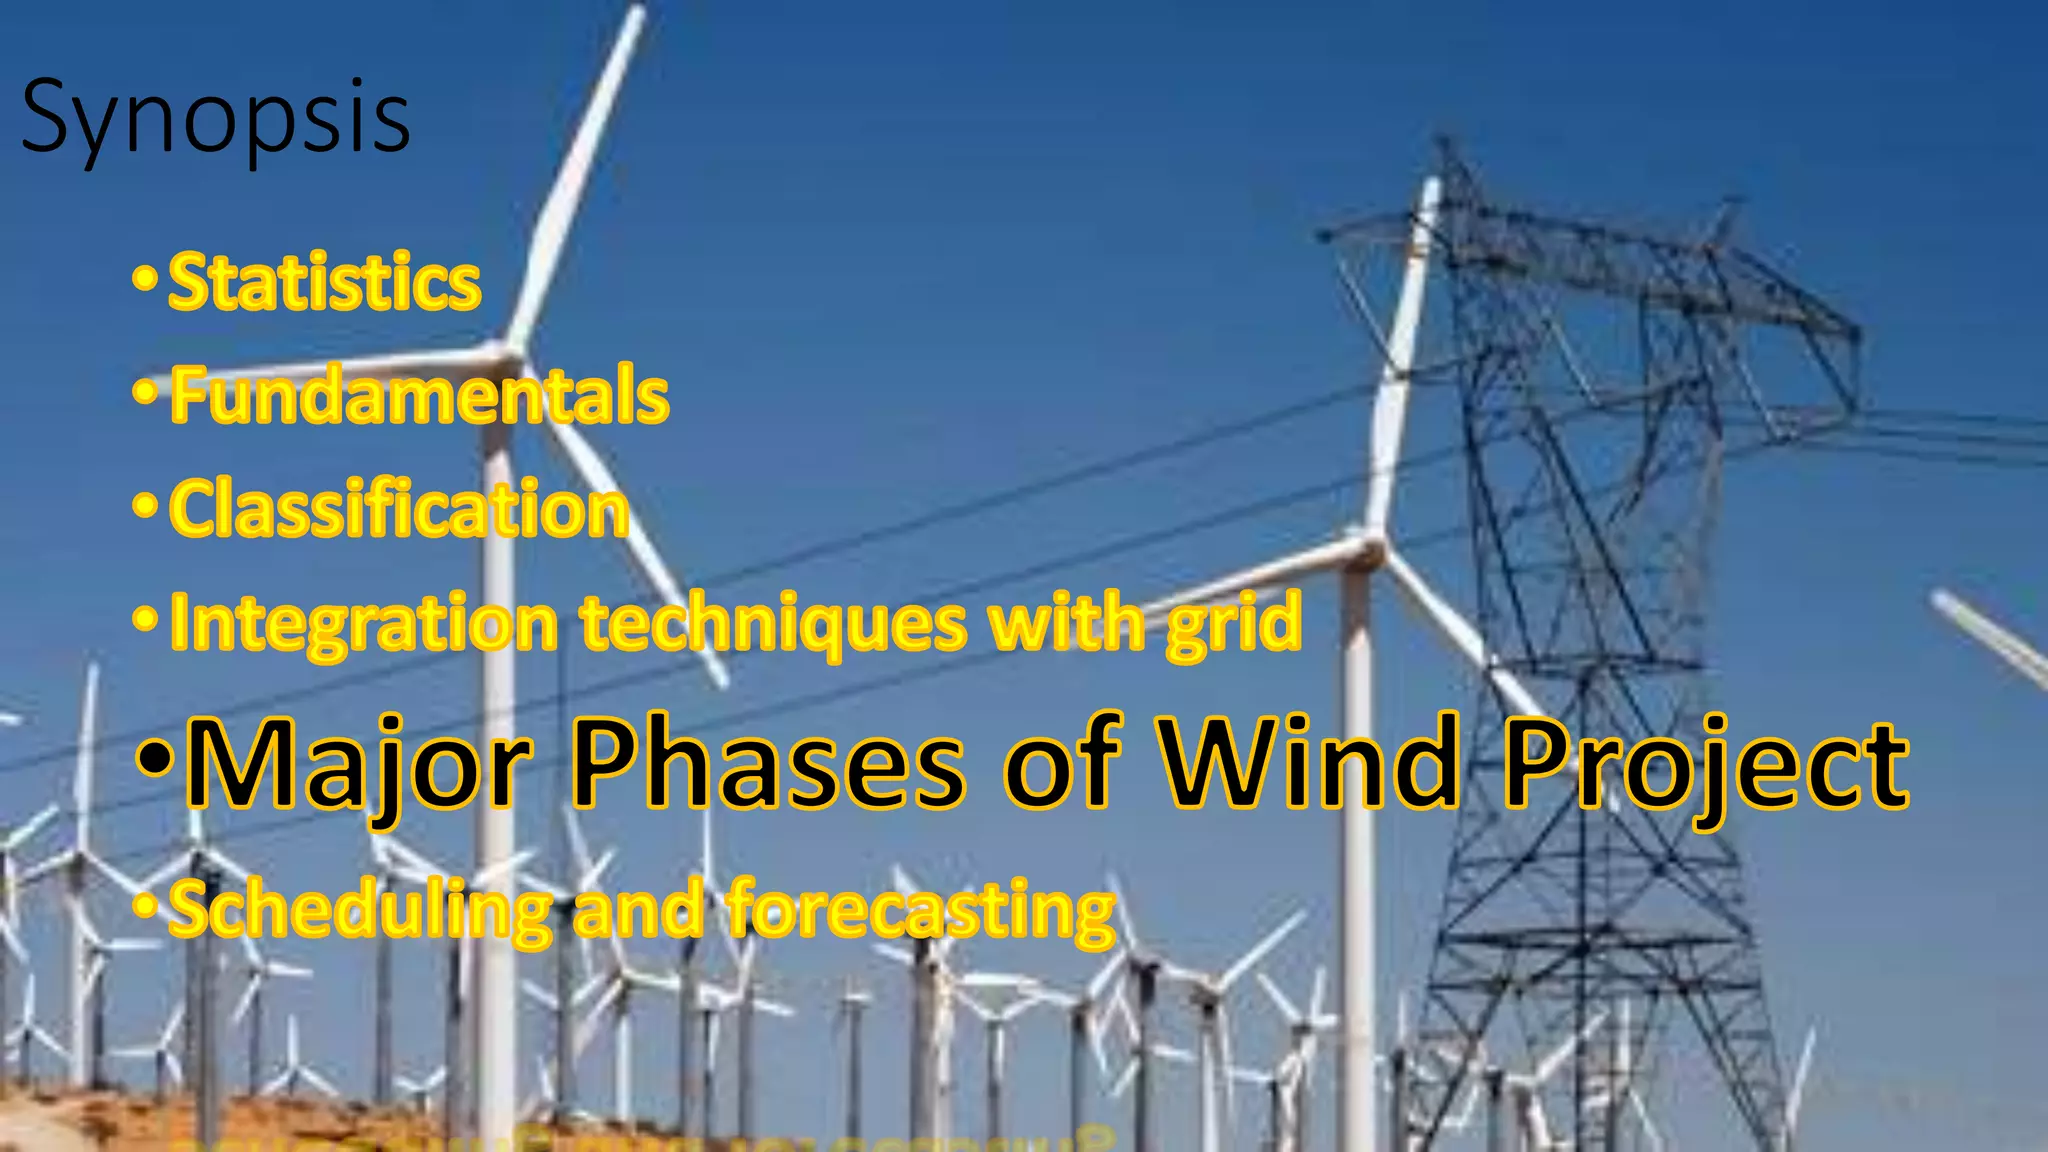
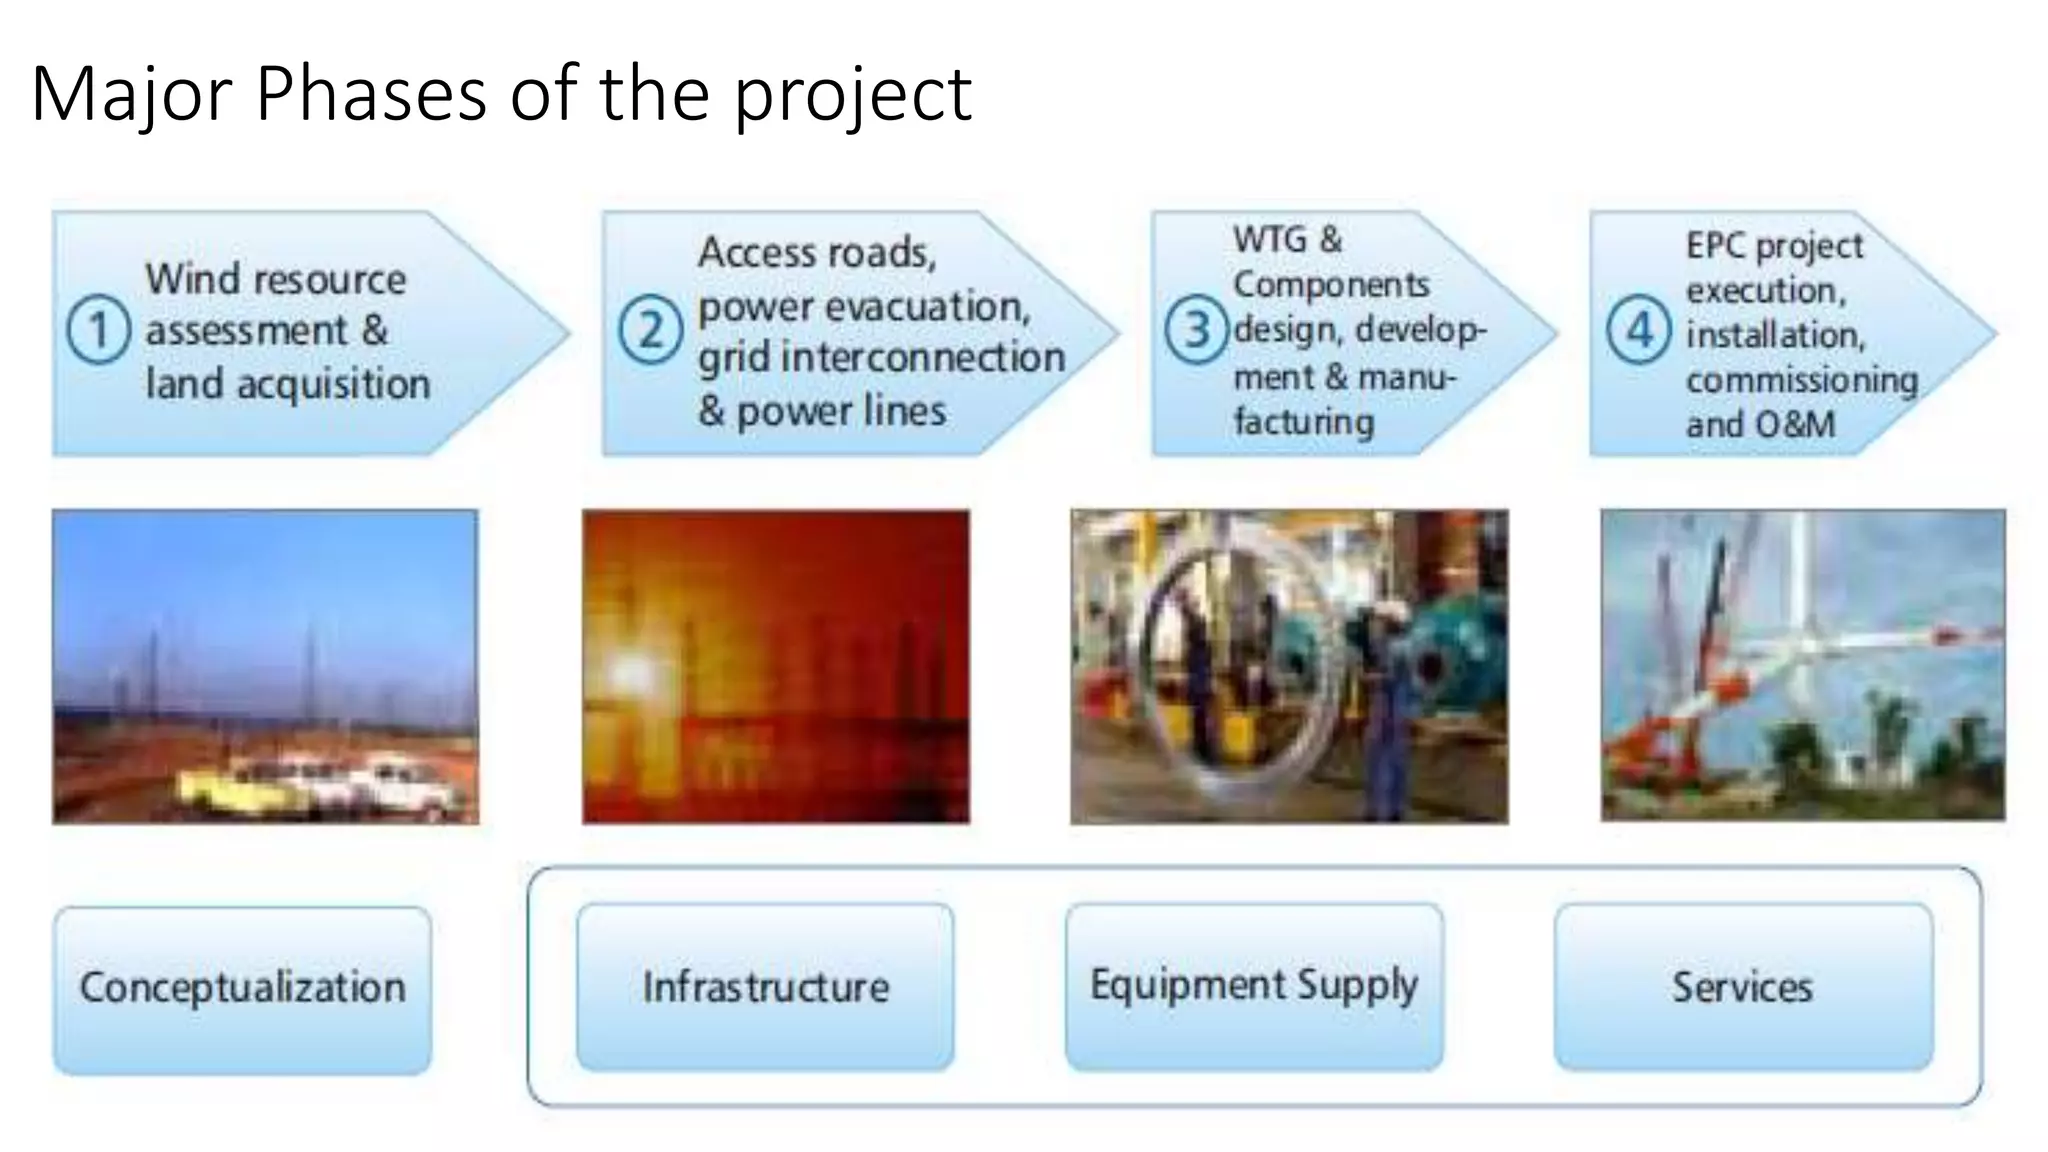
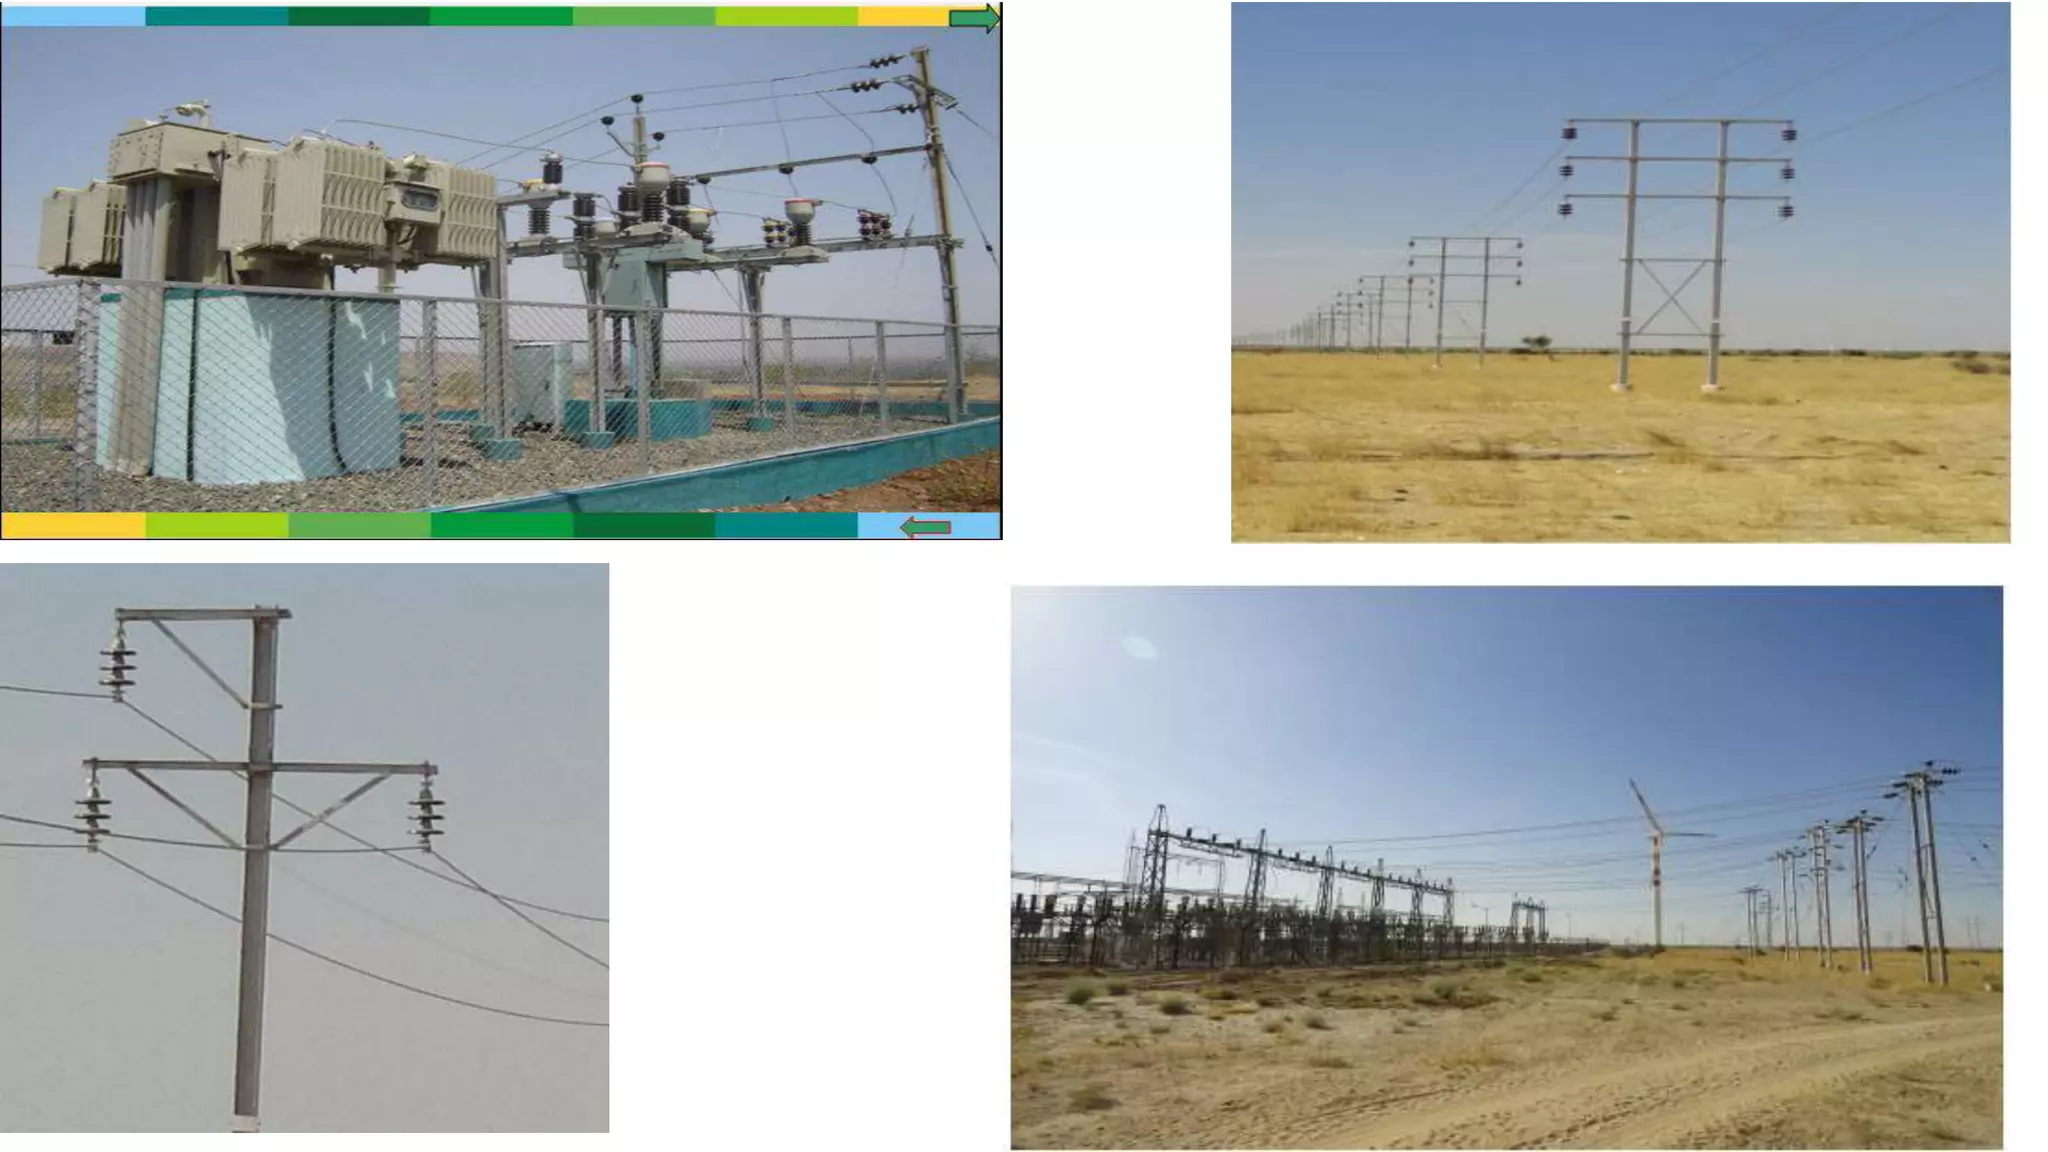
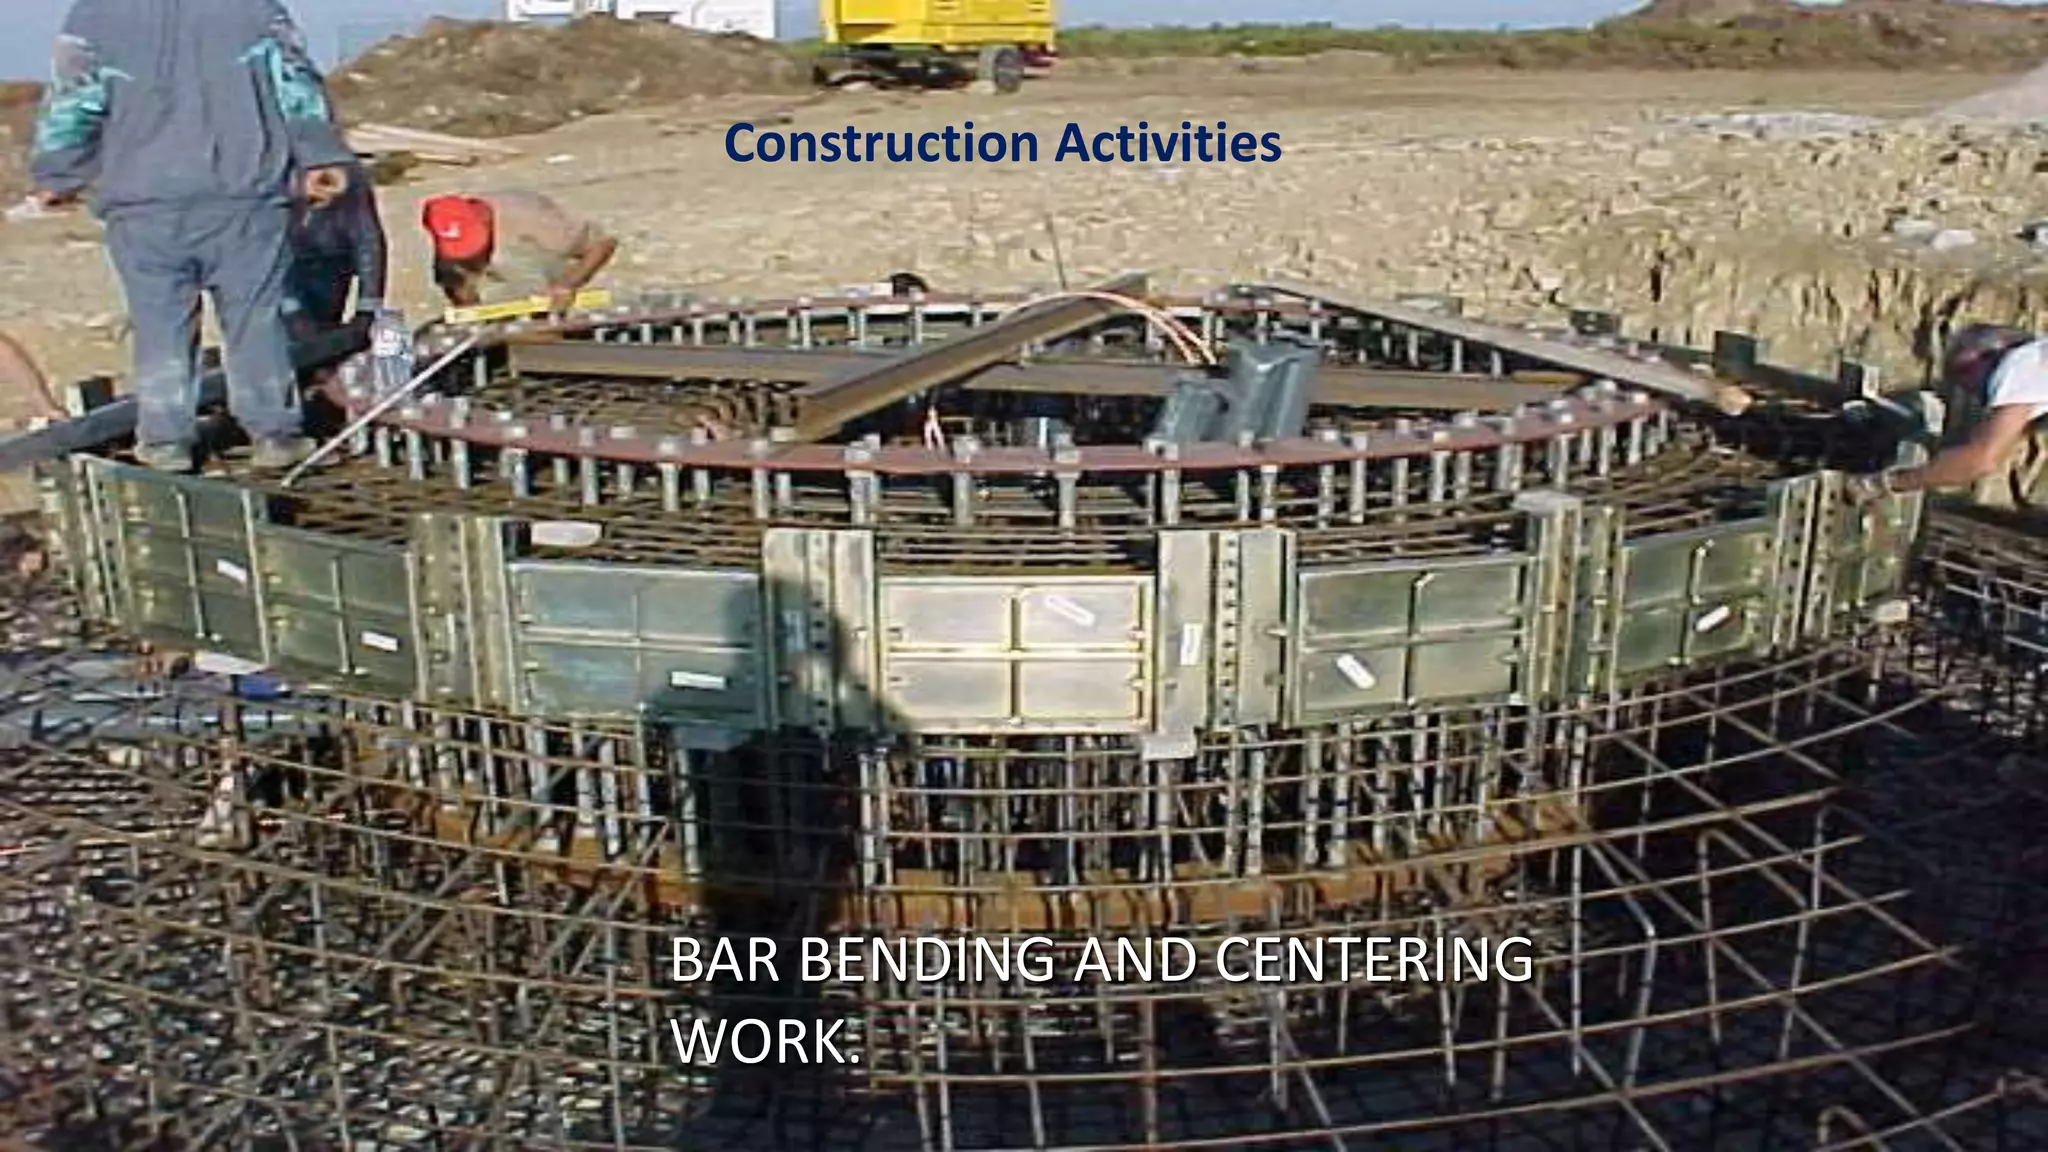
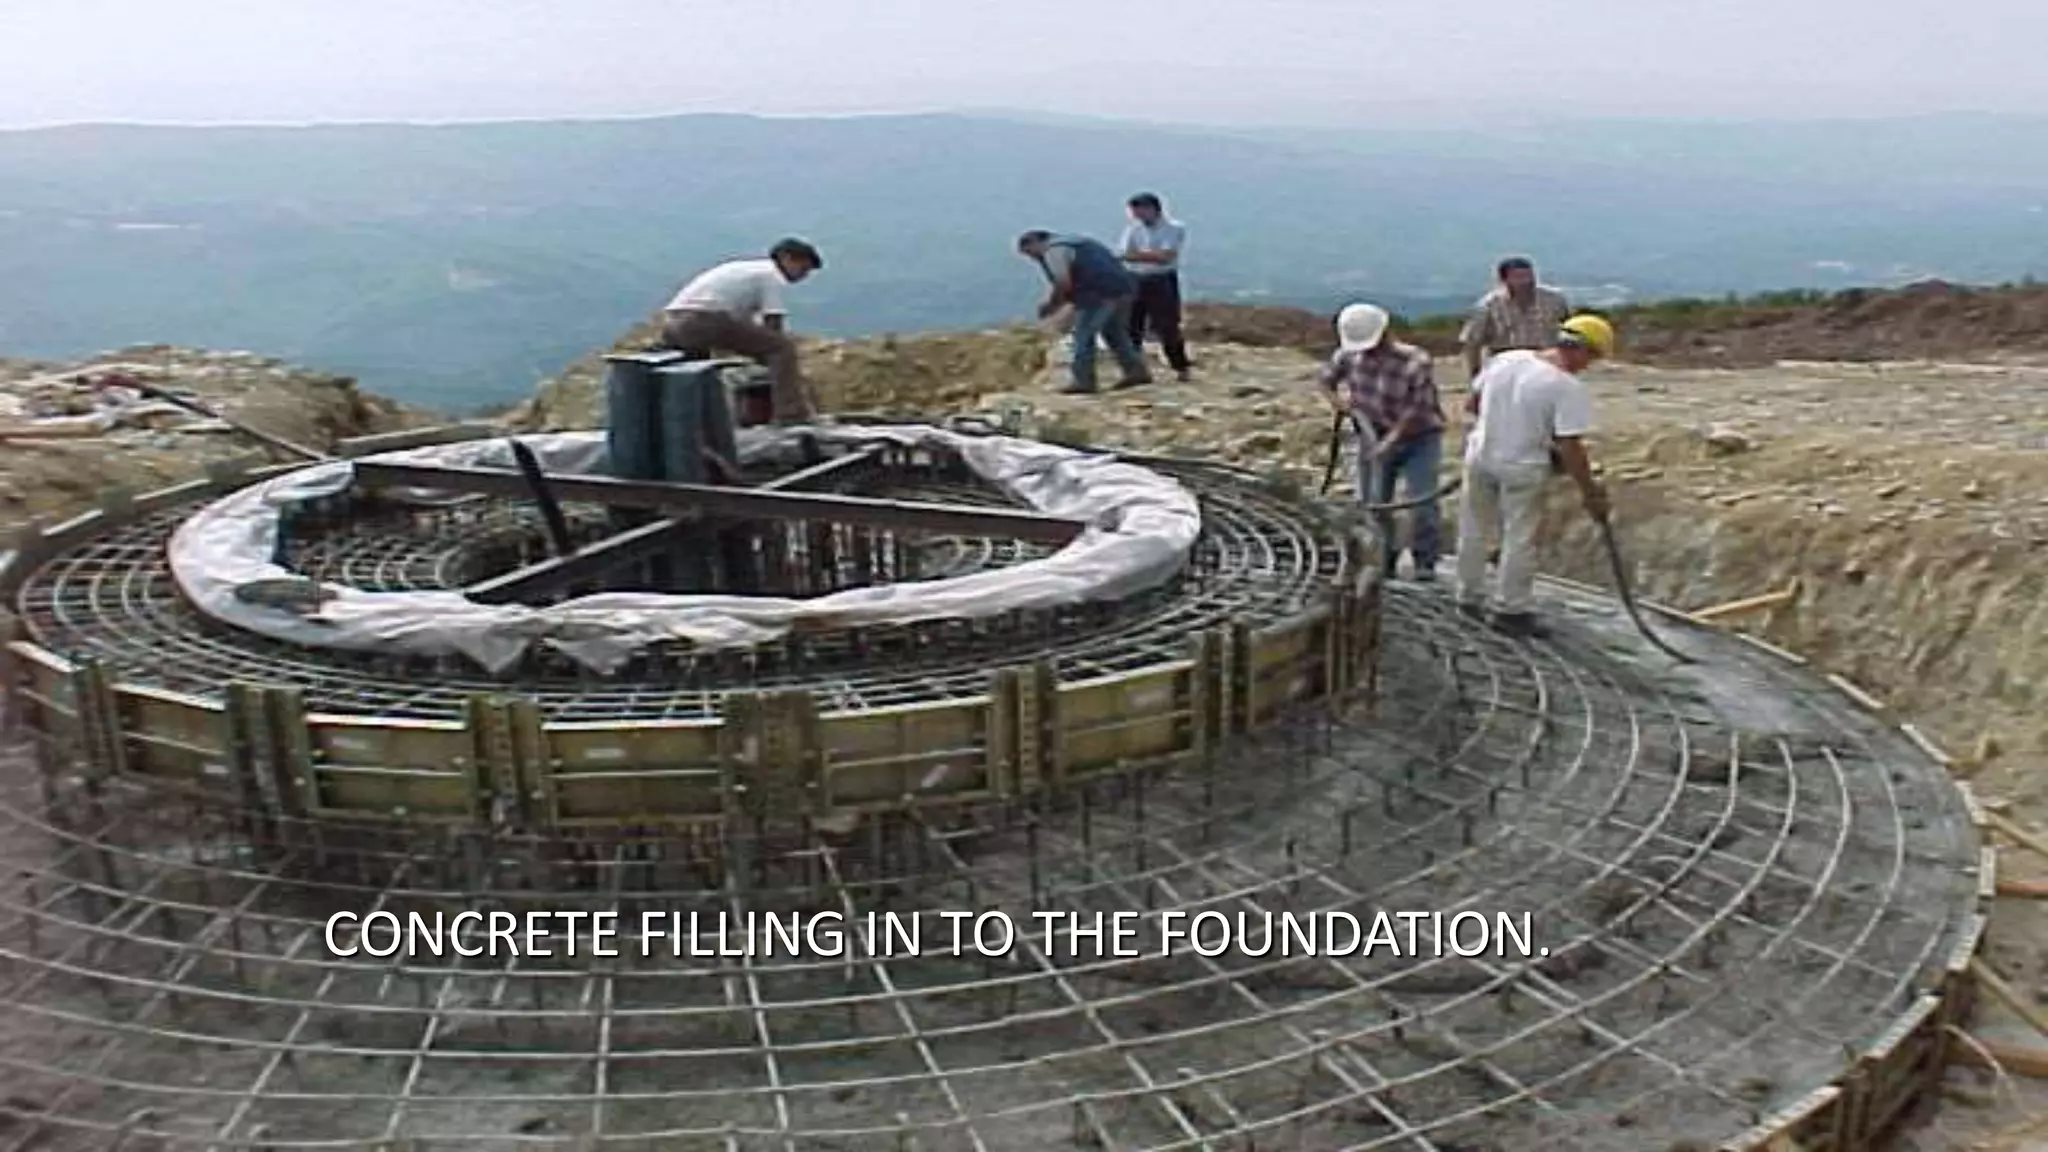
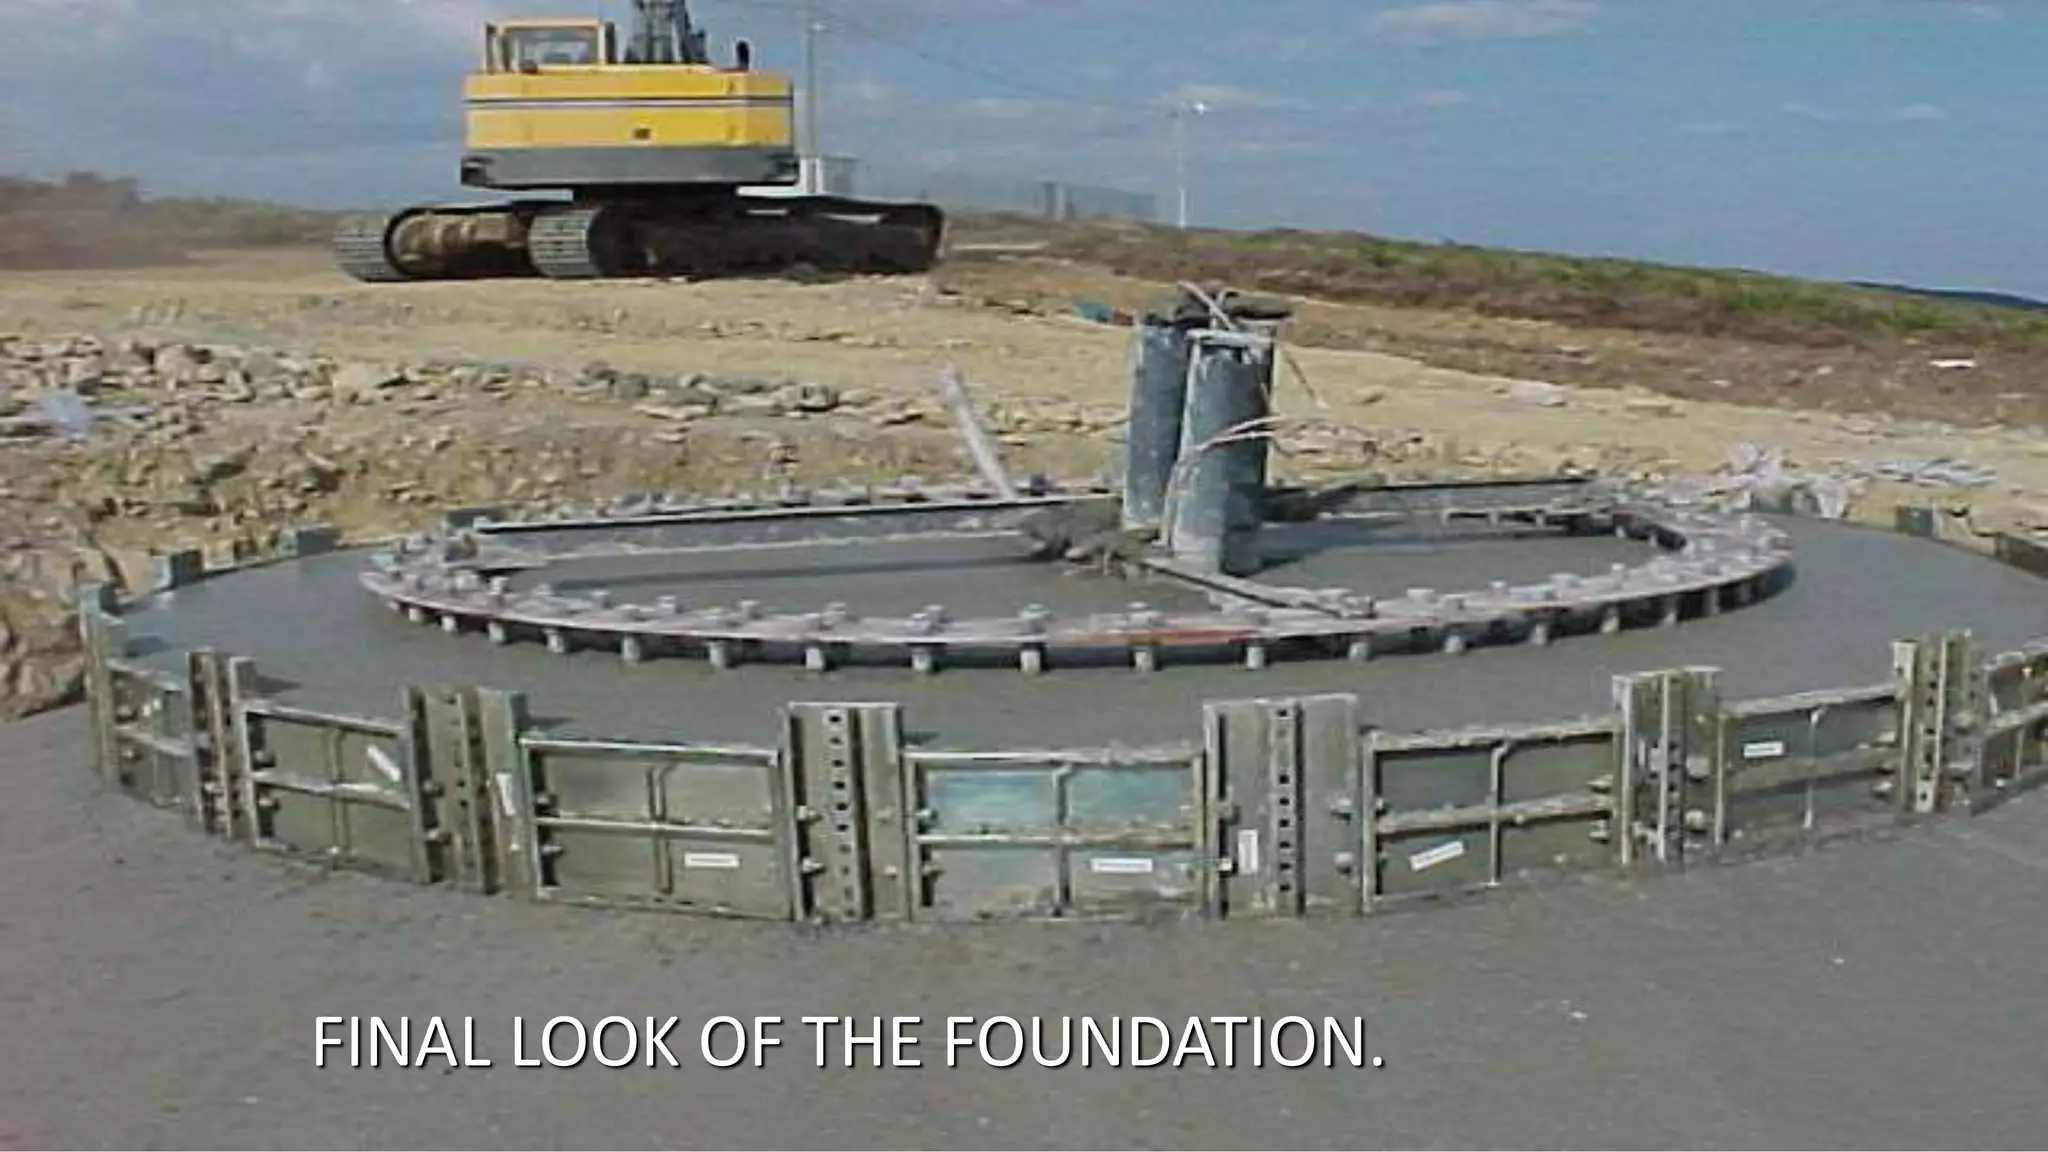
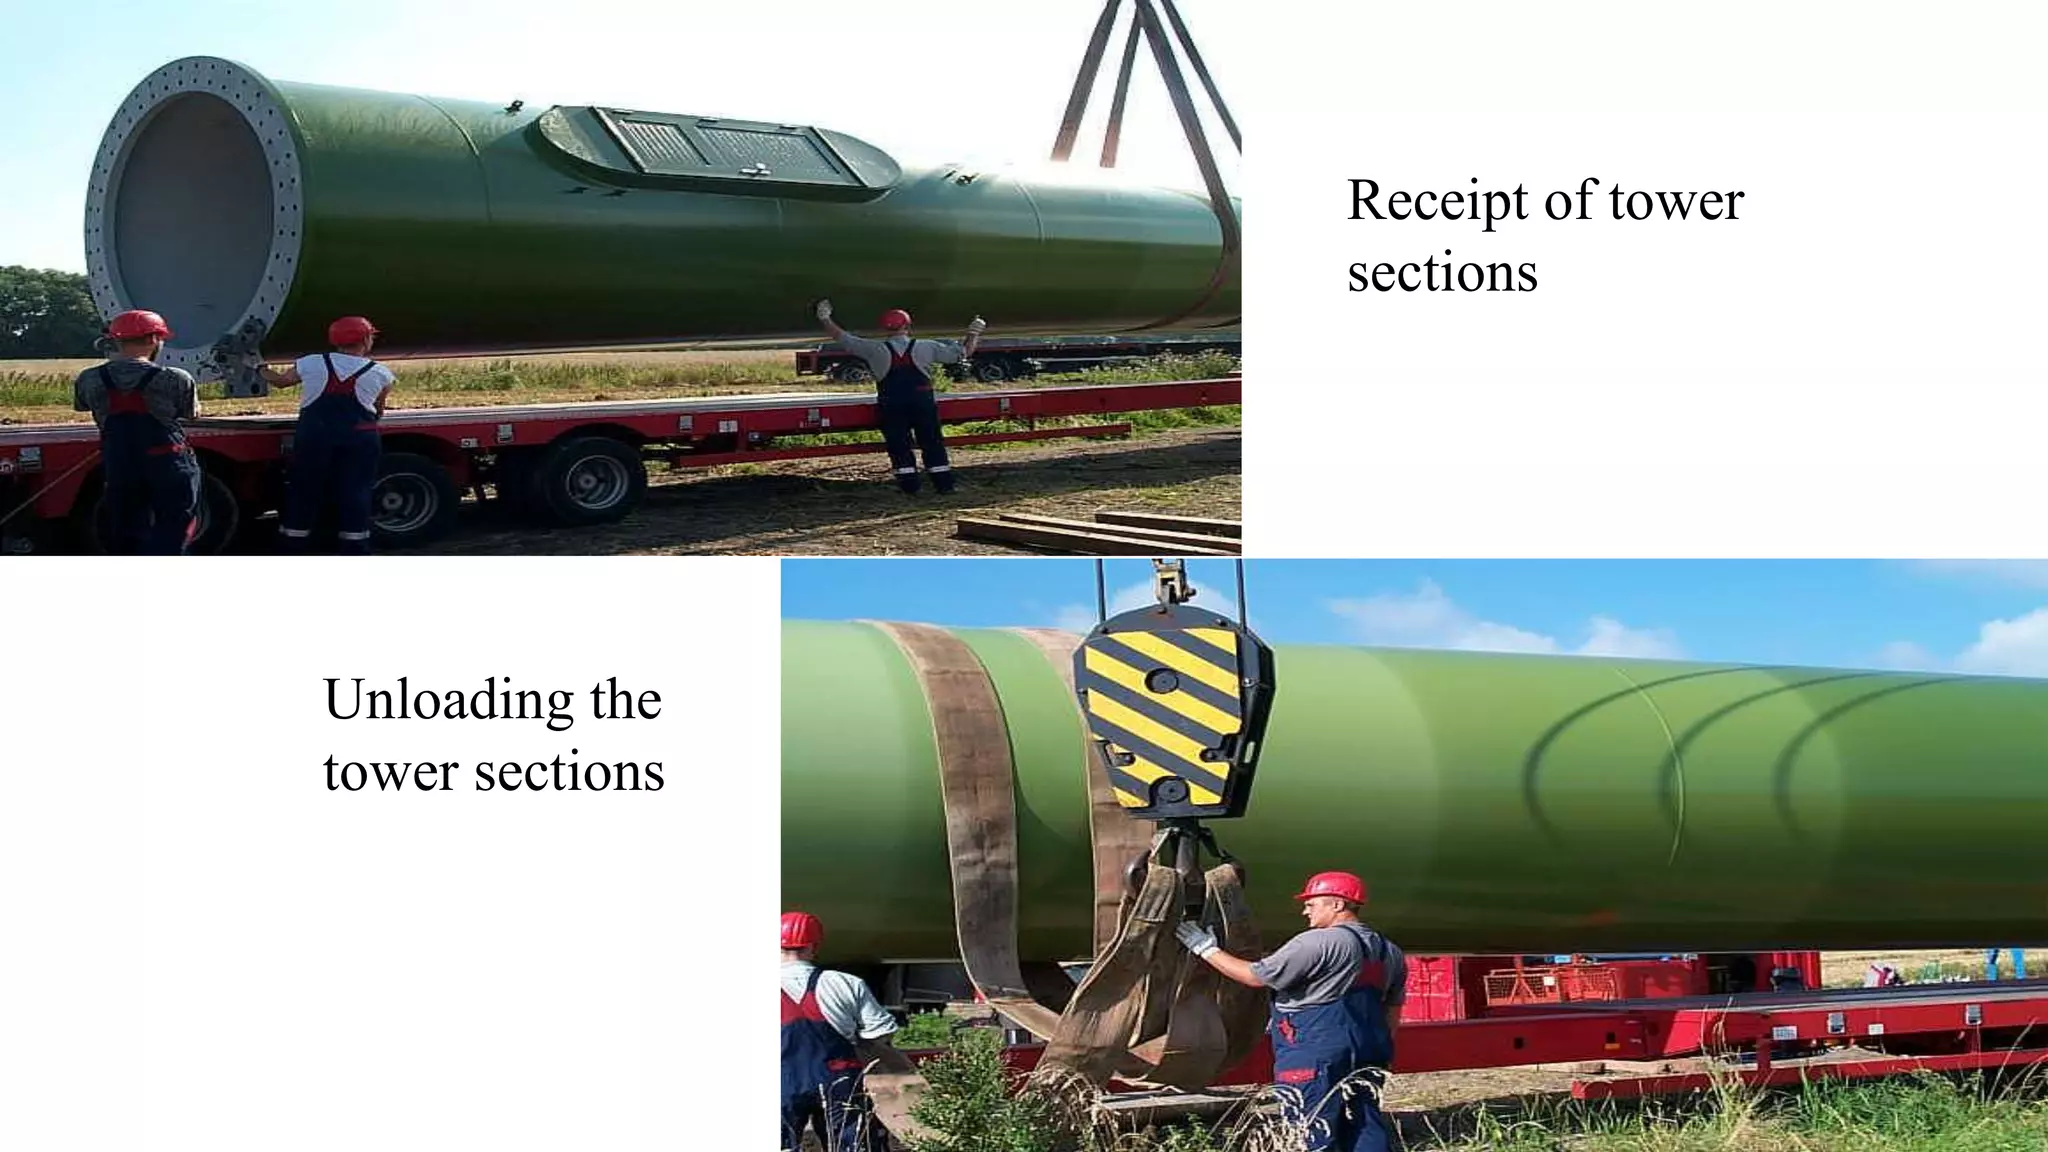
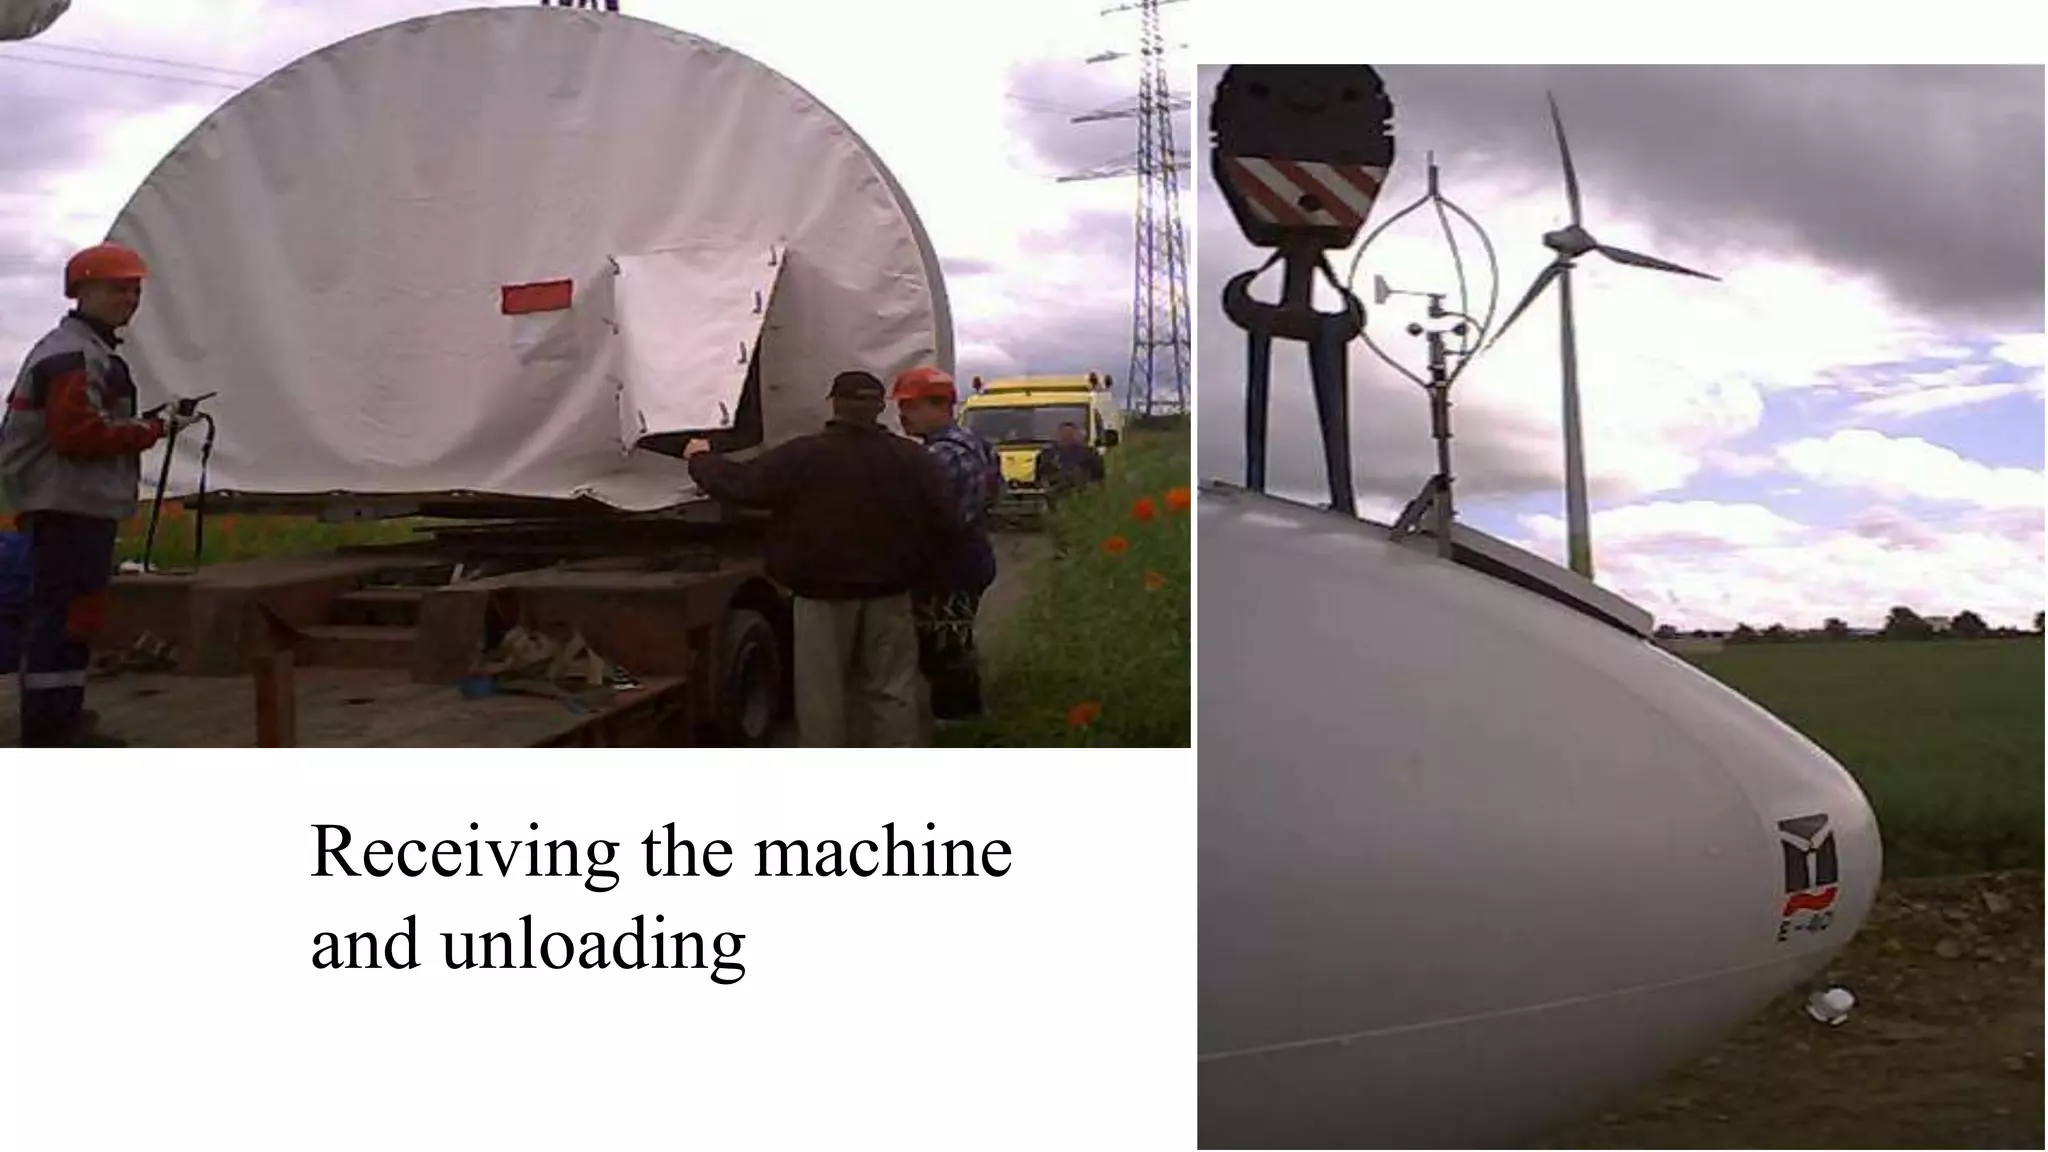
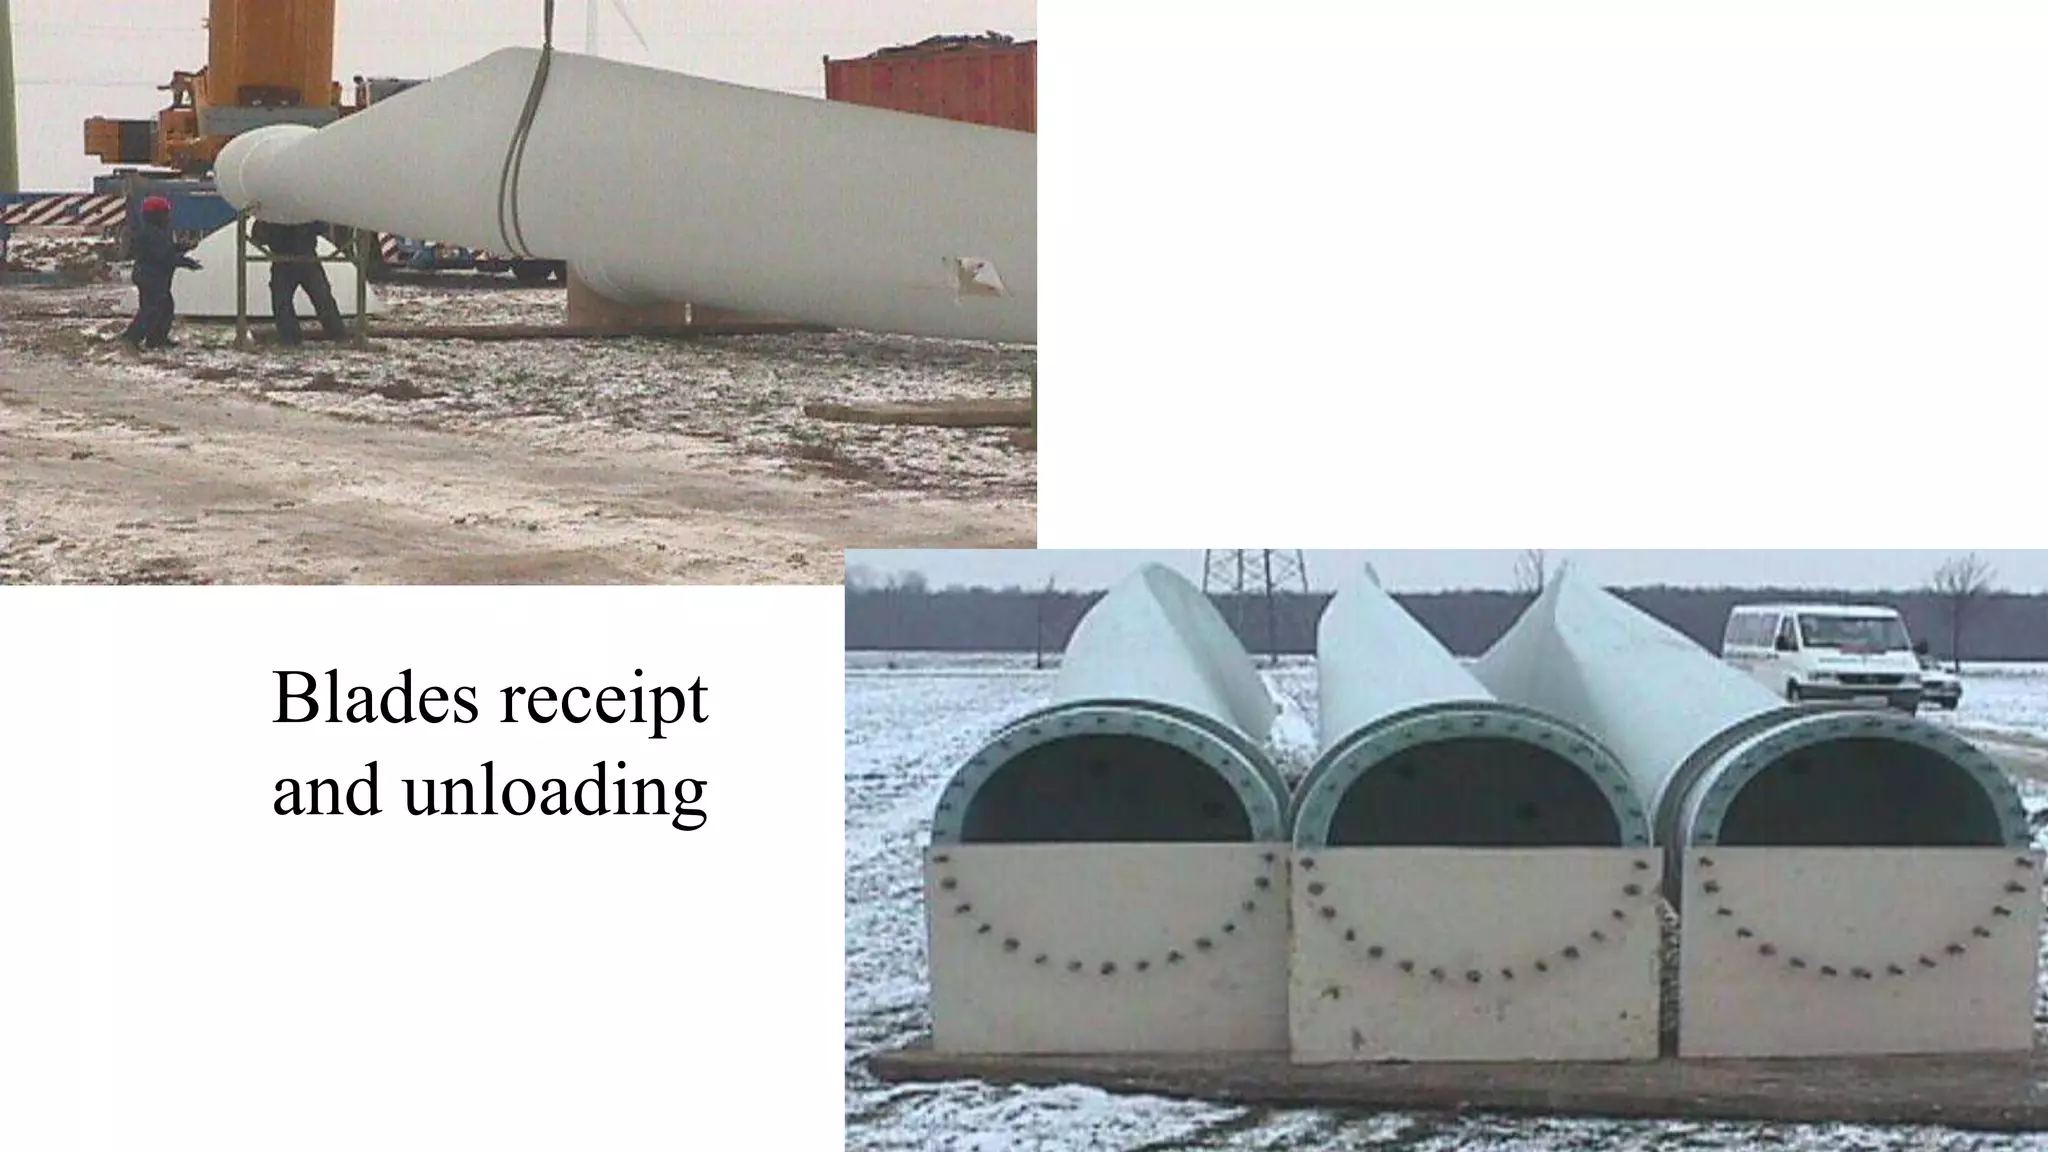
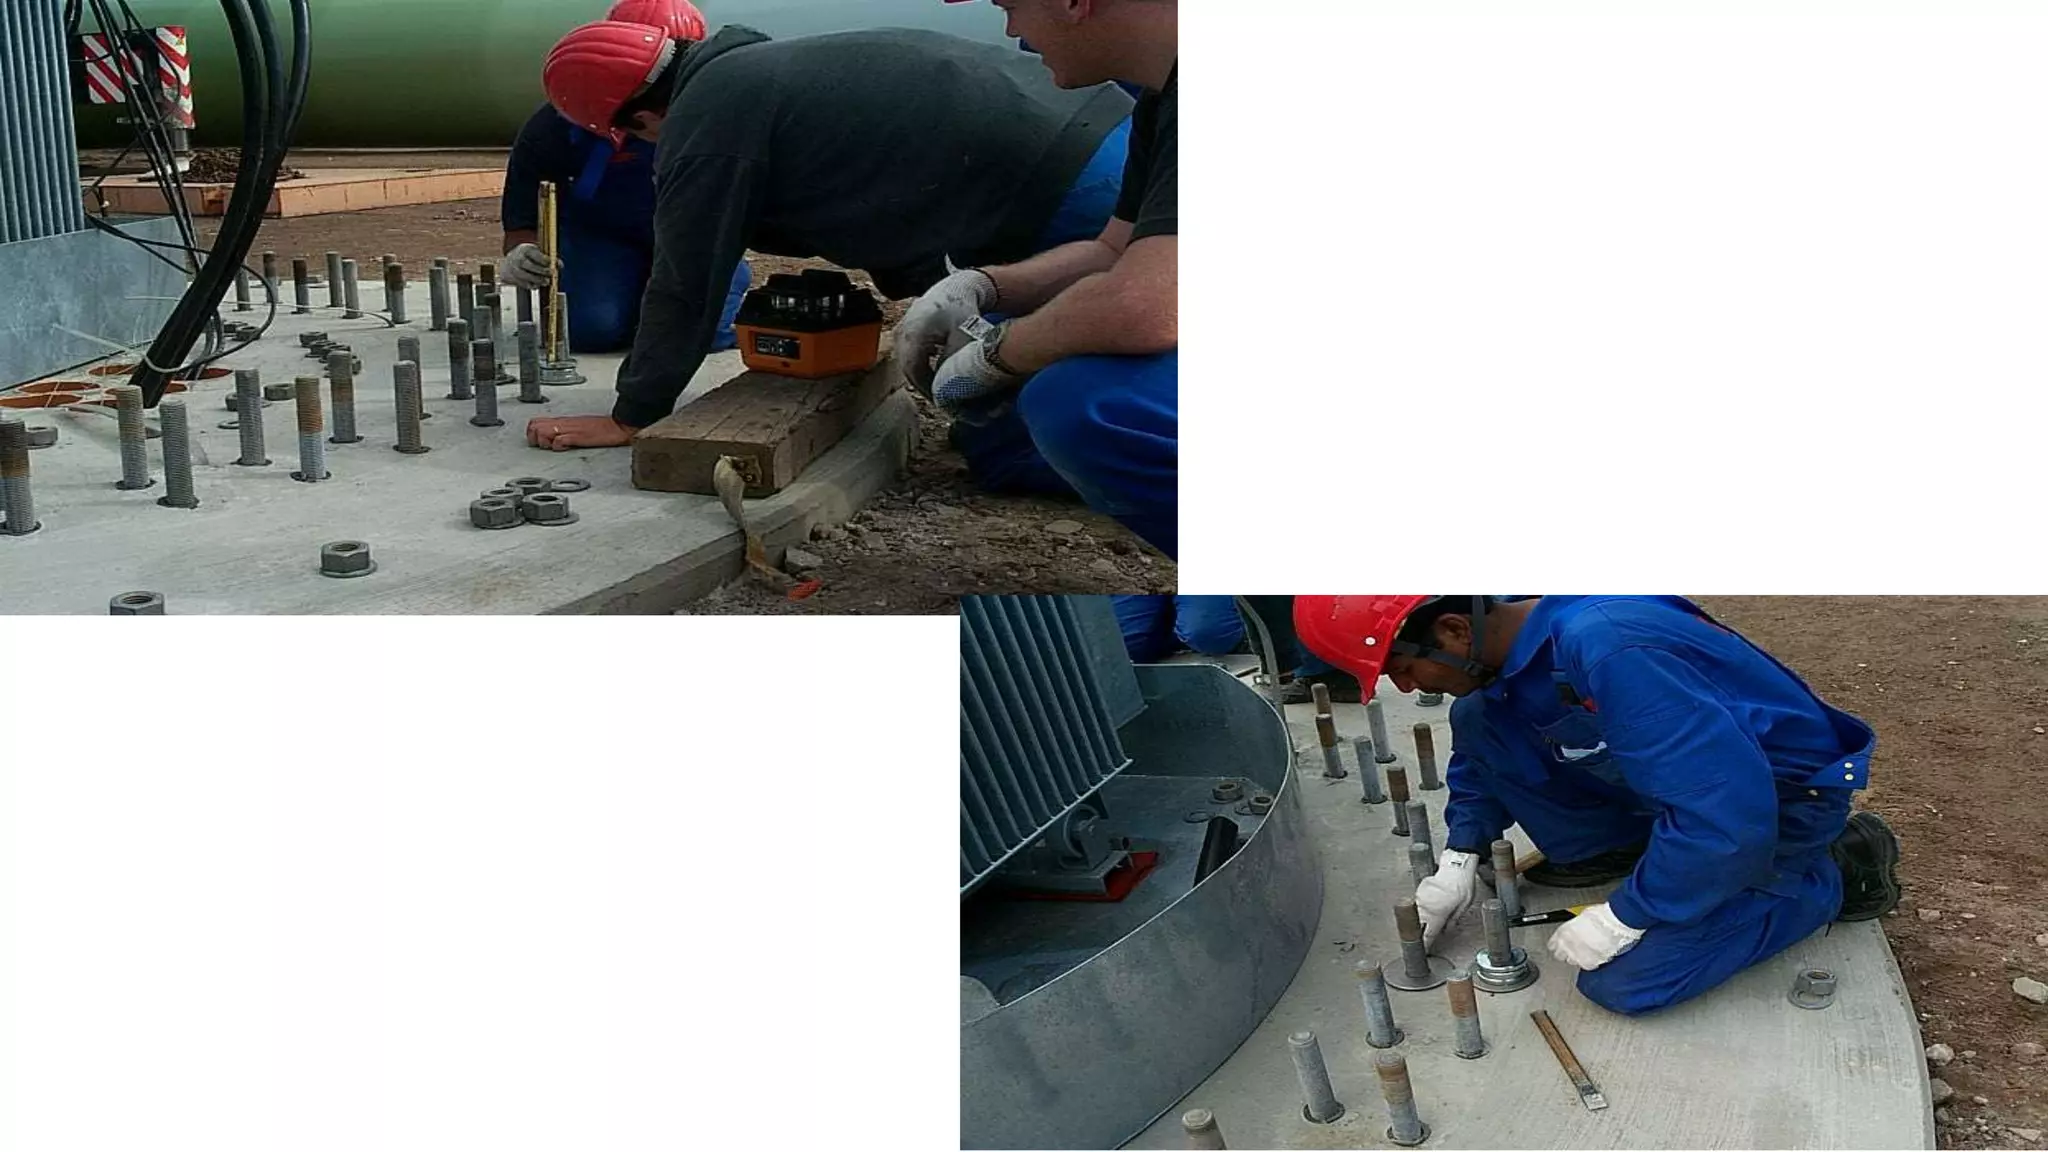
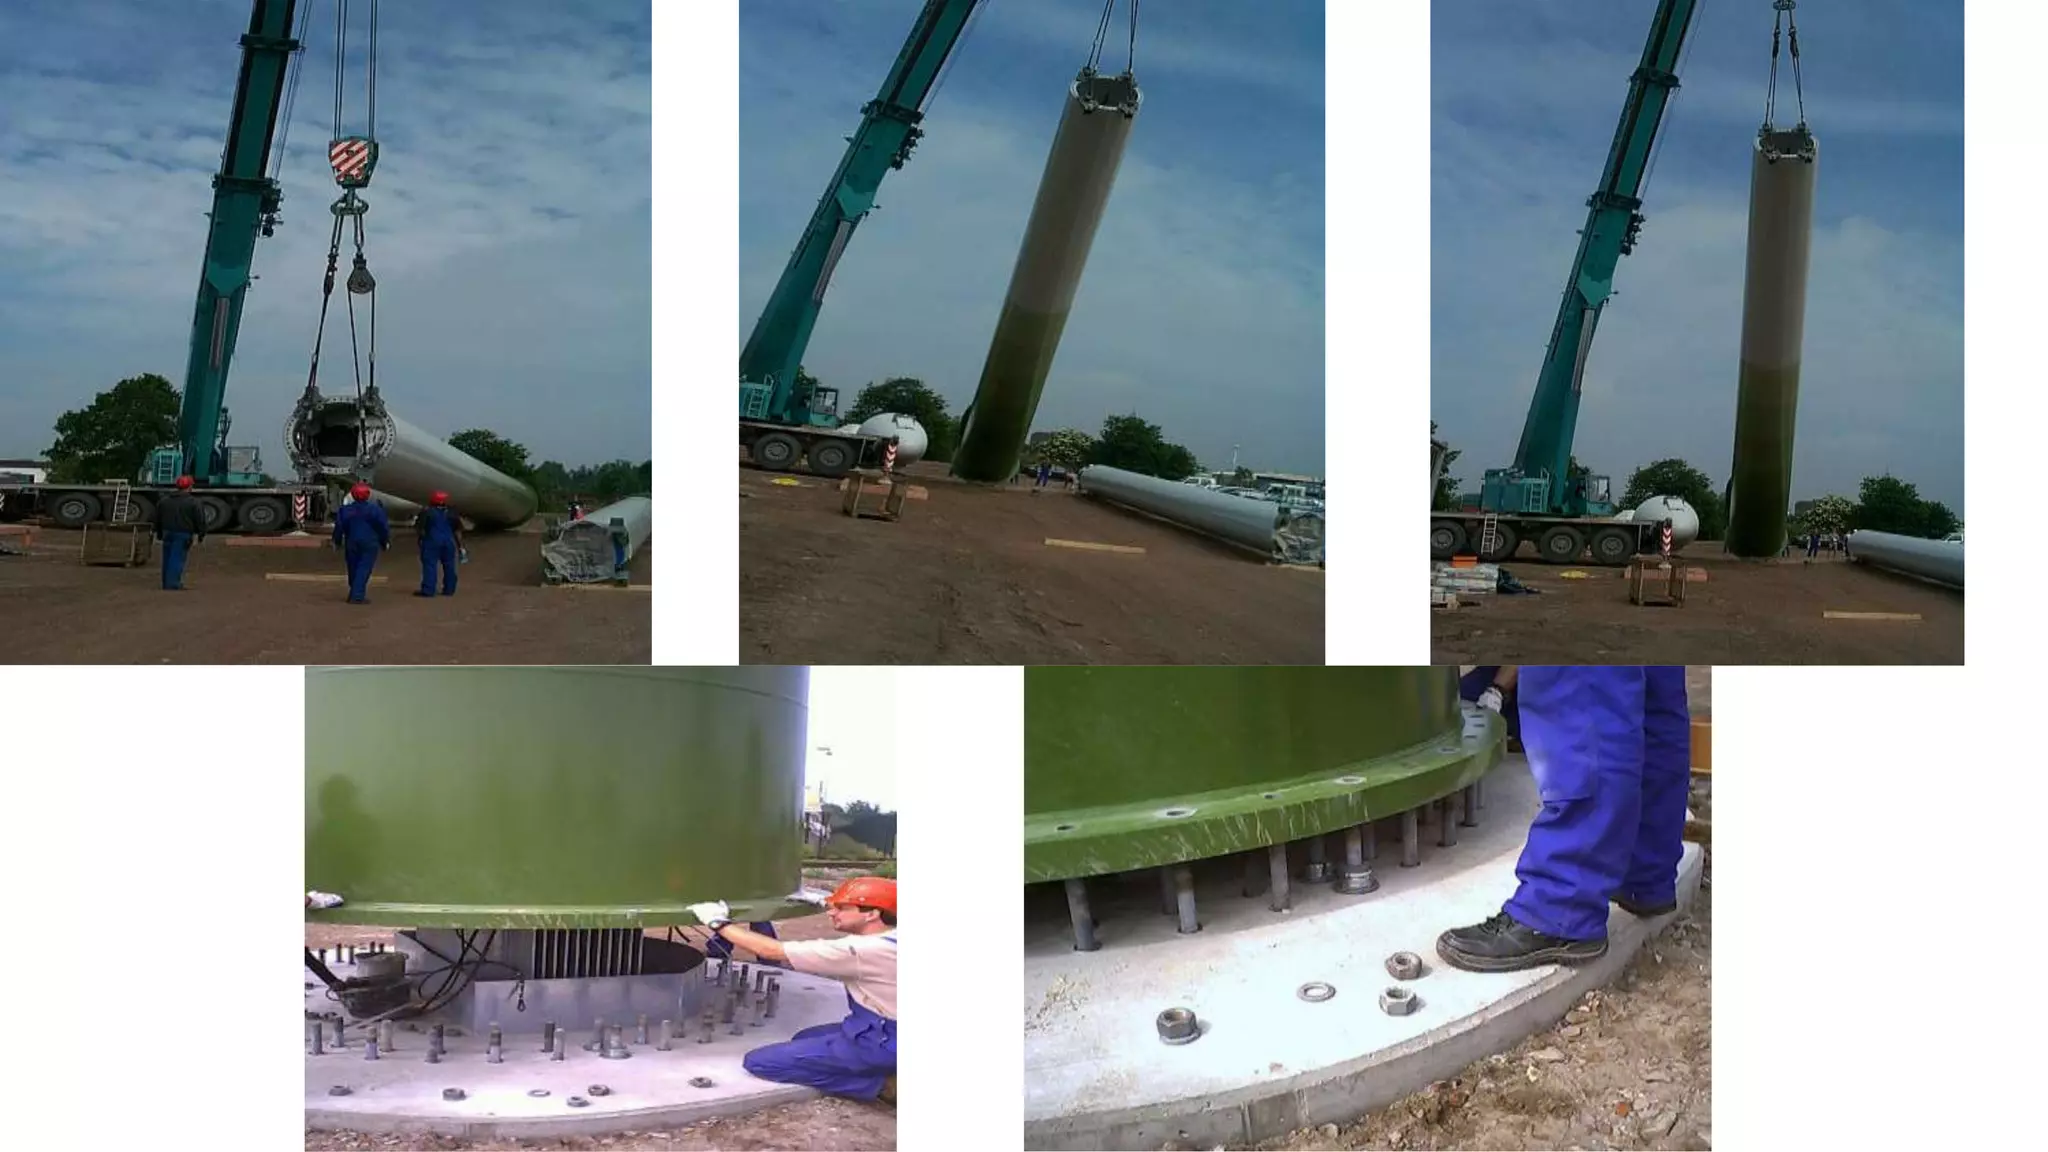
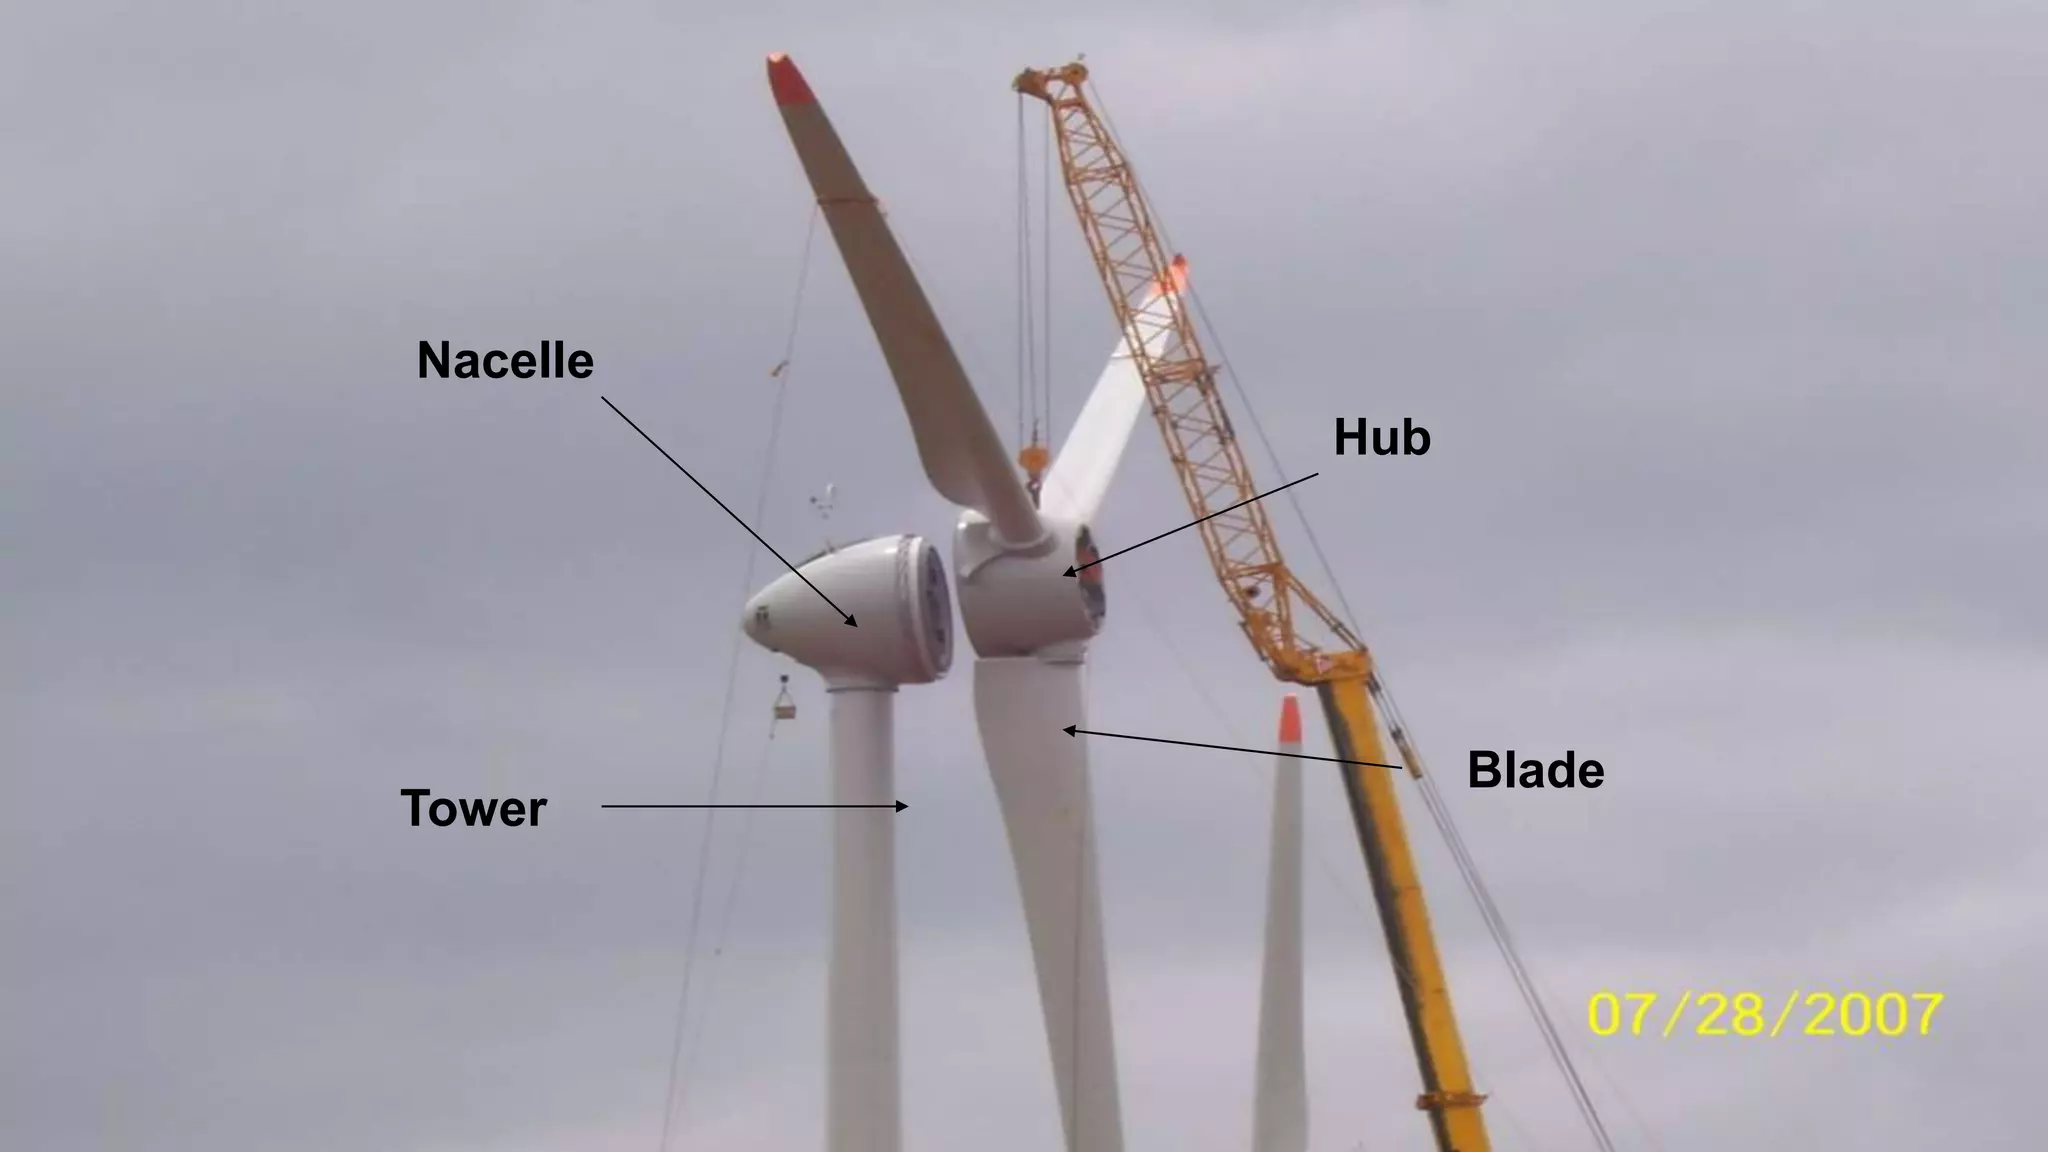
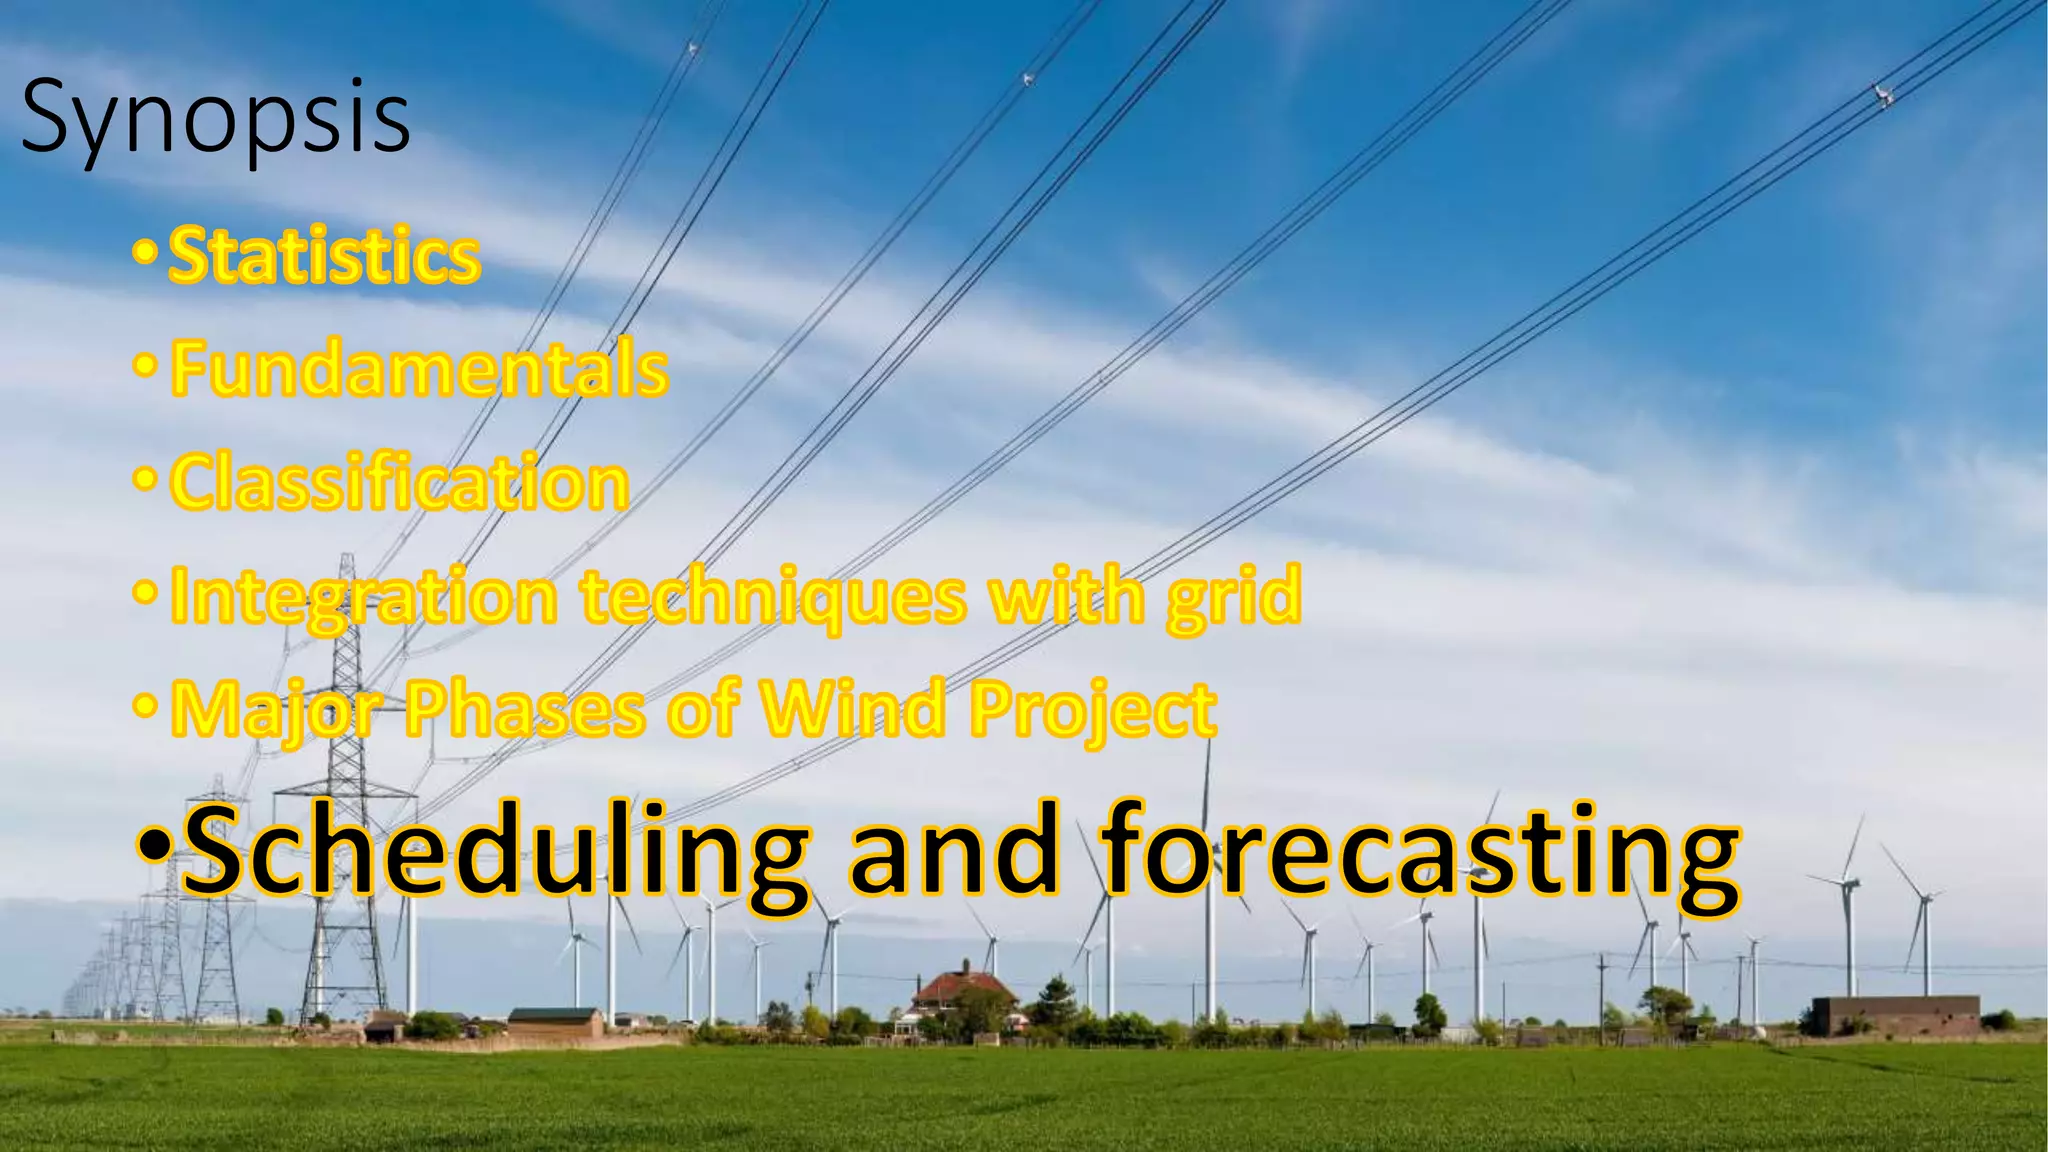
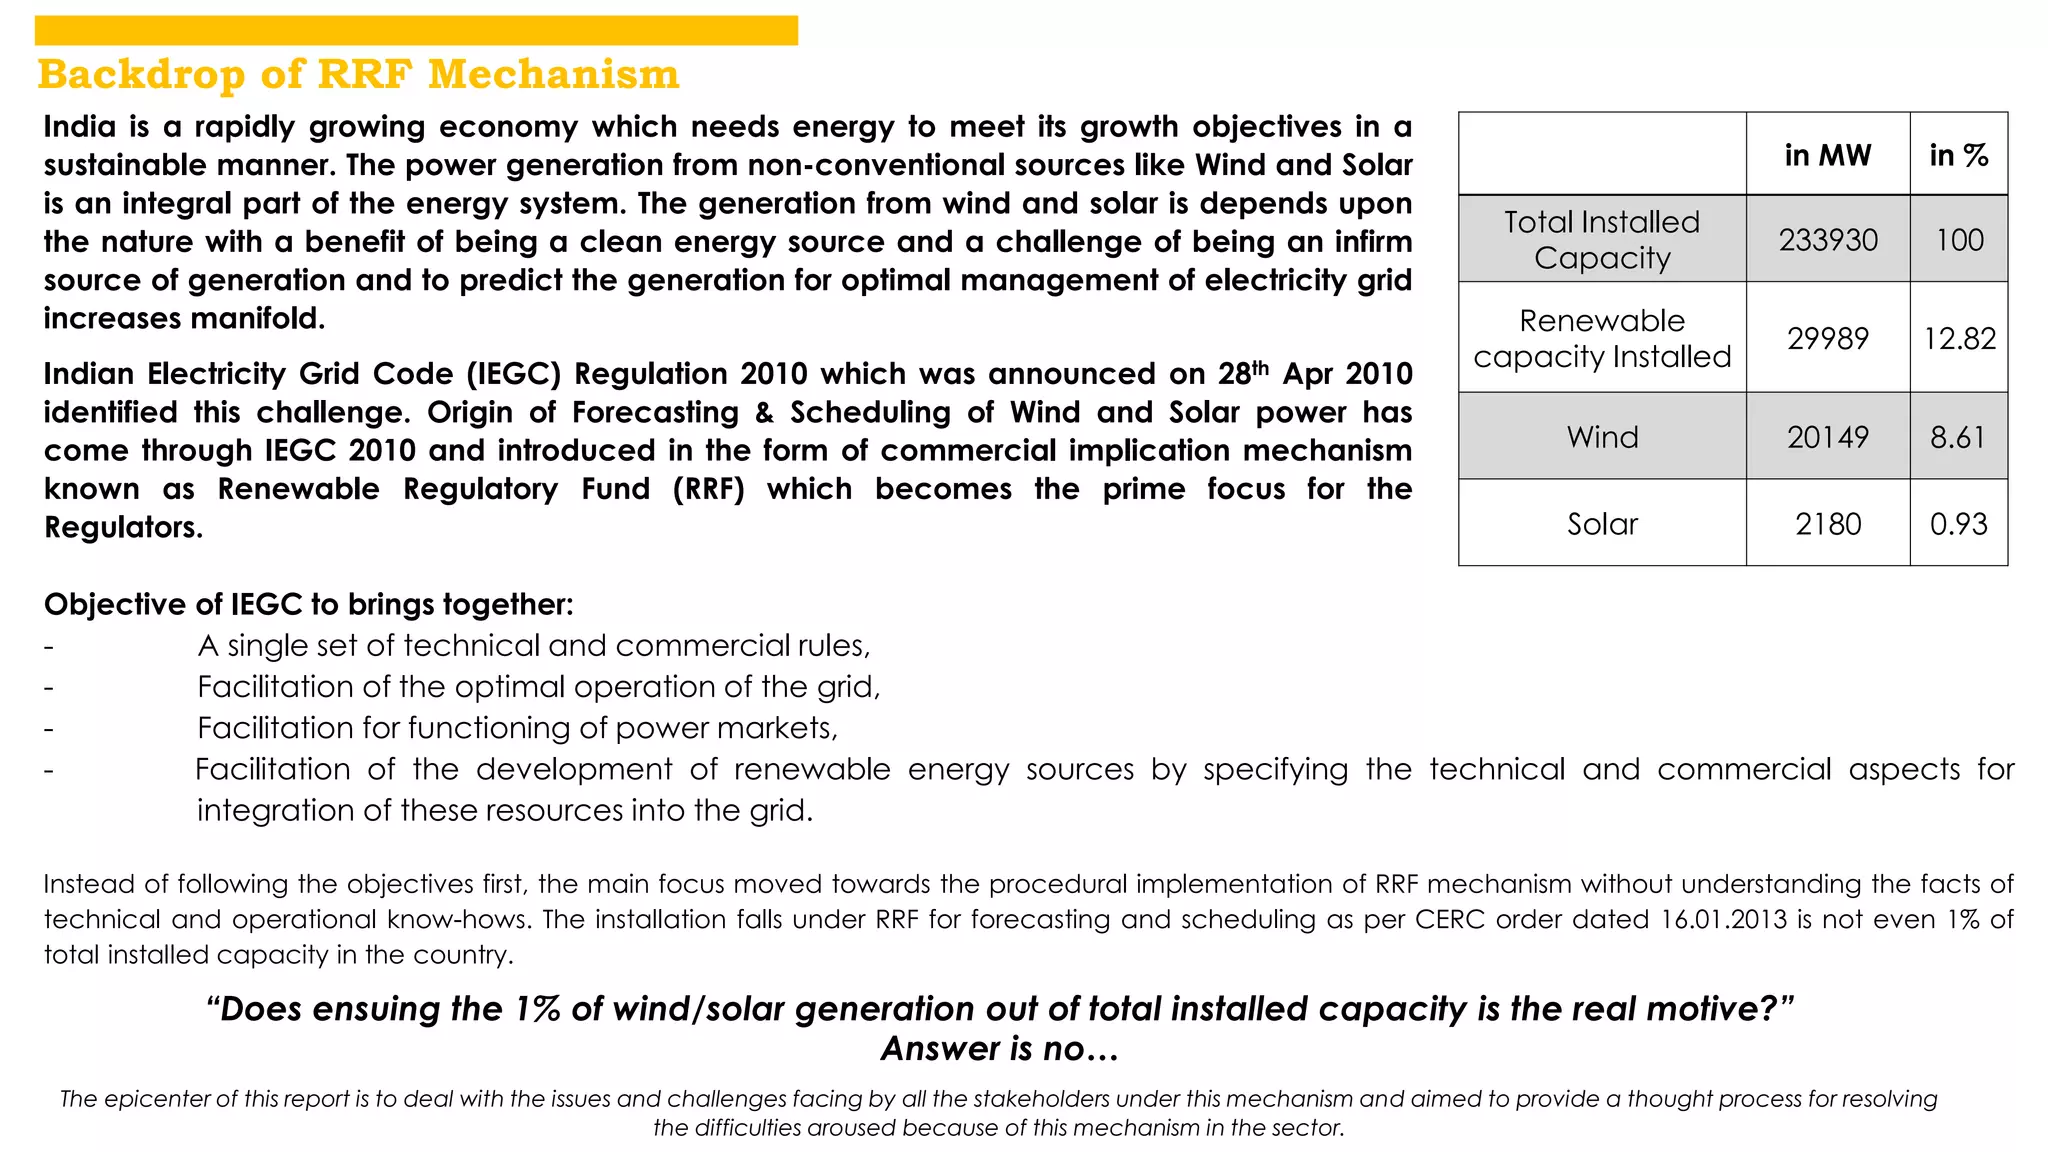
Demand Side Management” means the actions of a Distribution Licensee, beyond the customer's meter, with the objective of altering the end-use of electricity
WIND POWER GENERATION SCHEMES are Constant speed - Constant frequency systems (CSCF)
Variable speed - Constant frequency systems (VSCF)
Variable speed - Variable frequency systems (VSVF)
Sea waves have high energy densities, the highest among renewable energy sources with the natural seasonal variability of wave energy following the electricity demand in temperate climates securing energy supplies in remote regions.
These slides present at an introduction level about the demand side management and demand response in smart micro-grid system. Later mathematical modelling and detail on optimization techniques will be covered.
An alternate and eco-friendly energy source with a detailed explanation of types of turbines, their components along with the type of generator used, different wind farms, and production in India along with advantages and disadvantages.
Wind Power History
Advantages & Disadvantages
Wind Turbine & Components
Power From Wind Mill
Swept area Of Wind Mill Rotor
Wind Speed Variation with Height
Density & Temperature Variation with Height
Global Wind Patterns
Wind Speed Measurements
Wind Speed Distribution
Weibull Probability Distributions
A wind mill converts the kinetic energy of moving air into Mechanical energy that can be either used directly to run the Machine or to run the generator to produce electricity.
from this ppt you can almost aware about the operation of hydraulic turbines and various specification releated to it...
if you want to attains the knowledge about the turbines then must watch this ppt,... thankyou!
if you want to follow me on twitter then contact me at
ishantgautam51@yahoo.com
integration of solar and wind power generation systempranavi kasina
The major disadvantages of using independent renewable energy resources are that unavailability of power for all time. For overcoming this we use solar and wind energy together.
Lclr filter design and modelling for harmonic mitigation in interconnected mi...eSAT Journals
Abstract Today many people are attracted towards distribution generation (DG) because of low energy cost power supply, local generation, highly reliable system, supply with good power quality. Increasing attention and investment in renewable energy that is DG energy sources give rise to rapid development of high penetration renewable energy sources like solar energy, wind energy, hydro energy. Out of this most important and best is the solar energy. There are multiple ways to interface PV arrays with the power grid, but in there is problem of power quality. Today’s important concern of the power system is the power quality in case of renewable energy sources. The power quality improvement in the interconnected micro grid systems and grid interconnection with Distribution Generation (DGs) is the challenging task and to overcome the power quality problem passive filters are the best and cost effective solution. In this paper the LCLR filter is implemented between inverter and grid. The complete system consists of photovoltaic cell (PV), DC-DC boost converter, DC-AC inverter, LCLR filter and the grid. This paper also consists of complete MATLAB simulation of PV cell, DC-DC boost converter and inverter with LCLR filter. Key Words: Renewable energy, PV module, DC-DC boost converter, DGs, LCLR filter, power quality, micro grid (MG) and THD
This is the updated version of the lecture I give to my biology students each year on Valentine's Day. Please leave me a comment if you enjoyed it. If you download it for your own use, please leave me a comment telling me how you will be using it.
This Power point is all about Love. I am sure; the presentation will take you to another aspect of love, which can be said to be the extremes. Love in its extreme nature is dangerous. The duration of the presentation is 8 minutes. Thanks you
MicroGrid and Energy Storage System COMPLETE DETAILS NEW PPT Abin Baby
A microgrid is a localized grouping of electricity generation, energy storage, and loads that normally operates connected to a traditional centralized grid (macrogrid). This single point of common coupling with the macrogrid can be disconnected. The microgrid can then function autonomously. Generation and loads in a microgrid are usually interconnected at low voltage. From the point of view of the grid operator, a connected microgrid can be controlled as if it were one entity.
Microgrid generation resources can include fuel cells, wind, solar, or other energy sources. The multiple dispersed generation sources and ability to isolate the microgrid from a larger network would provide highly reliable electric power. Produced heat from generation sources such as micro turbines could be used for local process heating or space heating, allowing flexible trade off between the needs for heat and electric power.
WIND ENERGY REPORT AE 215- 2018 SOURCES OF FARM POWERmusadoto
Wind is the flow of gases on large scale. On the surface of the earth, wind consists of the bulk movement of air. In outer space, solar wind is the movement of gases and charged particles from the sun though space, while planetary wind is the outgassing of light chemical from a planet’s atmosphere into space. Wind by their spatial scale, their speed, the type of force that cause them, the region in which they occur and their effect. The strongest observed winds on planet in solar system occur on Neptune and Saturn. Winds have various aspects, an important one being its velocity, density of the gas involved and energy content of the wind.
Wind is almost entirely caused by the effects of the sun which, each hour, delivers 175 million watts of energy to the earth. This energy heats the planet’s surface, most intensively at the equator, which causes air to rise. This rising air creates an area of low pressure at the surface into which cooler air is sucked, and it is this flow of air that we know as “wind”. In reality atmospheric circulation is much more complicated and, after rising at the equator air travels pole wards. As it travels the air cools and eventually descends to the earth’s surface at about 30° latitude (north and south), from where it returns once again to the equator (a closed loop known as a Hadley Cell). Similar cells exist between 30° and 60° latitude (the Ferrell Cells) and between 60° latitude and each of the poles (the Polar Cells). Within these cells, the flow of air is further impacted by the rotation of the earth or the "Coriolis Effect". This effect creates a sideways force which causes air to circulate anticlockwise around areas of low pressure in the northern hemisphere and clockwise in the southern hemisphere
In summary, the origin of winds may be traced basically to uneven heating of the earth’s surface due to sun. This may lead to circulation of widespread winds on a global basis, producing planetary winds or may have a limited influence in a smaller area to cause local winds.
Basic principles, power in wind, force on blades & turbines, wind energy conversion, site selection, basic components of wind energy conversion systems (WECS), classification of WECS, wind energy collectors, applications of wind energy
WIND TURBINE turbine development Wind turbines are classified into two genera...Mohan313217
History of Wind-Mills:
UNIT-III WIND ENERGY
The wind is a by-product of solar energy. Approximately 2% of the sun's energy reaching the earth is converted into wind energy. The surface of the earth heats and cools unevenly, creating atmospheric pressure zones that make air flow from high- to low pressure areas. The wind has played an important role in the history of human civilization. The first known use of wind dates back 5,000 years to Egypt, where boats used sails to travel from shore to shore. The first true windmill, a machine with vanes attached to an axis to produce circular motion, may have been built as early as 2000 B.C. in ancient Babylon. By the 10th century A.D., windmills with wind-catching surfaces having 16 feet length and 30 feet height were grinding grain in the areas in eastern Iran and Afghanistan. The earliest written references to working wind machines in western world date from the12th century. These too were used for milling grain. It was not until a few hundred years later that windmills were modified to pump water and reclaim much of Holland from the sea.
The multi-vane "farm windmill" of the American Midwest and West was invented in the United States during the latter half of the l9th century. In 1889 there were 77 windmill factories in the United States, and by the turn of the century, windmills had become a major American export. Until the diesel engine came along, many transcontinental rail routes in the U.S. depended on large multi-vane windmills to pump water for steam locomotives. Farm windmills are still being produced and used, though in reduced numbers. They are best suited for pumping ground water in small quantities to livestock water tanks. In the1930s and 1940s, hundreds of thousands of electricity producing wind turbines were built-in the U.S. They had two or three thin blades which rotated at high speeds to drive electrical generators. These wind turbines provided electricity to farms beyond the reach of power lines and were typically used to charge storage batteries, operate radio receivers and power a light bulb. By the early 1950s, however, the extension of the central power grid to nearly every American household, via the Rural Electrification Administration, eliminated the market for these machines. Wind turbine development lay nearly dormant for the next 20 years.
Among the Renewable Energy Sources, Wind Energy is taken up with careful prior efforts before implementation as it requires all capital and technical inputs before payback starts. However, it is a clean source of electric power compared to coal based thermal power. India is a country that has made progress in wind power investment.
Design of PVC Bladed Horizontal Axis Wind Turbine for Low Wind Speed RegionIJERA Editor
The Project is aimed at designing a wind turbine that can be able to build by Laypersons, using readily available material which is feasible & affordable to provide much needed electricity. Since most of the high wind power density regions in the zone of high wind speed are already being tapped by large scale wind turbine and so it required creating a large scope for the development of low wind speed turbines. Our study focuses primarily on designing the blade for tapping power in the regions of low wind power density. The aerodynamic profiles of wind turbine blades have major influence on aerodynamic efficiency of wind turbine. This can be achieved by comparing the effectiveness of a crude blade fashioned from a different Size, Material & standard of PVC drainage pipe which are easily available in market. It can be evaluated by performing experimental analysis, data collection & its evaluation on different type & size of PVC Pipe & preparing an analytical tool for best Design.
Similar to Grid integration of the Wind Turbine Generator (20)
About
Indigenized remote control interface card suitable for MAFI system CCR equipment. Compatible for IDM8000 CCR. Backplane mounted serial and TCP/Ethernet communication module for CCR remote access. IDM 8000 CCR remote control on serial and TCP protocol.
• Remote control: Parallel or serial interface.
• Compatible with MAFI CCR system.
• Compatible with IDM8000 CCR.
• Compatible with Backplane mount serial communication.
• Compatible with commercial and Defence aviation CCR system.
• Remote control system for accessing CCR and allied system over serial or TCP.
• Indigenized local Support/presence in India.
• Easy in configuration using DIP switches.
Technical Specifications
Indigenized remote control interface card suitable for MAFI system CCR equipment. Compatible for IDM8000 CCR. Backplane mounted serial and TCP/Ethernet communication module for CCR remote access. IDM 8000 CCR remote control on serial and TCP protocol.
Key Features
Indigenized remote control interface card suitable for MAFI system CCR equipment. Compatible for IDM8000 CCR. Backplane mounted serial and TCP/Ethernet communication module for CCR remote access. IDM 8000 CCR remote control on serial and TCP protocol.
• Remote control: Parallel or serial interface
• Compatible with MAFI CCR system
• Copatiable with IDM8000 CCR
• Compatible with Backplane mount serial communication.
• Compatible with commercial and Defence aviation CCR system.
• Remote control system for accessing CCR and allied system over serial or TCP.
• Indigenized local Support/presence in India.
Application
• Remote control: Parallel or serial interface.
• Compatible with MAFI CCR system.
• Compatible with IDM8000 CCR.
• Compatible with Backplane mount serial communication.
• Compatible with commercial and Defence aviation CCR system.
• Remote control system for accessing CCR and allied system over serial or TCP.
• Indigenized local Support/presence in India.
• Easy in configuration using DIP switches.
Explore the innovative world of trenchless pipe repair with our comprehensive guide, "The Benefits and Techniques of Trenchless Pipe Repair." This document delves into the modern methods of repairing underground pipes without the need for extensive excavation, highlighting the numerous advantages and the latest techniques used in the industry.
Learn about the cost savings, reduced environmental impact, and minimal disruption associated with trenchless technology. Discover detailed explanations of popular techniques such as pipe bursting, cured-in-place pipe (CIPP) lining, and directional drilling. Understand how these methods can be applied to various types of infrastructure, from residential plumbing to large-scale municipal systems.
Ideal for homeowners, contractors, engineers, and anyone interested in modern plumbing solutions, this guide provides valuable insights into why trenchless pipe repair is becoming the preferred choice for pipe rehabilitation. Stay informed about the latest advancements and best practices in the field.
Cosmetic shop management system project report.pdfKamal Acharya
Buying new cosmetic products is difficult. It can even be scary for those who have sensitive skin and are prone to skin trouble. The information needed to alleviate this problem is on the back of each product, but it's thought to interpret those ingredient lists unless you have a background in chemistry.
Instead of buying and hoping for the best, we can use data science to help us predict which products may be good fits for us. It includes various function programs to do the above mentioned tasks.
Data file handling has been effectively used in the program.
The automated cosmetic shop management system should deal with the automation of general workflow and administration process of the shop. The main processes of the system focus on customer's request where the system is able to search the most appropriate products and deliver it to the customers. It should help the employees to quickly identify the list of cosmetic product that have reached the minimum quantity and also keep a track of expired date for each cosmetic product. It should help the employees to find the rack number in which the product is placed.It is also Faster and more efficient way.
Water scarcity is the lack of fresh water resources to meet the standard water demand. There are two type of water scarcity. One is physical. The other is economic water scarcity.
Hybrid optimization of pumped hydro system and solar- Engr. Abdul-Azeez.pdffxintegritypublishin
Advancements in technology unveil a myriad of electrical and electronic breakthroughs geared towards efficiently harnessing limited resources to meet human energy demands. The optimization of hybrid solar PV panels and pumped hydro energy supply systems plays a pivotal role in utilizing natural resources effectively. This initiative not only benefits humanity but also fosters environmental sustainability. The study investigated the design optimization of these hybrid systems, focusing on understanding solar radiation patterns, identifying geographical influences on solar radiation, formulating a mathematical model for system optimization, and determining the optimal configuration of PV panels and pumped hydro storage. Through a comparative analysis approach and eight weeks of data collection, the study addressed key research questions related to solar radiation patterns and optimal system design. The findings highlighted regions with heightened solar radiation levels, showcasing substantial potential for power generation and emphasizing the system's efficiency. Optimizing system design significantly boosted power generation, promoted renewable energy utilization, and enhanced energy storage capacity. The study underscored the benefits of optimizing hybrid solar PV panels and pumped hydro energy supply systems for sustainable energy usage. Optimizing the design of solar PV panels and pumped hydro energy supply systems as examined across diverse climatic conditions in a developing country, not only enhances power generation but also improves the integration of renewable energy sources and boosts energy storage capacities, particularly beneficial for less economically prosperous regions. Additionally, the study provides valuable insights for advancing energy research in economically viable areas. Recommendations included conducting site-specific assessments, utilizing advanced modeling tools, implementing regular maintenance protocols, and enhancing communication among system components.
2. Synopsis
•Statistics
• Fundamentals
• Classification
• Integration techniques with grid
• Major Phases in the Wind project
• Scheduling and forecasting
4. Top 10 countries
by nameplate wind power capacity
(2013 year-end)
Country
New 2013
Wind power total
capacity % world
total
capacity (MW) (MW)
World total 35,289 MW 318,105 MW 100%
China 16,088 91,412 28.7
United States 1,084 61,091 19.2
Germany 3,238 34,250 10.8
Spain 175 22,959 7.2
India 1,729 20,150 6.3
UK 1,883 10,531 3.3
Italy 444 8,552 2.7
France 631 8,254 2.6
Canada 1,599 7,803 2.5
Denmark 657 4,772 1.5
5.
6. STATE WISE WIND INSTALLATIONS IN INDIA as on 31.04.14
State Mar-14 Mar-13 Mar-12 Mar-11 Mar-10 Mar-09
Tamil Nadu 7275.68 7,162.18 6,987.60 5904.4 4907 4304.5
Maharashtra 4064.95 3,021.85 2,733.30 2310.8 2078 1938.9
Gujarat 3447.28 3,174.58 2,966.30 2175.5 1864 1566.5
Rajasthan 2783.45 2,684.65 2,070.70 1524.8 1088 738.4
Karnataka 2323.85 2,135.15 1,933.50 1730 1473 1327.4
Andhra Pradesh 783.35 447.65 245.5 200.2 236 122.5
Madhya Pradesh 423.4 386 376.4 275.5 229 212.8
Kerala 35.1 35.1 35.1 32.8 28 27
Others 4.3 4.3 3.2 0 4 1.1
Total 21141.4 19,051.46 17365 14158 11807 10242.3
9. Renewal Energy Installed Capacity in India (as of 31 January 2014)
Installed capacity
(in MW)
Wind 20,298.83
Small Hydel Power Projects 3,774.15
Bagasse Cogeneration 2,512.88
Solar 2,208.36
Biomass Power & Gasification 1,285.60
Waste to Power 99.08
30,177.90
Type Technology
Grid Connected Power
Total - Grid Connected Power
Wind Portfolio is 8.68 % in the total generation capacity of country
12. General circulation
The regions around equator, at 0° latitude
are heated more by the sun than the rest of
the globe. These hot areas are indicated in
the warm colours, red, orange and yellow
in this infrared picture of sea surface
temperatures (taken from a NASA satellite,
NOAA-7 in July 1984).
Hot air is lighter than cold air and will rise
into the sky until it reaches approximately
10 km (6 miles) altitude and will spread to
the North and the South. If the globe did
not rotate, the air would simply arrive at
the North Pole and the South Pole, sink
down, and return to the equator.
The power emission from the
sun is 1.37 kW/m 2 on the
surface of the sphere, which
has the sun as its centre and
the average radius of the earth
trajectory. The power hits a
circular disc with an area of
of 1.27 x 10 14 m 2 . The
power emitted to the earth is
thus 1.74 x 10 17W.
13. Secondary Circulation
The wind rises from the equator and moves north and south in the higher layers
of the atmosphere.
Around 30°; latitude in both hemispheres the Coriolis force prevents the air from
moving much farther. At this latitude there is a high pressure area, as the air
begins sinking down again.
As the wind rises from the equator there will be a low pressure area close to
ground level attracting winds from the North and South.
At the Poles, there will be high pressure due to the
cooling of the air.
Keeping in mind the bending force of the Coriolis
force, we thus have the following general results for
the prevailing wind direction:
Latitude: 90-60°N 60-30°N 30-0°N 0-30°S 30-60°S 60-90°S
Direction: NE SW NE SE NW SE
14. Tertiary Circulations
Land masses are heated by the sun more quickly than the sea in
the daytime. The air rises, flows out to the sea, and creates a low
pressure at ground level which attracts the cool air from the sea.
This is called a sea breeze. At nightfall there is often a period of
calm when land and sea temperatures are equal.
At night the wind blows in the opposite direction. The land
breeze at night generally has lower wind speeds, because the
temperature difference between land and sea is smaller at night.
The monsoon known from South-East Asia is in reality a large-scale
form of the sea breeze and land breeze, varying in its
direction between seasons, because land masses are heated or
cooled more quickly than the sea.
Sea Breezes
15. Mountain winds
Mountain regions display many interesting weather patterns. One example is the valley
wind which originates on south-facing slopes (north-facing in the southern hemisphere).
When the slopes and the neighboring air are heated the density of the air decreases, and
the air ascends towards the top following the surface of the slope. At night the wind
direction is reversed, and turns into a down slope wind.
If the valley floor is sloped, the air may move down or up the valley, as a canyon wind.
Winds flowing down the leeward sides of mountains can be quite powerful:
16.
17. Site / WTG Classification
Wind Class/Turbulence
Annual average wind speed at
hub-height(m/s)
Extreme 50-year gust in
meters/second (miles/hour)
I A High wind - Higher Turbulence 18% 10.0 70 (156)
I B High wind - Lower Turbulence 16% 10.0 70 (156)
II A Medium wind - Higher Turbulence 18% 8.5 59.5 (133)
II B Medium wind - Lower Turbulence 16% 8.5 59.5 (133)
III A Low wind - Higher Turbulence 18% 7.5 52.5 (117)
III B Low wind - Lower Turbulence 16% 7.5 52.5 (117)
IV 6.0 42.0 (94)
18. Wind Power Conversion technologies
• There is a kinetic energy in the moving air. That is Wind
• P = ½ rAV3Cp
Where P = the power of the wind measured in W (Watt).
r = (rho) = the density of dry air = 1.225 measured in kg/m 3 (kilograms per cubic meter, at average atmospheric
pressure at sea level at 15° C).
v = the velocity of the wind measured in m/s (meters per second).
A= Area of the turbine in Square meters
Cp = Conversion Factor (or) Efficiency of the turbine
• The mechanical device which converts this kinetic energy to Mechanical
rotational energy is called Turbine
19. BETZ Limit
The lower the value of V2, the more energy extracted by the wind
turbine, the more is the efficiency.
So if V2 =0 , do we produce maximum power?
Max Theoretical Efficiency= 59% when V2/V1=1/3
23. Classification of turbines By Mechanical features
Turbine
direction
Vertical Horizontal
Wind
direction
UP
Wind
DOWN
Wind
Number of
blades
TWO
Blade
THREE
Blade
29. Generators - Asynchronous
Advantages:
1) These generators are nothing but the induction Motors
2) Very simple mechanism
3) There is no need of huge synchronizing and excitation
circuits
Disadvantages:
1) Draws inductive reactance from
grid causing low power factor
2) Requires power factor
correction circuit and Capacitors
3) Huge wear and tear
35. Generators - Synchronous
Advantages:
1) These generators can generate their own VAR
2) By changing excitation we can generate the power at leading
or lagging. No need of power factor correction capacitors
3) Wind mills with synchronous generators will have lesser cut-in
wind speed (they can generate power at low wind speed
also)
4) There is no need of huge gear boxes
5) In certain cases the Wind mills can be operated as stand
alone system of generation
Disadvantages:
1) These generators requires huge power electronic
support
2) Requires very sophisticated controls
36. The gear concept and gearless concept in a component
comparison
Main Shaft
Hub
Rotor Shaft
Bearings
Clutch
Gear Brake
Generator
Generator Rotor
Generator Stator
Hub
Main Bearing
Axle pin
Conventional Gearless
41. Wind Resourcing and Assessing
• wind mast with 2 sets of Anemometers & wind vanes at
different heights will be erected at the prospective site.
• Height of wind mast will be depending up of the class of the
site
• Wind Speed, Wind direction, Temperature and Pressure are
measured
• Measurement Period:
– In general : Minimum of 1 year!
– 3 to 5 years is ideal for better estimation of wind
climate prevailing at the site
Analysis of measured wind data will be the key to
• Select wind turbine type based on wind
resource
• Design wind farm layout based on site
conditions
• Calculate energy output
42. Key – outputs of WRA
REV07, 05-03-2014
Probability of
Exceedence
PLF(%)
P50 30.00
P75 26.78
P90 23.87
Vagarai Monthly % Distribution
Apr 2.7%
May 7.8%
Jun 18.4%
Jul 20.5%
Aug 18.1%
Sep 14.9%
Oct 2.4%
Nov 1.9%
Dec 2.1%
Jan 3.6%
Feb 4.6%
Mar 3.1%
Total 100.00%
Wind
rose
56. The epicenter of this report is to deal with the issues and challenges facing by all the stakeholders under this mechanism and aimed to provide a thought process for resolving
the difficulties aroused because of this mechanism in the sector.
in MW in %
Total Installed
Capacity
233930 100
Renewable
capacity Installed
29989 12.82
Wind 20149 8.61
Solar 2180 0.93
India is a rapidly growing economy which needs energy to meet its growth objectives in a
sustainable manner. The power generation from non-conventional sources like Wind and Solar
is an integral part of the energy system. The generation from wind and solar is depends upon
the nature with a benefit of being a clean energy source and a challenge of being an infirm
source of generation and to predict the generation for optimal management of electricity grid
increases manifold.
Indian Electricity Grid Code (IEGC) Regulation 2010 which was announced on 28th Apr 2010
identified this challenge. Origin of Forecasting & Scheduling of Wind and Solar power has
come through IEGC 2010 and introduced in the form of commercial implication mechanism
known as Renewable Regulatory Fund (RRF) which becomes the prime focus for the
Regulators.
Objective of IEGC to brings together:
- A single set of technical and commercial rules,
- Facilitation of the optimal operation of the grid,
- Facilitation for functioning of power markets,
- Facilitation of the development of renewable energy sources by specifying the technical and commercial aspects for
integration of these resources into the grid.
Instead of following the objectives first, the main focus moved towards the procedural implementation of RRF mechanism without understanding the facts of
technical and operational know-hows. The installation falls under RRF for forecasting and scheduling as per CERC order dated 16.01.2013 is not even 1% of
total installed capacity in the country.
“Does ensuing the 1% of wind/solar generation out of total installed capacity is the real motive?”
Answer is no…
Backdrop of RRF Mechanism
57. IEGC 2010
IWEA AND CERC PETITION - TASK
NLDC - DETAILED RRF PROCEDURE
SLDCS TO SUBMIT MOCK
EXERCISE DATA
FORCE FORMED
TASK FORCE SUBMITTED REPORT
TO CERC
COORDINATING AGENCY/
REFERENCE RATE INTRODUCED BY
CERC
CERC ACCORDED DETAILED RRF
PROCEDURE
NLDC - DRAFT DETAILED RRF
PROCEDURE
…. FILED APPEAL IN CHENNAI
RRF STARTED
HIGH COURT - MATTER
RRF COMMERCIAL MECHNAISM
SUSPENDED TILL FURTHER ORDERS
….FILED APPEAL IN DELHI HIGH
COURT
28th Apr
2010
18th Feb
2011
30th Nov
2011
27th Mar
2012
04th Sep
2012
16th Jan
2013
12th Jun
2013
09th Jul
2013
15th Jul
2013
07th Jan
2014
DATE MILESTONE
28th Apr 2010 IEGC 2010
18th Feb 2011 NLDC - Detailed RRF Procedure
30th Nov 2011 SLDCs to submit mock exercise data
27th Mar 2012 IWEA and CERC Petition - Task force formed
04th Sep 2012 Task force submitted report to CERC
16th Jan 2013 Coordinating Agency/ Reference Rate introduced by CERC
DATE MILESTONE
12th Jun 2013 NLDC - Draft Detailed RRF Procedure
09th Jul 2013 CERC accorded Detailed RRF Procedure
15th Jul 2013 RRF started
… . Filed appeal in Chennai High Court - Matter
… .Filed appeal in Delhi high Court
07th Jan 2014 RRF Commercial Mechnaism suspended till further orders
RRF Timeline
58. Commercial Settlement Overview
Dev %
range
0 - 30 30 - 50 > 50 -30 - 0 < -30
0 – 30 yes - - - -
30 – 50 yes yes - - -
> 50 yes yes yes - -
-30 – 0 - - - yes -
< -30 - - - yes yes
Dev %
range
0 - 30 30 -50 > 50 -30 - 0 < -30
0 – 30 A - - - -
30 – 50 A B - - -
> 50 A B C - -
-30 – 0 - - - A -
< -30 - - - A B
Commercial
Settlement
• A. PPA rate – settled by Utility
• B. PPA rate – settled by Utility + UI charges w.r.t. frequency settled through RRF
• C. UI @ 50 Hz – settled through RRF
59. Wind Power Scheduling Challenges
Wind Power Forecasting
Communicate forecasted and
actual data with SLDC
Adaptation of “Availability based tariff”
Liability of inaccurate forecasts
• Wind power forecast technology is
not advanced.
• Forecast does not meet the
required accuracy limits.
• Security issues in data
communication
• Installation of ABT meters at
pooling stations
• Most plants in rural areas
• Will make the existing projects
signed under PT and APPC + REC
unviable.
• Will adversely effect the growth of
wind industry in India.
• No forecasting agency or
coordinating agency promises
accurate forecast.