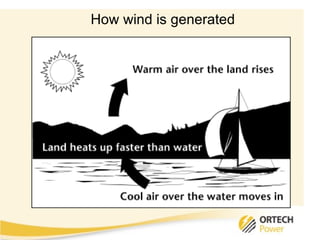
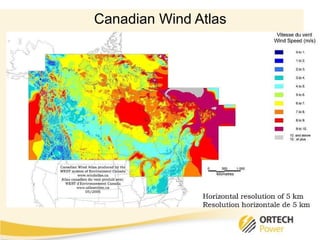
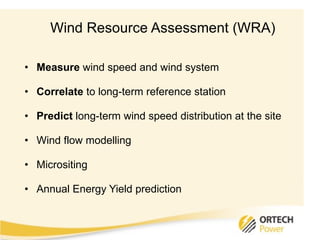
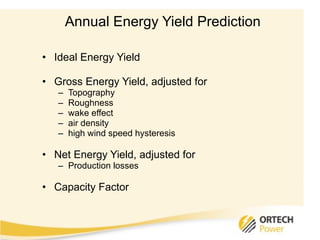
Wind Resource Assessment Wind   Farm Development, Design, Operation and Maintenance EPIC Course  January 27-29, 2010, Edmonton Don McKay, ORTECH Power
Wind Resource Assessment How Wind is Generated Wind Atlas Wind Speed Characteristics Accessing the Resource Project Assessment Energy Estimation Uncertainty
How wind is generated
Canadian Wind Atlas
 
Power available in the wind is P = ½  ρ   π   R 2  v 3 Power is very sensitive to wind speed ->  Accurate wind speed measurements are critical
Example Wind speed of 8 m/s  vs  8.2 m/s = 2.5% difference in wind speed = 7.7% increase in power, theoretically = 5% increase in power, realistically
Example (cont’d) For a 100 MW wind farm, this could mean 300 GWh/yr  vs  315 GWh/yr = difference of $1,500,000 (assuming $0.10/kWh)
Example (cont’d) Moral: WRA program designed for maximum accuracy is critical to the success of your wind farm Overpredict: impacts shareholders, credibility Underpredict: impacts financing opportunities
Wind Resource Assessment (WRA) Measure  wind speed and wind system Correlate  to long-term reference station Predict  long-term wind speed distribution at the site Wind flow modelling Micrositing Annual Energy Yield prediction
Measure -Correlate-Predict Measure wind data Install met tower with wind monitoring instruments Collect wind data QC/QA wind data Analyse wind data
(DEWI) Meteorological Mast (Wind monitoring tower)
R. M. Young Wind Monitor Features Propeller-type anemometer with fuselage and tail wind vane  Rugged design for use in a variety of climates worldwide  Manufactured by R. M. Young Specifications Wind Speed  Range: 0-134 mph (0-60 m/s)  Accuracy: ±0.6 mph (0.3 m/s)  Starting threshold: 2.2 mph (1.0 m/s)  Gust survival: 220 mph (100 m/s)  Wind Direction  Range: 0-360° mechanical, 355° electrical (5° open)  Accuracy: ±3° Starting threshold at 10° displacement: 2.2 mph (1.1 m/s)
CR800 Measurement and Control Datalogger Features Ideal datalogger where only a few sensors will be measured  Stores 4 Mbytes of data and programming in SRAM  Data format is table  Operating system: PakBus®  Software support offered in LoggerNet or PC400 (full-featured) or ShortCut (programming)  Detachable keyboard/display, the CR1000KD, can be carried to multiple stations  Supports Modbus protocol, SDI-12 protocol, and SDM devices Specifications Analog inputs: 6 single-ended or 3 differential, individually configured  Pulse counters: 2  Switched voltage excitations: 2  Control/digital ports: 4  Scan rate: 100 Hz  Analog voltage resolution: to 0.33 µV  A/D bits: 13
Neutral conditions -> logarithmic wind profile (<100m) Logarithmic Wind Profile Height above surface (m)
Power Law Profile - use wind speed measurements at two heights to find  α - then use  a  to calculate wind speed at hub height α   is the power law exponent (wind shear exponent) u R  is the wind speed at height  z r
Wind Speed Frequency Distribution
Wind Direction Distribution (Wind Rose)
Measure- Correlate-Predict Correlate to long-term reference stations 12 months of measured site data recommended Find appropriate long-term reference stations Determine correlation between site data and reference stations for a concurrent period Determine long-term wind data set for site Predict long-term windspeed distribution at the site (i.e. at the location of the met mast)
Long term observation of wind speed
Wind flow modelling Input predicted long-term wind data into wind flow model (e.g. WAsP) Input digital terrain data (topographic data, vegetation data) Output wind flow map over site
 
(DEWI) Typical Wind Speed Map
Micrositing Purpose: design turbine layout optimized on energy production, minimized on wake losses Input wind flow map Input terrain data Input site constraints Site boundary Setbacks for: roads, buildings, environmental constraints (wetlands, migratory routes), wooded areas, water bodies/courses Noise restrictions Visual impact Input number of turbines, turbine specs, turbine constraints Nameplate capacity, hub height, rotor diameter Power curve Thrust coefficient RPM Maximum slope for turbine Turbine spacing
Basic Parameters for IEC – WTG classes
Power Curve
Turbine Layout
Annual Energy Yield Prediction Ideal Energy Yield Gross Energy Yield, adjusted for Topography Roughness wake effect air density high wind speed hysteresis  Net Energy Yield, adjusted for Production losses Capacity Factor
Production Losses WTG availability Planned maintenance Icing & cold temperature related losses Grid & substation Grid availability Blade soiling High wind hysteresis
Example – Annual Energy Yield Prediction for 100 MW wind park Ideal energy yield: 867.8 GWh/yr Gross energy yield: 350 GWh/yr Production Losses: 10% Net energy yield: 315 GWh/yr Capacity Factor: 36%
P50 Previous example: Annual Energy Yield = 315 GWh/yr = P50 P50:  statistical mean or the probability that this value will be exceeded 50%   Actual annual energy production will vary from the P50 in direct proportion to the uncertainty
Uncertainties
Conclusions Project viability depends on the wind resource Wind conditions are site specific Wind data vary with time and height Accuracy is critical Carefully assess uncertainties Good financing terms depends on a WRA program that has been designed for maximum accuracy
Questions?

Wind Resource Assessment

  • 1.
    Wind Resource AssessmentWind Farm Development, Design, Operation and Maintenance EPIC Course January 27-29, 2010, Edmonton Don McKay, ORTECH Power
  • 2.
    Wind Resource AssessmentHow Wind is Generated Wind Atlas Wind Speed Characteristics Accessing the Resource Project Assessment Energy Estimation Uncertainty
  • 3.
    How wind isgenerated
  • 4.
  • 5.
  • 6.
    Power available inthe wind is P = ½ ρ π R 2 v 3 Power is very sensitive to wind speed -> Accurate wind speed measurements are critical
  • 7.
    Example Wind speedof 8 m/s vs 8.2 m/s = 2.5% difference in wind speed = 7.7% increase in power, theoretically = 5% increase in power, realistically
  • 8.
    Example (cont’d) Fora 100 MW wind farm, this could mean 300 GWh/yr vs 315 GWh/yr = difference of $1,500,000 (assuming $0.10/kWh)
  • 9.
    Example (cont’d) Moral:WRA program designed for maximum accuracy is critical to the success of your wind farm Overpredict: impacts shareholders, credibility Underpredict: impacts financing opportunities
  • 10.
    Wind Resource Assessment(WRA) Measure wind speed and wind system Correlate to long-term reference station Predict long-term wind speed distribution at the site Wind flow modelling Micrositing Annual Energy Yield prediction
  • 11.
    Measure -Correlate-Predict Measurewind data Install met tower with wind monitoring instruments Collect wind data QC/QA wind data Analyse wind data
  • 12.
    (DEWI) Meteorological Mast(Wind monitoring tower)
  • 13.
    R. M. YoungWind Monitor Features Propeller-type anemometer with fuselage and tail wind vane Rugged design for use in a variety of climates worldwide Manufactured by R. M. Young Specifications Wind Speed Range: 0-134 mph (0-60 m/s) Accuracy: ±0.6 mph (0.3 m/s) Starting threshold: 2.2 mph (1.0 m/s) Gust survival: 220 mph (100 m/s) Wind Direction Range: 0-360° mechanical, 355° electrical (5° open) Accuracy: ±3° Starting threshold at 10° displacement: 2.2 mph (1.1 m/s)
  • 14.
    CR800 Measurement andControl Datalogger Features Ideal datalogger where only a few sensors will be measured Stores 4 Mbytes of data and programming in SRAM Data format is table Operating system: PakBus® Software support offered in LoggerNet or PC400 (full-featured) or ShortCut (programming) Detachable keyboard/display, the CR1000KD, can be carried to multiple stations Supports Modbus protocol, SDI-12 protocol, and SDM devices Specifications Analog inputs: 6 single-ended or 3 differential, individually configured Pulse counters: 2 Switched voltage excitations: 2 Control/digital ports: 4 Scan rate: 100 Hz Analog voltage resolution: to 0.33 µV A/D bits: 13
  • 15.
    Neutral conditions ->logarithmic wind profile (<100m) Logarithmic Wind Profile Height above surface (m)
  • 16.
    Power Law Profile- use wind speed measurements at two heights to find α - then use a to calculate wind speed at hub height α is the power law exponent (wind shear exponent) u R is the wind speed at height z r
  • 17.
  • 18.
  • 19.
    Measure- Correlate-Predict Correlateto long-term reference stations 12 months of measured site data recommended Find appropriate long-term reference stations Determine correlation between site data and reference stations for a concurrent period Determine long-term wind data set for site Predict long-term windspeed distribution at the site (i.e. at the location of the met mast)
  • 20.
    Long term observationof wind speed
  • 21.
    Wind flow modellingInput predicted long-term wind data into wind flow model (e.g. WAsP) Input digital terrain data (topographic data, vegetation data) Output wind flow map over site
  • 22.
  • 23.
  • 24.
    Micrositing Purpose: designturbine layout optimized on energy production, minimized on wake losses Input wind flow map Input terrain data Input site constraints Site boundary Setbacks for: roads, buildings, environmental constraints (wetlands, migratory routes), wooded areas, water bodies/courses Noise restrictions Visual impact Input number of turbines, turbine specs, turbine constraints Nameplate capacity, hub height, rotor diameter Power curve Thrust coefficient RPM Maximum slope for turbine Turbine spacing
  • 25.
    Basic Parameters forIEC – WTG classes
  • 26.
  • 27.
  • 28.
    Annual Energy YieldPrediction Ideal Energy Yield Gross Energy Yield, adjusted for Topography Roughness wake effect air density high wind speed hysteresis Net Energy Yield, adjusted for Production losses Capacity Factor
  • 29.
    Production Losses WTGavailability Planned maintenance Icing & cold temperature related losses Grid & substation Grid availability Blade soiling High wind hysteresis
  • 30.
    Example – AnnualEnergy Yield Prediction for 100 MW wind park Ideal energy yield: 867.8 GWh/yr Gross energy yield: 350 GWh/yr Production Losses: 10% Net energy yield: 315 GWh/yr Capacity Factor: 36%
  • 31.
    P50 Previous example:Annual Energy Yield = 315 GWh/yr = P50 P50: statistical mean or the probability that this value will be exceeded 50% Actual annual energy production will vary from the P50 in direct proportion to the uncertainty
  • 32.
  • 33.
    Conclusions Project viabilitydepends on the wind resource Wind conditions are site specific Wind data vary with time and height Accuracy is critical Carefully assess uncertainties Good financing terms depends on a WRA program that has been designed for maximum accuracy
  • 34.

Editor's Notes

  • #17 power law should be carefully employed since it is not a physical representation of the surface layer and does not describe the flow nearest to the ground very well (i.e. should only be used for heights above the roughness elements where the flow is free)