Rallis Result Update
•
1 like•202 views

Rallis India reported a 14% increase in sales and 151% increase in profits for the fourth quarter of fiscal year 2010, in line with analyst estimates. Strong demand from farmers during the Rabi season and a 1000 basis point expansion in operating margins from 10% to 20% drove results. For the full fiscal year, Rallis saw a path-breaking performance with net sales growth of 5.2% and profit growth of 45.9% despite a drought in India and lower export prices for commodities. Going forward, analysts expect continued strong growth over the next few years supported by high agro-commodity prices and the upcoming commissioning of a new export facility.

Recommended
More Related Content
What's hot
What's hot (20)
Viewers also liked
Viewers also liked (19)
Similar to Rallis Result Update
Similar to Rallis Result Update (20)
More from Angel Broking
More from Angel Broking (20)
Rallis Result Update
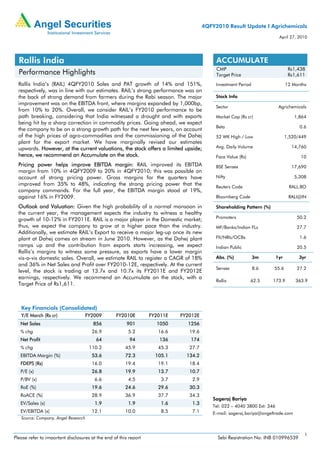
- 1. 4QFY2010 Result Update I Agrichemicals April 27, 2010 Rallis India ACCUMULATE CMP Rs1,438 Performance Highlights Target Price Rs1,611 Rallis India’s (RAIL) 4QFY2010 Sales and PAT growth of 14% and 151%, Investment Period 12 Months respectively, was in line with our estimates. RAIL’s strong performance was on the back of strong demand from farmers during the Rabi season. The major Stock Info improvement was on the EBITDA front, where margins expanded by 1,000bp, Sector Agrichemicals from 10% to 20%. Overall, we consider RAIL’s FY2010 performance to be path breaking, considering that India witnessed a drought and with exports Market Cap (Rs cr) 1,864 being hit by a sharp correction in commodity prices. Going ahead, we expect Beta 0.6 the company to be on a strong growth path for the next few years, on account of the high prices of agro-commodities and the commissioning of the Dahej 52 WK High / Low 1,520/449 plant for the export market. We have marginally revised our estimates upwards. However, at the current valuations, the stock offers a limited upside; Avg. Daily Volume 14,760 hence, we recommend an Accumulate on the stock. Face Value (Rs) 10 Pricing power helps improve EBITDA margin: RAIL improved its EBITDA BSE Sensex 17,690 margin from 10% in 4QFY2009 to 20% in 4QFY2010; this was possible on account of strong pricing power. Gross margins for the quarters have Nifty 5,308 improved from 35% to 48%, indicating the strong pricing power that the Reuters Code RALL.BO company commands. For the full year, the EBITDA margin stood at 19%, against 16% in FY2009. Bloomberg Code RALI@IN Outlook and Valuation: Given the high probability of a normal monsoon in Shareholding Pattern (%) the current year, the management expects the industry to witness a healthy growth of 10-12% in FY2011E. RAIL is a major player in the Domestic market; Promoters 50.2 thus, we expect the company to grow at a higher pace than the industry. MF/Banks/Indian FLs 27.7 Additionally, we estimate RAIL’s Export to receive a major leg-up once its new plant at Dahej comes on stream in June 2010. However, as the Dahej plant FII/NRIs/OCBs 1.6 ramps up and the contribution from exports starts increasing, we expect Indian Public 20.5 Rallis’s margins to witness some pressure, as exports have a lower margin vis-a-vis domestic sales. Overall, we estimate RAIL to register a CAGR of 18% Abs. (%) 3m 1yr 3yr and 36% in Net Sales and Profit over FY2010-12E, respectively. At the current Sensex 8.6 55.6 27.2 level, the stock is trading at 13.7x and 10.7x its FY2011E and FY2012E earnings, respectively. We recommend an Accumulate on the stock, with a Rallis 62.5 173.9 363.9 Target Price of Rs1,611. Key Financials (Consolidated) Y/E March (Rs cr) FY2009 FY2010E FY2011E FY2012E Net Sales 856 901 1050 1256 % chg 26.9 5.2 16.6 19.6 Net Profit 64 94 136 174 % chg 110.2 45.9 45.3 27.7 EBITDA Margin (%) 53.6 72.3 105.1 134.2 FDEPS (Rs) 16.0 19.4 19.1 18.4 P/E (x) 26.8 19.9 13.7 10.7 P/BV (x) 6.6 4.5 3.7 2.9 RoE (%) 19.6 24.6 29.6 30.3 RoACE (%) 28.9 36.9 37.7 34.3 Sageraj Bariya EV/Sales (x) 1.9 1.9 1.6 1.3 Tel: 022 – 4040 3800 Ext: 346 EV/EBITDA (x) 12.1 10.0 8.5 7.1 E-mail: sageraj.bariya@angeltrade.com Source: Company, Angel Research 1 Please refer to important disclosures at the end of this report Sebi Registration No: INB 010996539
- 2. Rallis I 4QFY2010 Result Update Exhibit 1: 4QFY2010 Performance (Consolidated) Y/E March (Rs cr) 4Q2010 4Q2009 % chg FY2010 FY2009 % chg Total Revenue 2029 1782 13.9 9005 8562 5.2 Total RM 1050 1164 (9.7) 5055 5072 (0.3) as % of sales 52 65 56 59 Gross Profit 979 618 58.4 3950 3490 13.2 Gross margin (%) 48 35 44 41 Staff cost 142 140 0.9 673 669 0.6 as % of sales 7 8 7 8 Other Expenses 432 301 43.4 1528 1454 5.0 as % of sales 21 17 17 17 Total Exp 1624 1605 1.2 7256 7195 0.8 as % of sales 80 90 81 84 EBITDA 406 177 129.6 1750 1367 28.0 EBITDA % 20.0 9.9 19.4 16.0 346.4 Depreciation 68 52 31.4 183 229 (20.2) EBIT 338 125 170.2 1567 1137 37.7 EBIT % 17 7 17 13 Other Income 16 14 19.9 66 29 126.1 Interest* 5 6 (5.5) 100 108 (7.4) PBT 349 133 162.1 1533 1059 44.8 Extra-ord Items (13) 18 (171.8) (83) (64) 29.5 PBT 362 115 214.6 1450 995 45.7 Total tax 113 16 608.8 512 352 45.4 tax rate 33 12 33 33 PAT 248 99 150.9 938 643 45.9 NPM (%) 12.2 5.6 10.4 6.0 Equity 130 120 130 120 EPS 19 8 72 54 Source: Company, Angel Research. Note * - Full year numbers are adjusted for preference dividend Key highlights for FY2010 performance RAIL’s gross margins have been steadily improving, from a low of 35% in FY2007 to 44% at the end of FY2010, an improvement of 800bp over 3 years. Moreover, it improved by 300bp from FY2009 to FY2010, when India faced a drought situation. We believe that this indicates the strong pricing power that Rallis commands in the domestic market. Exhibit 2: Improving gross margin indicating strong pricing power 45 20 42 15 (%) (%) 39 10 36 5 33 0 FY2006 FY2007 FY2008 FY2009 FY2010 Gross margin (LHS) EBITDA Margin (RHS) Source: Company, Angel Research RAIL’s cost reduction plan has been visible through the closure of its Hyderabad plant and a low growth in other costs. Some of the indicators pointing towards cost- control measures are: Staff costs and other costs for FY2010 increased by a mere 0.6% and 5%, respectively. April 27, 2010 2
- 3. Rallis I 4QFY2010 Result Update Key takeaways from the management meet • The domestic pesticides industry grew by 10-12% in value terms, while volumes grew at a slightly higher pace. With RAIL being a key player in the domestic market, we expect it to outperform industry growth and believe that its domestic business has grown in the range of 19-25% in FY2010. • Some of the key agricultural states that had a high share of migrant workers have witnessed a good demand for herbicides. After the introduction of the National Rural Employment Guarantee Scheme (NREG), the availability of cost- effective labour has reduced. This, in turn, has increased the demand for Herbicides. • RAIL had launched a new product (fungicide) under the brand name ‘Ergon’ in 2QFY2010. The key differentiating factor for this product is that it offers crop protection and yield enhancement. The market has received the product well and the company continues to promote it strongly. We expect ‘Ergon’ to be one of the best brands in the company’s portfolio within the next three years. • Overall, the company is targeting strong growth in the domestic market, with dominant market share. Other developments The Company has announced a final dividend of Rs10/share for FY2010; this is in addition to the interim dividend of Rs8/share declared earlier. The company has also recommended an issuance of bonus shares (1 share for every 2 held). April 27, 2010 3
- 4. Rallis I 4QFY2010 Result Update Outlook and Valuation We have marginally revised our estimates upward for FY2011E and FY2012E. We expect the company to maintain its EBITDA margin at 19% in FY2011E; however, with the ramp-up in the Dahej facility and with the increasing contribution from low- margin exports, we expect the blended EBITDA margin to reduce in FY2012E. However, we expect the company to maintain its PAT margin, due to a reduction in the interest outflow (as debt would be redeemed on the back of higher cash generation from operations), better working capital management and a lower tax rate (EOU status for the Dahej unit). We have increased our EPS estimates by 9% and 10% for FY2011E and FY2012E, respectively. Exhibit 3: Revised Estimates Rs cr Old New % chg FY2011E FY2012E FY2011E FY2012E FY2011E FY2012E Sales 982 1130 1050 1256 7 11 EBITDA 188 214 201 231 7 8 EBITDA % 19 19 19 18 PAT 125 158 136 174 9 10 EPS 96 122 105 134 9 10 Source: Company, Angel Research At the CMP, the stock is trading at 13.7x and 10.7x its FY2011E and FY2012E Earnings, respectively. Given its limited upside potential, we recommend an Accumulate on the stock, with a Target Price of Rs1,611 (Rs1,464 earlier). Exhibit 4: One year forward P/E band 2,000 1,800 17x 1,600 14x 1,400 Share Price (Rs) 11x 1,200 1,000 8x 800 600 5x 400 200 0 Apr-04 Apr-05 Apr-06 Apr-07 Apr-08 Apr-09 Apr-10 Oct-04 Oct-05 Oct-06 Oct-07 Oct-08 Oct-09 Source: Company, Angel Research April 27, 2010 4
- 5. Rallis I 4QFY2010 Result Update Profit & Loss Statement (Consolidated) (Rs Cr) Y/E March FY2007 FY2008 FY2009 FY2010 FY2011E FY2012E Gross sales 675 743 930 959 1,124 1,344 Less: Excise duty 58 69 74 58 74 88 Net Sales 617 675 856 901 1,050 1,256 Other operating income - - - - - - Total operating income 617 675 856 901 1,050 1,256 % chg 4.2 9.4 26.9 5.2 16.6 19.6 Total Expenditure 603 615 719 726 850 1,025 Net Raw Materials 401 411 507 506 604 735 Other Mfg costs 138 134 134 153 147 160 Personnel 55 62 67 67 88 105 Other 9 9 11 - 11 25 EBITDA 13 59 137 175 201 231 % chg (56.0) 340.6 131.2 28.0 14.7 15.2 (% of Net Sales) 2.2 8.8 16.0 19.4 19.1 18.4 Depreciation& Amortisation 31 20 23 18 23 28 EBIT (18) 39 114 157 178 203 % chg (227.9) - 191.3 37.7 13.3 14.5 (% of Net Sales) - 5.8 13.3 17.4 16.9 16.2 Interest & other Charges 19 12 11 10 0 - Other Income 84 112 3 7 24 24 (% of PBT) 176 81 3 4 12 11 Recurring PBT 48 139 106 153 202 228 % chg 30.0 190.4 (23.6) 44.8 31.6 12.8 Extraordinary Expense/(Inc.) (57) (87) (6) (8) - - PBT (reported) (9) 52 100 145 202 228 Tax (3) 21 35 51 65 54 (% of PBT) (6.5) 15.2 33.3 33.4 32.4 23.6 PAT (reported) (6) 31 64 94 136 174 Add: Share of earnings of associate - - - - - - Less: Minority interest (MI) - - - - - - Prior period items - - - - - - PAT after MI (reported) (6) 31 64 94 136 174 ADJ. PAT (6) 31 64 94 136 174 % chg (116.0) - 110.2 45.9 45.3 27.7 (% of Net Sales) - 3.9 7.5 10.3 12.7 13.6 Basic EPS (Rs) - 26 54 72 105 134 Fully Diluted EPS (Rs) - 26 54 72 105 134 % chg - - 110.2 34.9 45.3 27.7 April 27, 2010 5
- 6. Rallis I 4QFY2010 Result Update Balance Sheet (Consolidated) (Rs Cr) Y/E March FY2007 FY2008 FY2009 FY2010E FY2011E FY2012E SOURCES OF FUNDS Equity Share Capital 12 12 12 13 13 13 Preference Capital 88 88 88 - - - Reserves& Surplus 112 208 250 399 497 624 Shareholders Funds 212 308 350 412 510 637 Minority Interest - - - - - - Total Loans 36 47 82 4 - - Deferred Tax Liability - - - 2 15 23 Total Liabilities 248 354 432 417 524 660 APPLICATION OF FUNDS Gross Block 285 296 338 339 484 508 Less: Acc. Depreciation 146 161 179 197 220 248 Net Block 139 135 159 142 264 260 Capital Work-in-Progress 5 13 29 137 18 18 Goodwill Investments 32 56 136 99 99 99 Current Assets Cash 23 8 8 14 61 129 Loans & Advances 75 79 77 72 84 113 Other 218 250 266 248 332 437 Current liabilities 258 201 261 294 332 395 Net Current Assets 58 137 91 39 145 284 Mis. Exp. not written off 12 13 10 - - - Total Assets 248 354 432 417 524 660 Cash Flow (Consolidated) (Rs Cr) Y/E March FY2007 FY2008 FY2009 FY2010E FY2011E FY2012E Profit before tax 55 146 107 162 202 228 Depreciation 31 20 23 18 23 28 Change in Working Capital (26) (185) 40 59 (64) (77) Less: Other income Direct taxes paid (17) (26) (31) (45) (58) (47) Cash Flow from Operations 44 (45) 139 194 103 131 (Inc.)/ Dec. in Fixed Assets 47 63 (64) (110) (25) (24) (Inc.)/ Dec. in Investments 20 (21) (78) (38) - - Inc./ (Dec.) in loans and advances Other income Cash Flow from Investing 67 42 (142) (72) (25) (24) Issue of Equity - - - (5) - - Inc./(Dec.) in loans (78) 11 37 (79) (4) - Dividend Paid (Incl. Tax) (13) (19) (30) (22) (27) (38) Others (11) (4) (3) (10) (0) - Cash Flow from Financing (102) (13) 3 (116) (31) (38) Inc./(Dec.) in Cash 9 (15) (0) 6 47 69 Opening Cash balances 13 23 8 8 14 61 Closing Cash balances 22 8 8 14 61 129 April 27, 2010 6
- 7. Rallis I 4QFY2010 Result Update Key Ratios (Rs Cr) Y/E March FY2007 FY2008 FY2009 FY2010E FY2011E FY2012E Valuation Ratio (x) P/E (on FDEPS) - 56.3 26.8 19.9 13.7 10.7 P/CEPS 69.5 34.0 19.7 16.6 11.7 9.2 P/BV 13.9 7.8 6.6 4.5 3.7 2.9 Dividend yield (%) 0.6 1.1 1.1 1.3 1.7 2.2 EV/Sales 2.8 2.5 1.9 1.9 1.6 1.3 EV/EBITDA 126.9 28.8 12.1 10.0 8.5 7.1 EV / Total Assets 6.9 4.8 3.8 4.2 3.2 2.5 Per Share Data (Rs) EPS (Basic) - 25.5 53.6 72.3 105.1 134.2 EPS (fully diluted) - 25.5 53.6 72.3 105.1 134.2 Cash EPS 20.7 42.3 72.8 86.5 122.9 155.7 DPS 8.0 16.0 16.0 18.0 25.0 31.0 Book Value 103.6 183.4 218.4 317.4 393.3 491.2 Dupont Analysis EBIT margin - 5.8 13.3 17.4 16.9 16.2 Tax retention ratio 106.5 84.8 66.7 66.6 67.6 76.4 Asset turnover (x) 5.5 2.4 2.6 2.8 2.9 2.9 ROIC (Post-tax) - 11.6 22.9 32.0 32.9 36.3 Cost of Debt (Post Tax) 12.1 8.9 3.2 5.3 5.4 - Leverage (x) 0.4 0.2 - - - - Operating ROE - 12.1 22.9 32.0 32.9 36.3 Returns (%) ROCE (Pre-tax) - 13.0 28.9 36.9 37.7 34.3 Angel ROIC (Pre-tax) - 11.3 35.8 46.8 45.0 44.0 ROE - 11.8 19.6 24.6 29.6 30.3 Turnover ratios (x) Asset Turnover (Gross Block) 2.2 2.3 2.7 2.7 2.6 2.5 Inventory / Sales (days) 80.0 74.3 63.3 57.7 56.1 62.2 Receivables (days) 52.4 52.0 46.4 46.0 44.3 47.4 Payables (days) 122.5 104.9 85.7 104.3 99.7 96.8 Working capital cycle (ex-cash) (days) 26.1 44.1 45.1 22.0 19.0 34.7 Solvency ratios (x) Net debt to equity 0.4 0.2 - - - - Net debt to EBITDA 3.4 0.8 - - - - Interest Coverage (EBIT / Interest) - 3.2 10.6 15.7 - - April 27, 2010 7
- 8. Rallis I 4QFY2010 Result Update Research Team Tel: 022-4040 3800 E-mail: research@angeltrade.com Website: www.angeltrade.com DISCLAIMER This document is solely for the personal information of the recipient, and must not be singularly used as the basis of any investment decision. Nothing in this document should be construed as investment or financial advice. Each recipient of this document should make such investigations as they deem necessary to arrive at an independent evaluation of an investment in the securities of the companies referred to in this document (including the merits and risks involved), and should consult their own advisors to determine the merits and risks of such an investment. Angel Securities Limited, its affiliates, directors, its proprietary trading and investment businesses may, from time to time, make investment decisions that are inconsistent with or contradictory to the recommendations expressed herein. The views contained in this document are those of the analyst, and the company may or may not subscribe to all the views expressed within. Reports based on technical and derivative analysis center on studying charts of a stock's price movement, outstanding positions and trading volume, as opposed to focusing on a company's fundamentals and, as such, may not match with a report on a company's fundamentals. The information in this document has been printed on the basis of publicly available information, internal data and other reliable sources believed to be true, and is for general guidance only. Angel Securities Limited has not independently verified all the information contained within this document. Accordingly, we cannot testify, nor make any representation or warranty, express or implied, to the accuracy, contents or data contained within this document. While Angel Securities Limited endeavours to update on a reasonable basis the information discussed in this material, there may be regulatory, compliance, or other reasons that prevent us from doing so. This document is being supplied to you solely for your information, and its contents, information or data may not be reproduced, redistributed or passed on, directly or indirectly. Angel Securities Limited and its affiliates may seek to provide or have engaged in providing corporate finance, investment banking or other advisory services in a merger or specific transaction to the companies referred to in this report, as on the date of this report or in the past. Neither Angel Securities Limited, nor its directors, employees or affiliates shall be liable for any loss or damage that may arise from or in connection with the use of this information. Note: Please refer to the important `Stock Holding Disclosure' report on the Angel website (Research Section). Disclosure of Interest Statement Rallis 1. Analyst ownership of the stock No 2. Angel and its Group companies ownership of the stock No 3. Angel and its Group companies’ Directors ownership of the stock No 4. Broking relationship with company covered No Note: We have not considered any Exposure below Rs 1 lakh for Angel and its Group companies. . Address: Acme Plaza, ‘A’ Wing, 3rd Floor, M.V. Road, Opp. Sangam Cinema, Andheri (E), Mumbai - 400 059. Tel : (022) 3952 4568 / 4040 3800 Angel Broking Ltd: BSE Sebi Regn No : INB 010996539 / CDSL Regn No: IN - DP - CDSL - 234 - 2004 / PMS Regn Code: PM/INP000001546 Angel Securities Ltd:BSE: INB010994639/INF010994639 NSE: INB230994635/INF230994635 Membership numbers: BSE 028/NSE:09946 Angel Capital & Debt Market Ltd: INB 231279838 / NSE FNO: INF 231279838 / NSE Member code -12798 Angel Commodities Broking (P) Ltd: MCX Member ID: 12685 / FMC Regn No: MCX / TCM / CORP / 0037 NCDEX : Member ID 00220 / FMC Regn No: NCDEX / TCM / CORP / 0302 April 27, 2010 8