Download to read offline
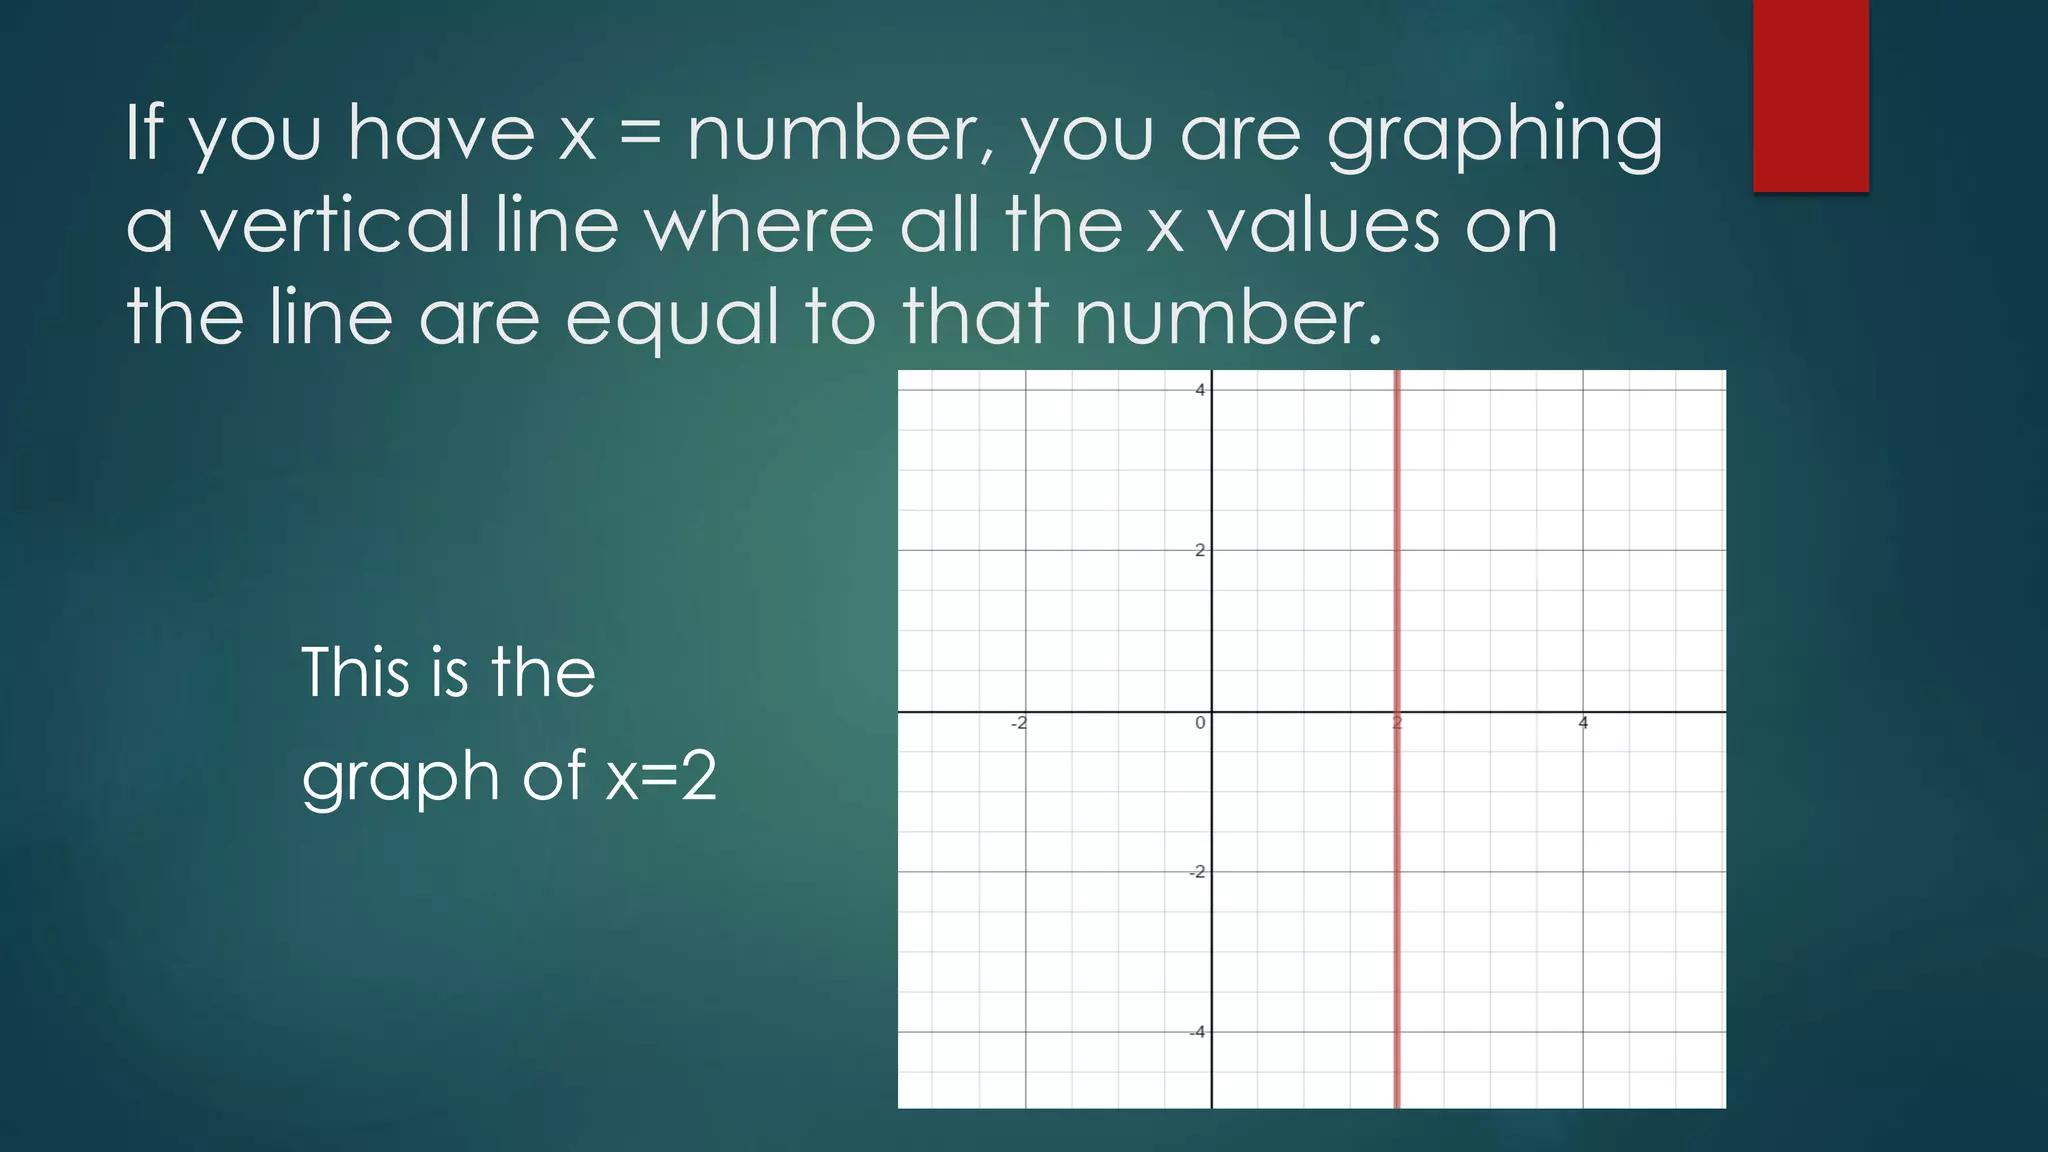
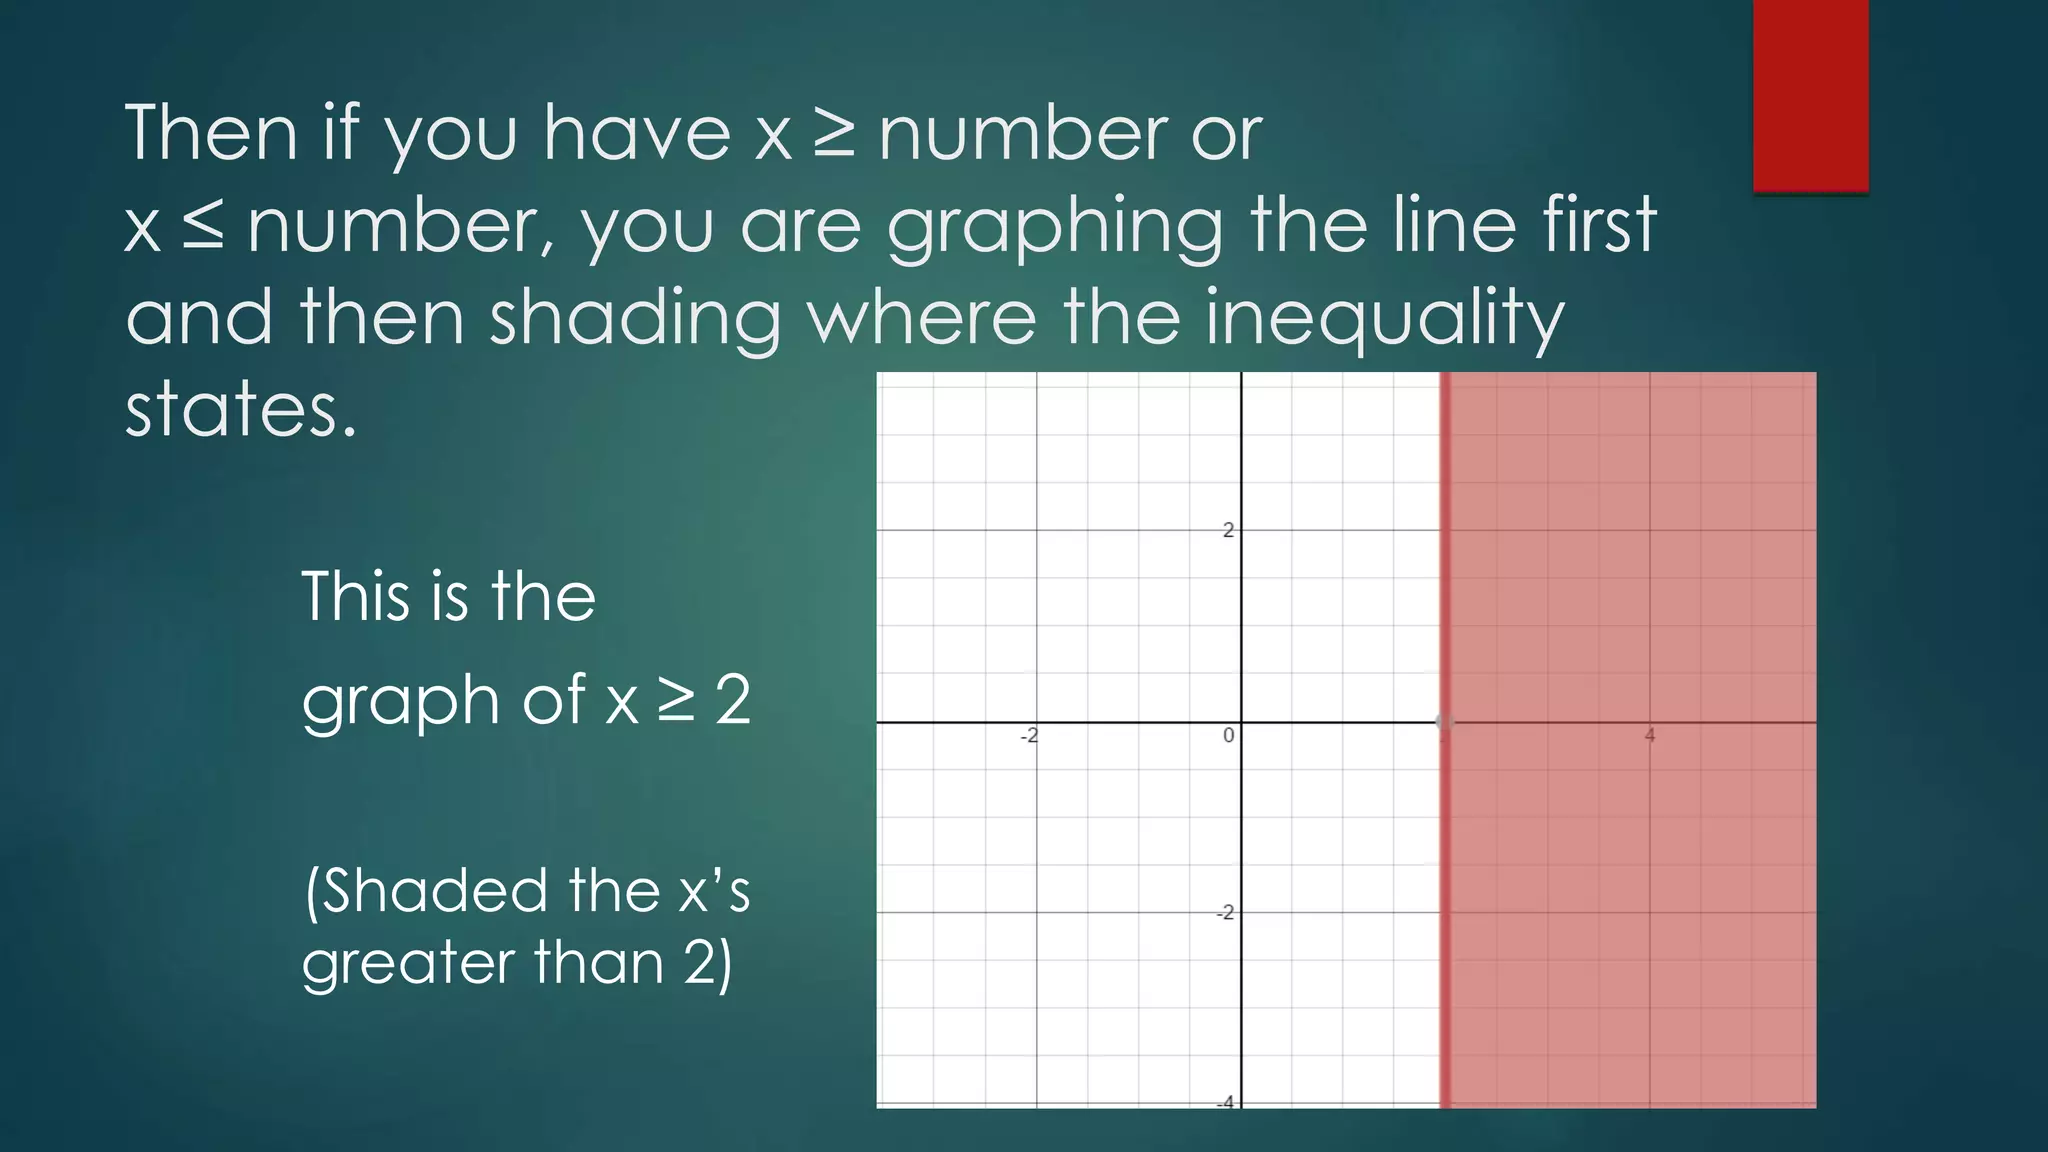
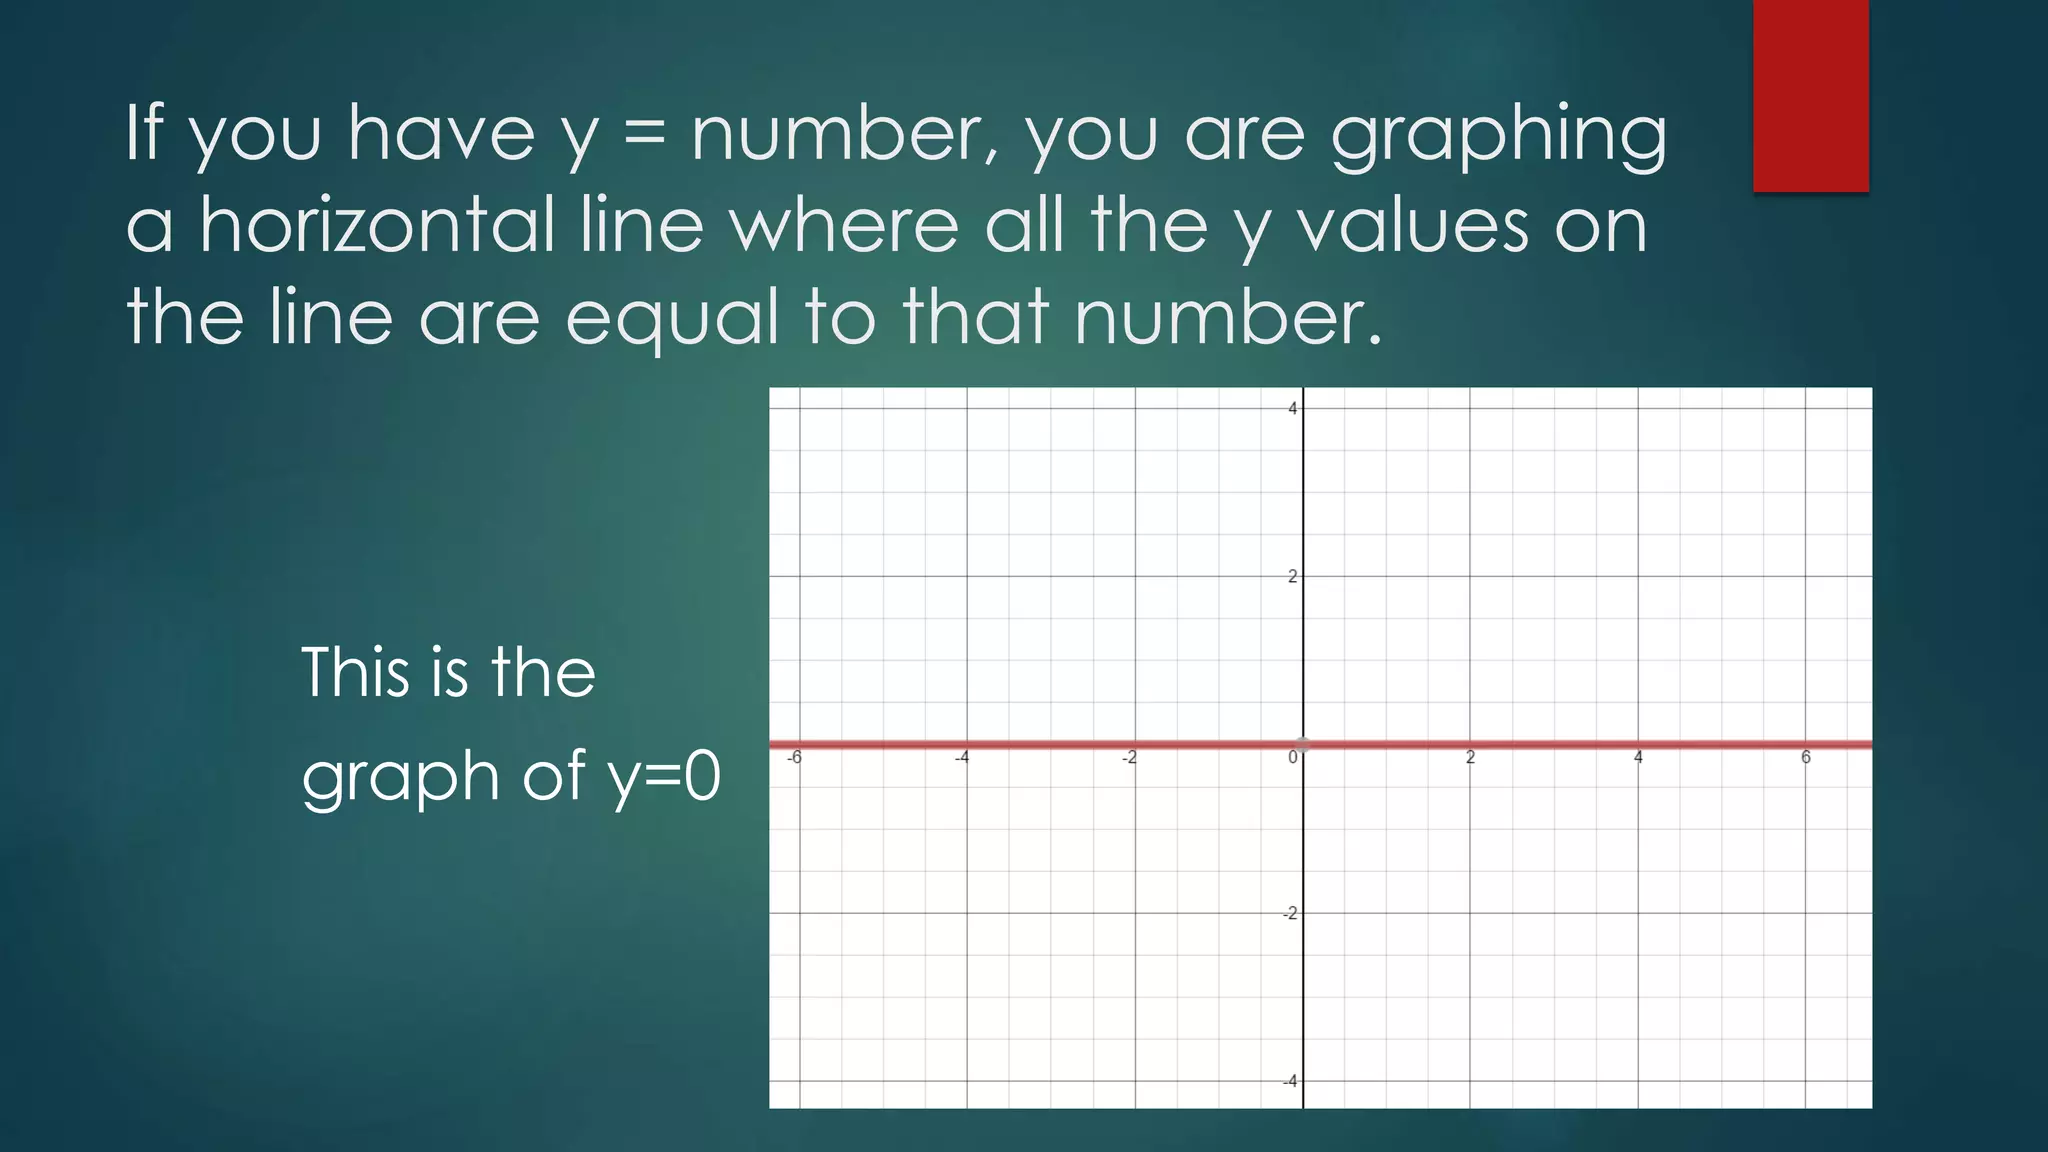
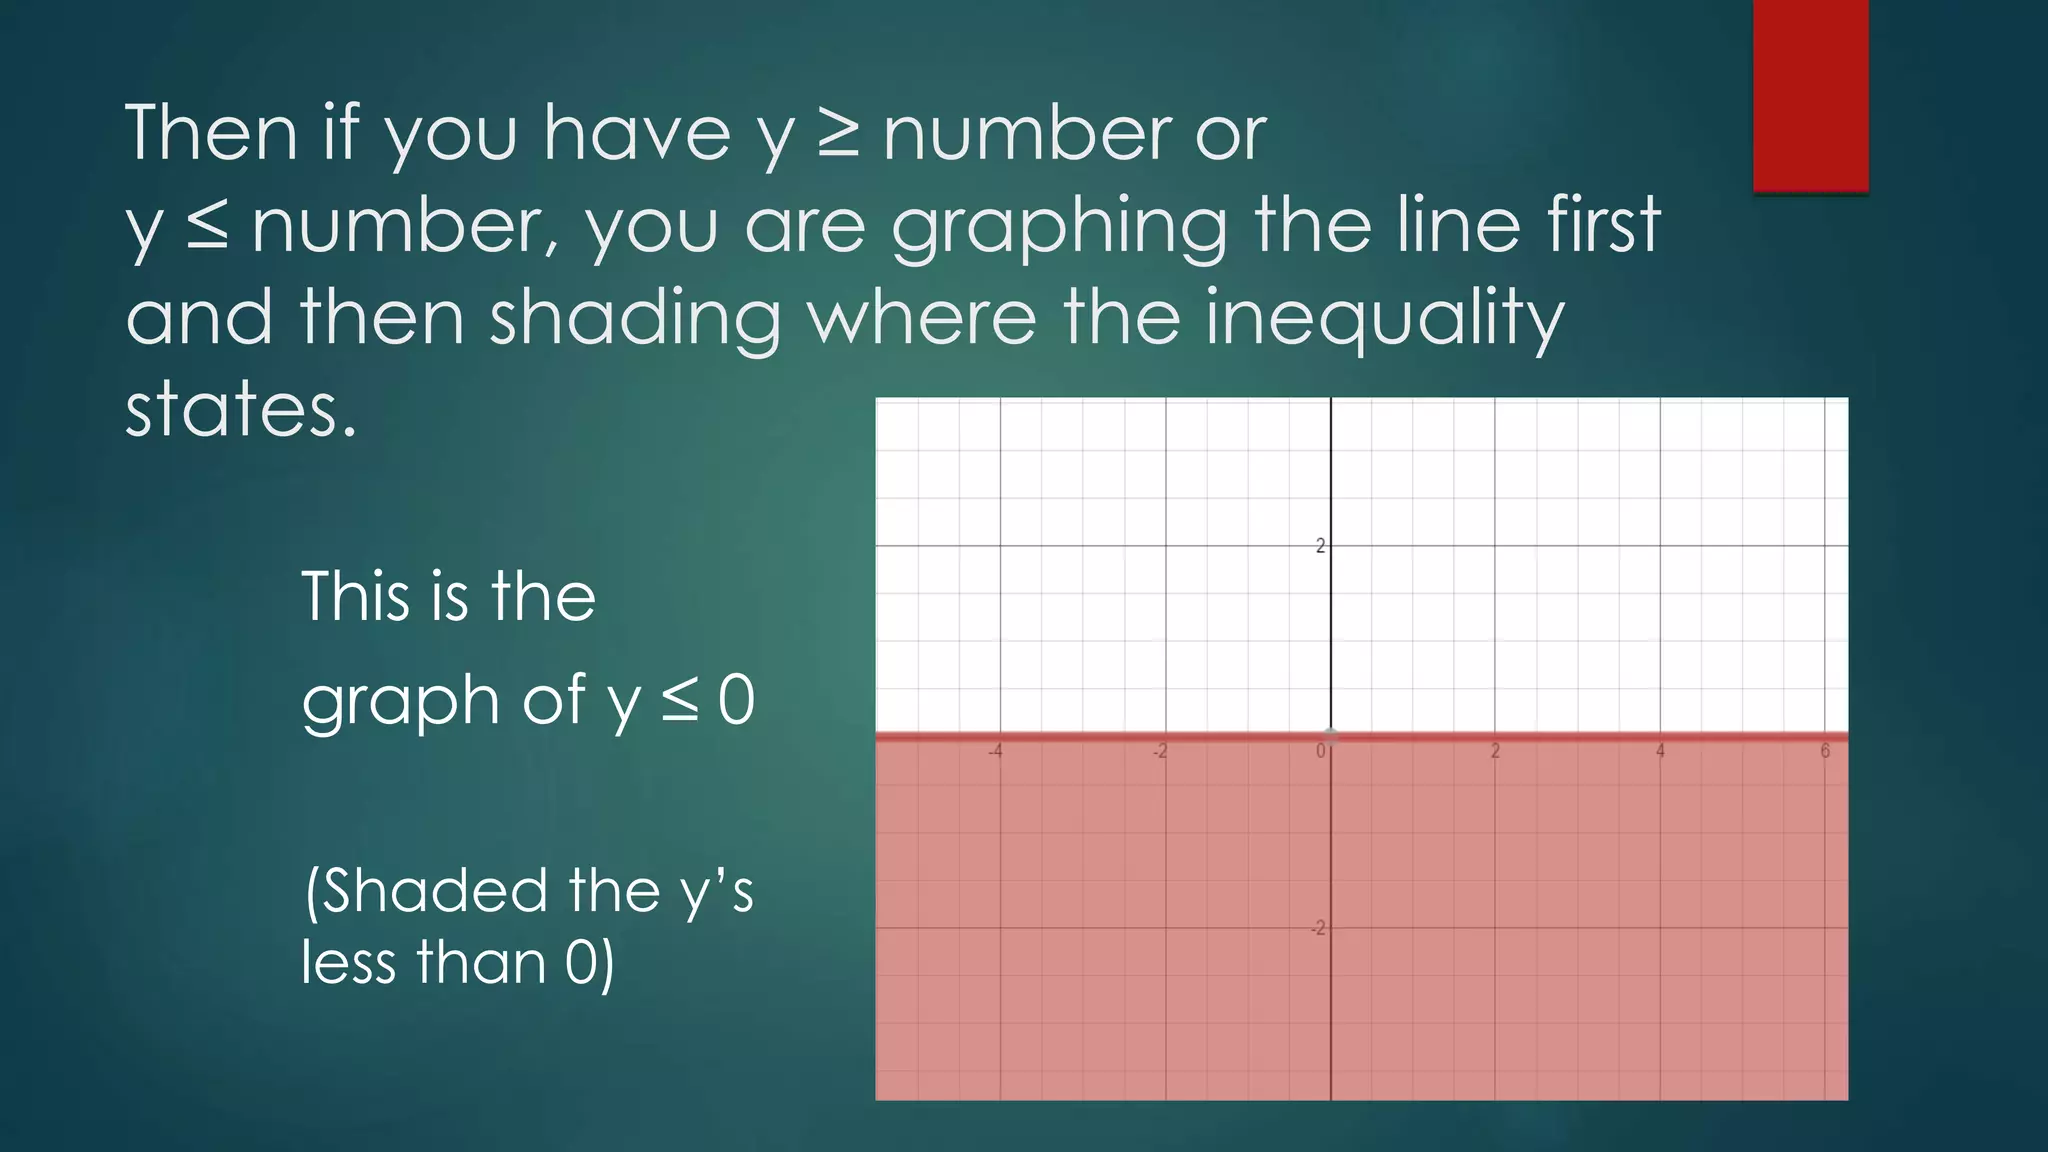
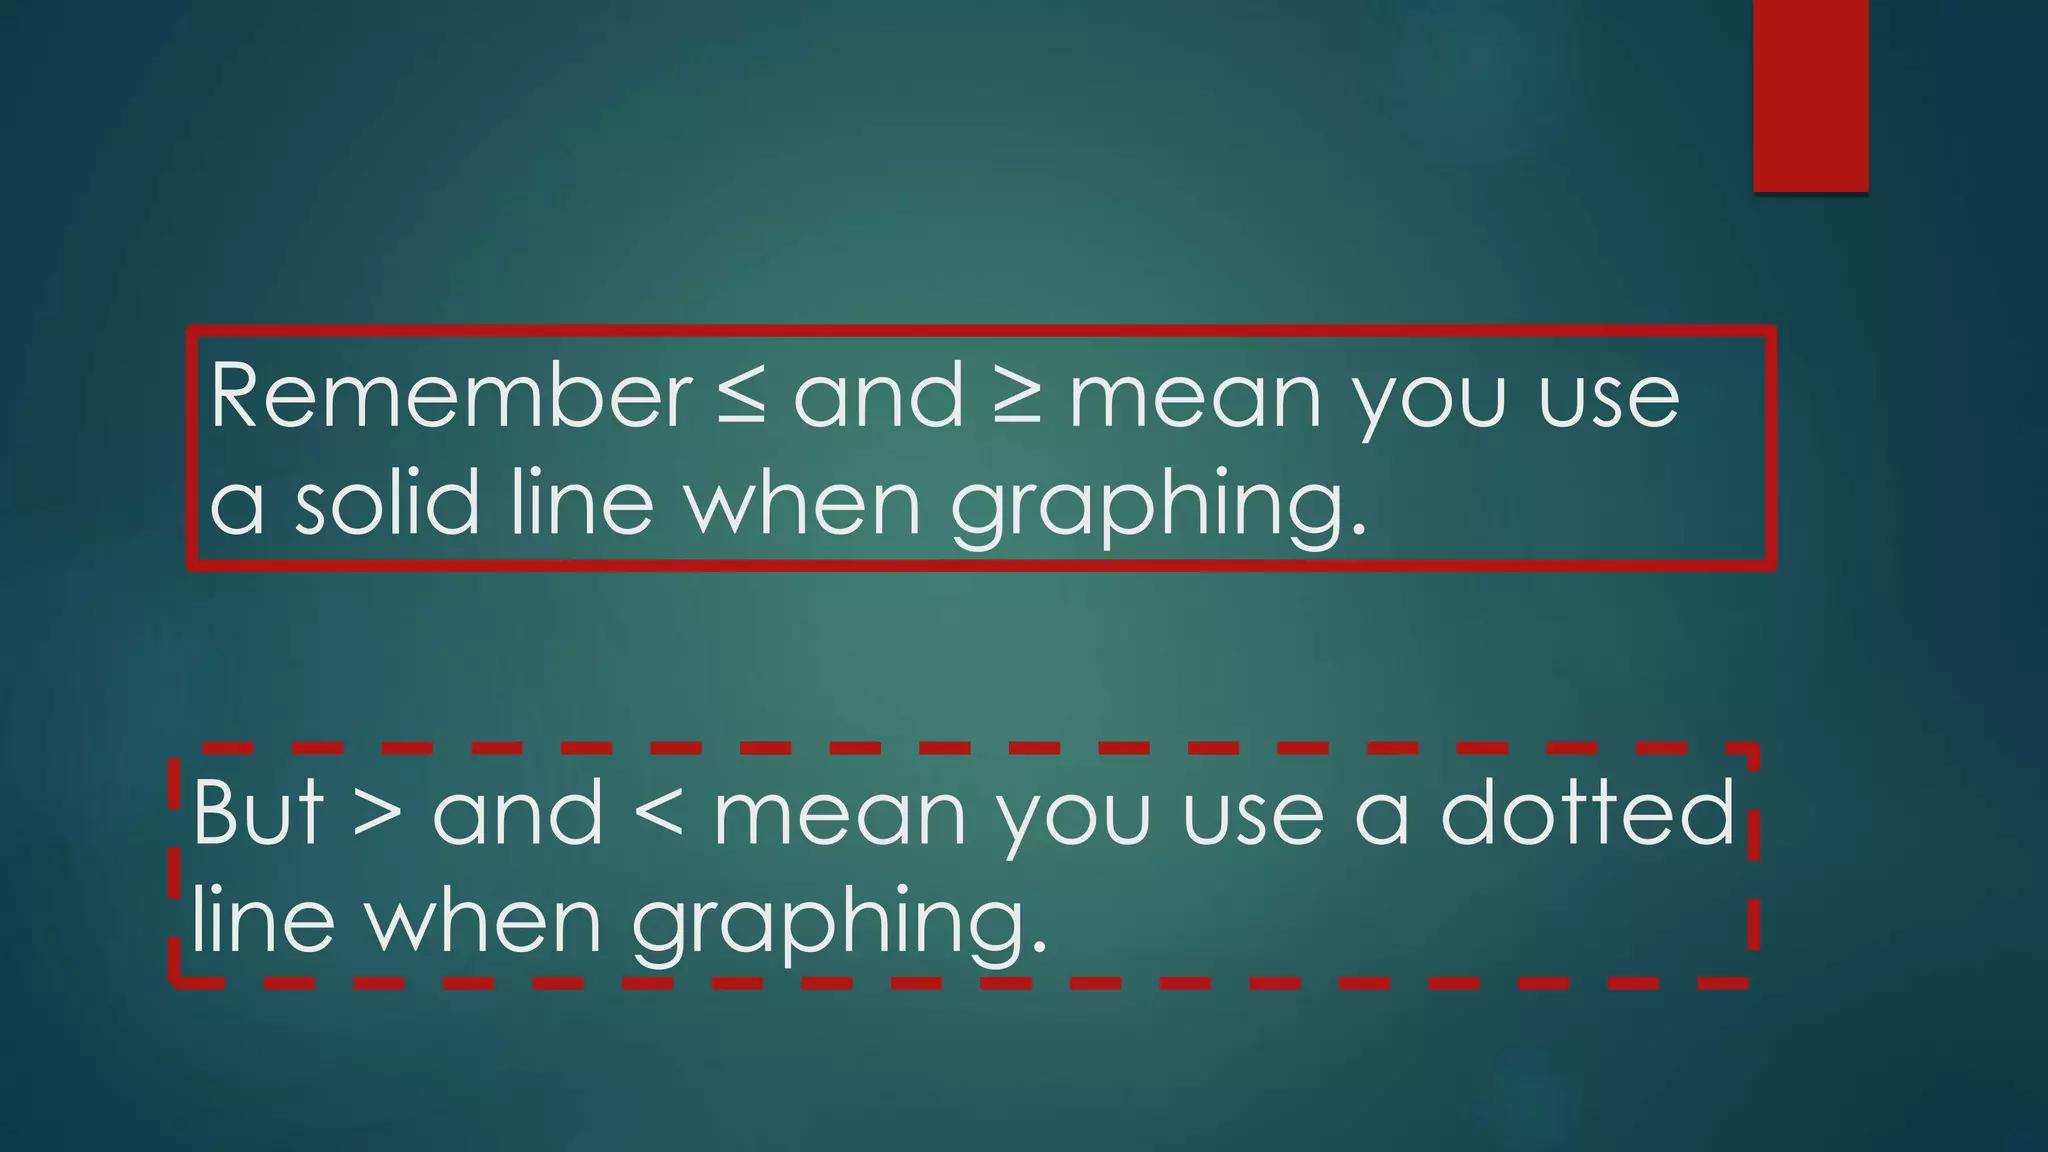
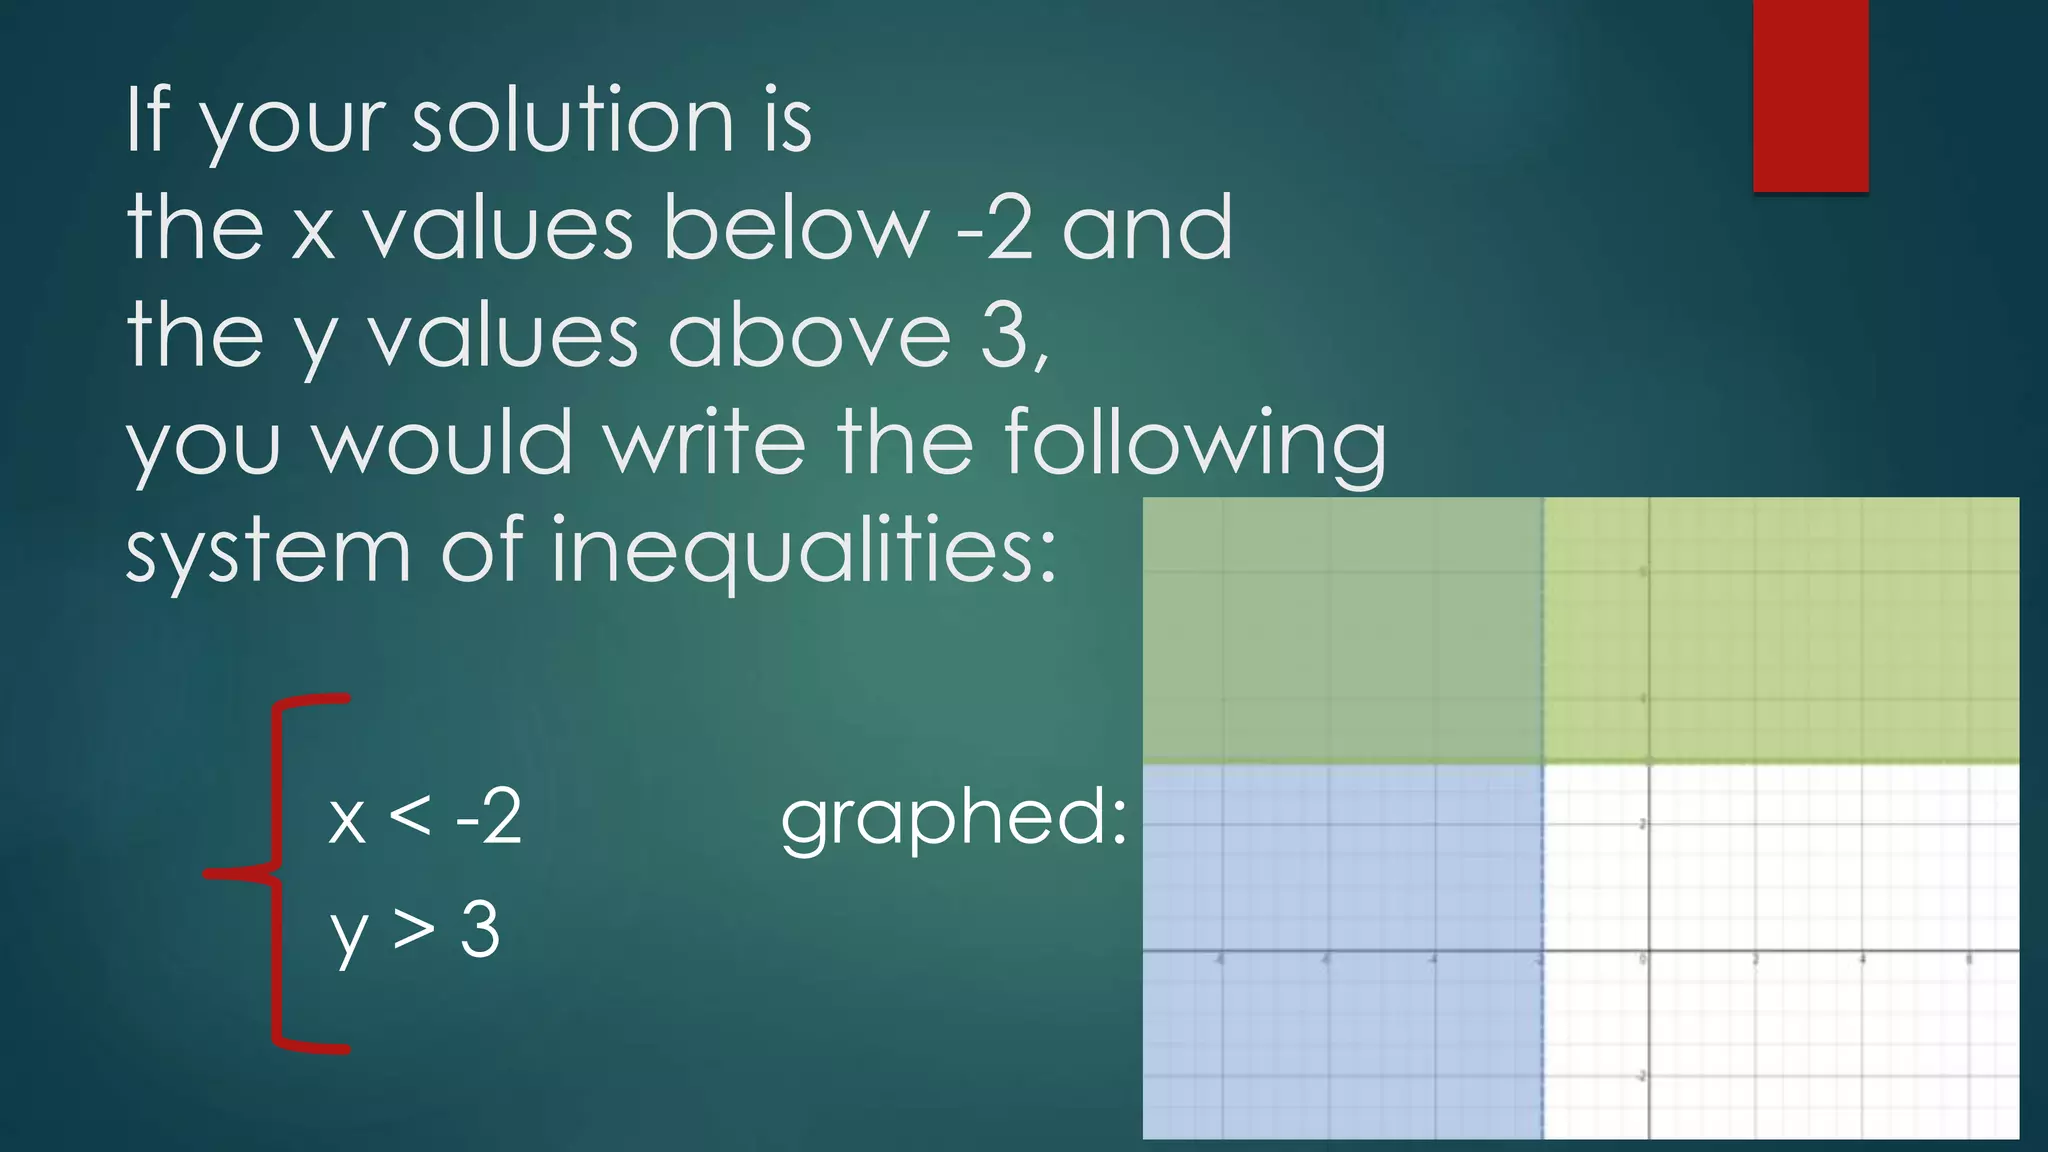
This document discusses how to graph inequalities involving vertical and horizontal lines. It explains that an equation like x=2 graphs as a vertical line where all x values are equal to 2. Inequalities like x≥2 graph the line first and then shade the area indicated by the inequality. Similarly, an equation like y=0 graphs as a horizontal line, and inequalities like y≤0 graph the line and shade the appropriate area. The document also notes that ≤ and ≥ use a solid line when graphing, while > and < use a dotted line. It provides an example of writing a system of inequalities for a solution involving different bounds for x and y values.