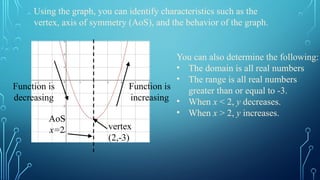
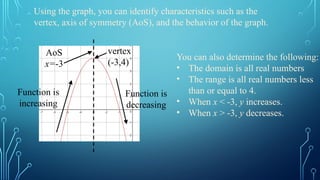
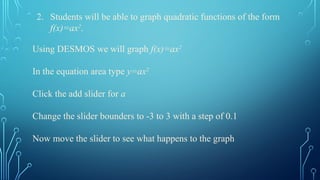
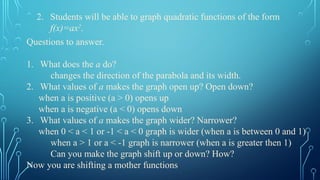
8.1
Graphing f(x)=ax2
1. Students will be able to identify characteristics of quadratic
functions.
2. Students will be able to graph quadratic functions of the form
f(x)=ax2
.
We will now be graphing quadratics, starting with the easy form
and adding complexity.
Therefore, it is important to make sure you get each section as we
move forward
1. Students will be able to identify characteristics of quadratic
functions.
A quadratic function is a nonlinear function that can be written in the
standard form y=ax2
+bx+c, where a ≠ 0.
The U-shaped graph of a quadratic function is called a parabola.
In this lesson we will graph quadratic functions, where b and c equal 0.
1. Students will be able to identify characteristics of quadratic
functions.
Characteristics of Quadratic Functions
The parent quadratic function (mother function) is f(x)=ax2
The graphs of all other quadratic functions are transformations of
the graph of the mother function.
So we say “Shift happens to mother functions”
The lowest point on a
parabola that opens
up or the highest
point on a parabola
that opens down is the
vertex.
vertex
The vertical line that
divides the parabola
into two symmetric
parts is the axis of
symmetry. The axis
of symmetry passes
through the vertex.
axis of symmetry
AoS
Consider the graph of the quadratic function.
Using the graph, you can identify characteristics such as the
vertex, axis of symmetry (AoS), and the behavior of the graph.
vertex
(-1,-2)
AoS
x=-1
Function is
decreasing
Function is
increasing
You can also determine the following:
• The domain is all real numbers
• The range is all real numbers
greater than or equal to -2.
• When x < -1, y decreases.
• When x > -1, y increases.
Using the graph, you can identify characteristics such as the
vertex, axis of symmetry (AoS), and the behavior of the graph.
vertex
(2,-3)
AoS
x=2
Function is
decreasing
Function is
increasing
You can also determine the following:
• The domain is all real numbers
• The range is all real numbers
greater than or equal to -3.
• When x < 2, y decreases.
• When x > 2, y increases.
Using the graph, you can identify characteristics such as the
vertex, axis of symmetry (AoS), and the behavior of the graph.
vertex
(-3,4)
AoS
x=-3
Function is
increasing
Function is
decreasing
You can also determine the following:
• The domain is all real numbers
• The range is all real numbers less
than or equal to 4.
• When x < -3, y increases.
• When x > -3, y decreases.
2. Students will be able to graph quadratic functions of the form
f(x)=ax2
.
Using DESMOS we will graph f(x)=ax2
In the equation area type y=ax2
Click the add slider for a
Change the slider bounders to -3 to 3 with a step of 0.1
Now move the slider to see what happens to the graph
2. Students will be able to graph quadratic functions of the form
f(x)=ax2
.
Questions to answer.
1. What does the a do?
changes the direction of the parabola and its width.
2. What values of a makes the graph open up? Open down?
when a is positive (a > 0) opens up
when a is negative (a < 0) opens down
3. What values of a makes the graph wider? Narrower?
when 0 < a < 1 or -1 < a < 0 graph is wider (when a is between 0 and 1)
when a > 1 or a < -1 graph is narrower (when a is greater then 1)
Can you make the graph shift up or down? How?
Now you are shifting a mother functions

8.1 Graphing ax2.pptx math equation use to

  • 1.
    8.1 Graphing f(x)=ax2 1. Studentswill be able to identify characteristics of quadratic functions. 2. Students will be able to graph quadratic functions of the form f(x)=ax2 . We will now be graphing quadratics, starting with the easy form and adding complexity. Therefore, it is important to make sure you get each section as we move forward
  • 2.
    1. Students willbe able to identify characteristics of quadratic functions. A quadratic function is a nonlinear function that can be written in the standard form y=ax2 +bx+c, where a ≠ 0. The U-shaped graph of a quadratic function is called a parabola. In this lesson we will graph quadratic functions, where b and c equal 0.
  • 3.
    1. Students willbe able to identify characteristics of quadratic functions. Characteristics of Quadratic Functions The parent quadratic function (mother function) is f(x)=ax2 The graphs of all other quadratic functions are transformations of the graph of the mother function. So we say “Shift happens to mother functions” The lowest point on a parabola that opens up or the highest point on a parabola that opens down is the vertex. vertex The vertical line that divides the parabola into two symmetric parts is the axis of symmetry. The axis of symmetry passes through the vertex. axis of symmetry AoS
  • 4.
    Consider the graphof the quadratic function. Using the graph, you can identify characteristics such as the vertex, axis of symmetry (AoS), and the behavior of the graph. vertex (-1,-2) AoS x=-1 Function is decreasing Function is increasing You can also determine the following: • The domain is all real numbers • The range is all real numbers greater than or equal to -2. • When x < -1, y decreases. • When x > -1, y increases.
  • 5.
    Using the graph,you can identify characteristics such as the vertex, axis of symmetry (AoS), and the behavior of the graph. vertex (2,-3) AoS x=2 Function is decreasing Function is increasing You can also determine the following: • The domain is all real numbers • The range is all real numbers greater than or equal to -3. • When x < 2, y decreases. • When x > 2, y increases.
  • 6.
    Using the graph,you can identify characteristics such as the vertex, axis of symmetry (AoS), and the behavior of the graph. vertex (-3,4) AoS x=-3 Function is increasing Function is decreasing You can also determine the following: • The domain is all real numbers • The range is all real numbers less than or equal to 4. • When x < -3, y increases. • When x > -3, y decreases.
  • 7.
    2. Students willbe able to graph quadratic functions of the form f(x)=ax2 . Using DESMOS we will graph f(x)=ax2 In the equation area type y=ax2 Click the add slider for a Change the slider bounders to -3 to 3 with a step of 0.1 Now move the slider to see what happens to the graph
  • 8.
    2. Students willbe able to graph quadratic functions of the form f(x)=ax2 . Questions to answer. 1. What does the a do? changes the direction of the parabola and its width. 2. What values of a makes the graph open up? Open down? when a is positive (a > 0) opens up when a is negative (a < 0) opens down 3. What values of a makes the graph wider? Narrower? when 0 < a < 1 or -1 < a < 0 graph is wider (when a is between 0 and 1) when a > 1 or a < -1 graph is narrower (when a is greater then 1) Can you make the graph shift up or down? How? Now you are shifting a mother functions