This document contains 24 questions related to operations management concepts like layout planning, facility location, process optimization, inventory management, scheduling, and statistical process control. The key information includes minimizing non-adjacent flows in a layout, determining the optimal location for a new facility based on various cost factors, calculating economic order quantity and inventory costs, setting control limits for quality control charts, and estimating project durations and costs using PERT/CPM networks.
Inventory Management , MRP, JIT and SCM
Use of Inventory
Types of Costs
Inventory Management System
Inputs to MRP
Master production schedule(MPS)
BOM example
Inventory Status File
Just-in-time / Toyota Production System
Concept of JIT
Supply Chain Management
Kaizen
Kanban
The transportation problem is a special type of linear programming problem where the objective is to minimize the cost of distributing a product from a number of sources or origins to a number of destinations.
Because of its special structure, the usual simplex method is not suitable for solving transportation problems. These problems require a special method of solution.
Supply Chain Management With Brief Case StudiesMohit Jain
Supply Chain Management With Brief Case Studies Of Companies Like Dell, Wal-Mart.
Analysis On Failures And Success Of Various Company Due To Issues Faced In Supply Chain.
This is a part of purchase and materials handling paper of MBA. The contents of this presentation are made more clearer by using animations.Much more understandable.
Operational research- main techniques PERT and CPMvckg1987
this presentation mainly deals with operational research giving more focus on pERT and CPM techniques. this two methods are very useful and very confusing while reading but the examples in this presentation makes it very easy to understand this methods and for more study the end slide is provided with references.
Problem 6-2A manager wants to assign tasks to workstations as .docxsleeperharwell
Problem 6-2
A manager wants to assign tasks to workstations as efficiently as possible, and achieve an hourly output of 331/3 units. Assume the shop works a 60-minute hour. Assign the tasks shown in the accompanying precedence diagram (times are in minutes) to workstations using the following rules:
a.
In order of most following tasks. Tiebreaker: greatest positional weight.
Work Station
Tasks
I
II
III
IV
b.
In order of greatest positional weight.
Work Station
Tasks
I
II
III
IV
c.
What is the efficiency? (Round your answer to 2 decimal places. Omit the "%" sign in your response. )
Efficiency
%
Problem 6-3
A manager wants to assign tasks to workstations as efficiently as possible, and achieve an hourly output of 4 units. The department uses a working time of 56 minutes per hour. Assign the tasks shown in the accompanying precedence diagram (times are in minutes) to workstations using the following rules:
a.
In order of most following tasks. Tiebreaker: greatest positional weight.
Work Station
Tasks
I
II
III
IV
b.
In order of greatest positional weight.
Work Station
Tasks
I
II
III
IV
c.
What is the efficiency? (Round your answer to 2 decimal places. Omit the "%" sign in your response. )
Efficiency
%
Problem 6-8
A shop works a 400-minute day. The manager of the shop wants an output of 200 units per day for the assembly line that has the elemental tasks shown in the table. Do the following:
Task
Immediate
Predecessor
Task Time (minutes)
a
-
0.5
b
a
1.4
c
a
1.2
d
a
0.7
e
b, c
0.5
f
d
1.0
g
e
0.4
h
g
0.3
i
f
0.5
j
e, i
0.8
k
h, j
0.9
m
k
0.3
b.
Assign tasks according to the most following tasks rule.
Work Station
Following Tasks
1
2
3
4
5
c.
Assign tasks according to the greatest positional weight rule.
Work Station
Following Tasks
I
II
III
IV
V
d.
Compute the balance delay for each rule. Which one yields the better set of assignments in this instance? (Omit the "%" sign in your response.)
Balance delay: both part b and c are
%
Problem 6-18
For the set of tasks given below, do the following:
Task
Task Time
(seconds)
Immediate
Predecessor
A
45
-
B
11
A
C
9
B
D
50
-
E
26
D
F
11
E
G
12
C
H
10
C
I
9
F, G, H
J
10
I
193
Assign tasks to stations for a desired output of 500 units in a 7-hour day to balance the line using the longest operation time heuristic. Break ties with the most following tasks heuristic. Calculate the percentage idle time for the line. Use the actual bottleneck cycle time in your calculation. (Round your percentage of idle time to 2 decimal places. Omit the "%" sign in your response.)
Work Station
Task
I
II
III
IV
Percentage of idle time
%
Problem 7-1
An analyst has timed a metal-cutting operation for 50 cycles. The average time per cycle was 10.9 minutes, and the standard deviation was 1.20 minutes for a worker with a performance rating of 139 percen.
(3 Points)1.The injection molding department of Alvec Inc. use.docxmarilynnhoare
(3 Points)
1.
The injection molding department of Alvec Inc. uses 40 pounds powder X a day. The plant operates 250 days per year. The daily usage of powder X is normally distributed with a standard deviation of 5 pounds per day. The lead time to obtain powder X from a supplier in 9 days. The annual holding cost is $2.00 per unit and the cost of ordering powder X is $50.
a)
What is Economic Order Quantity? ( 3 points)
2.
Refer to problem 1 and its solution. The injection molding department of Alvec Inc. uses 40 pounds powder X a day. The plant operates 250 days per year. The daily usage of powder X is normally distributed with a standard deviation of 5 pounds per day. The lead time to obtain powder X from a supplier in 9 days. The annual holding cost is $2.00 per unit and the cost of ordering powder X is $50.
a)
If a company has a service level goal is 99.4%. What is the expected pounds of shortage order cycle? (shortages are measured in terms of numbers of units) (2 points)
b)
Determine the order points for a service level of 99.4%. (4 Points)
3.
Draw the Activity-on-Arrow network diagrams for the following PERT problem. Use the minimum number of necessary “dummy” activities. (5 points)
Activity
Immediate Predecessor
A
-
B
-
C
A, B
D
B
E
C, D
4.
Given the demand of 3000 units and the following bill of materials for the item “A”, determine the low- level- code and the net requirements for all the items (A, B, C, D). (5 points)
Items
Current Inventory
Low- Level- Code
Net requirements
A
600
B
1800
C
20000
D
7200
5.
(12 Points) The following information is gathered for a project.
Activity
Activity Time ( Days)
Immediate Predecessor(s)
A
2
-
B
4
A
C
5
A
D
2
B
E
1
B
F
8
B, C
G
3
D, E
H
5
F
I
4
F
J
7
G, H, I
a)
Draw the network diagram using the AON (Activity on Node) Convention. (2 points)
b)
Determine the critical path, the amount of slack for each activity and the total completion time of the project. (7 Points)
Activity
ES
EF
LS
LF
Slack
CP
Critical Path:
Project Completion time:
31
30
29
28
27
26
25
24
23
22
21
20
19
18
17
16
15
14
13
12
11
1 0
9
8
7
6
5
4
3
2
1
T A S K
A
B
C
D
E
F
G
H
I
J
C) Prepare the earliest start schedule (Gantt chart). (3 points)
Question 8
An aegean sea fish market buys swordfish daily for $2.10 per pound and sells it for $3.60 per pound. at the end of each business day any remaining swordfish is sold to a cat food company for $1.20 per pound. Daily demand can be approximated by a normal distribution with a mean of 150 pounds and a standard deviation of 9 pounds.
a) Determine the.
For more course tutorials visit
www.tutorialrank.com
Multiple Choice 5
Short 9
Question 1. Question : (TCO 4) Assumptions underlying cost-volume-profit analysis include all of the following,
1. Which of the following is INCORRECT regarding the process capab.docxjackiewalcutt
1. Which of the following is INCORRECT regarding the process capability index Cpk
Productivity can be improved by
Increasing inputs while holding outputs steady
Decreasing outputs while holding inputs steady
Increasing inputs and outputs in the same proportion
Increasing outputs while holding inputs steady
2. Productivity can be improved by
Increasing inputs while holding outputs steady
Decreasing outputs while holding inputs steady
Increasing inputs and outputs in the same proportion
Increasing outputs while holding inputs steady
3. Which of the following statements is INCORRECT regarding critical paths?
The path that takes the longest time to complete in a project is the critical path.
Activities on the critical path must have zero slack time.
Some non-critical activities may have zero slack time.
For any project, the (expected) project completion time is equal to the (expected) time duration of the project’s critical path.
4. Suppose a project team has arrived at the following time estimates for an activity: a = 4 days, m = 6 days, and b = 8 days. What is the variance involved in this activity?
0.111
0.250
0.444
0.694
5. Suppose you are asked to determine the Lower Control Limit for a p-chart for quality control purposes. Samples are taken from the production line. The fraction defective is 0.008 and the standard deviation is 0.002 based on the samples. Set z = 3. Which of the following is the LCL of the p-chart?
0.001
0.002
0.006
0.013
6. The least squares method is to find out the intercept and the slope of a regression line that minimizes the sum of the squared differences between
observed values of the independent variable and predicted values of the independent variable
observed values of the independent variable and predicted values of the dependent variable
observed values of the dependent variable and predicted values of the dependent variable
None of the three is correct.
7. Which of the following statements is INCORRECT regarding corporate missions?
They reflect a company's purpose.
They indicate what a company intends to contribute to society.
They are formulated after strategies are known.
They define a company's reason for existence.
8. Given forecast errors of -2, 5, 10, and -3, what is the mean absolute deviation (MAD)?
2.5
3
4
5
9. Which of the following best describes the process focus strategy?
Appropriate for high-volume, low-variety production
Equipment or processes are arranged based on the progressive steps by which a product is made.
Also known as flow shop
Appropriate for low-volume, high-variety production
10. According to the definition of design quality,
Quality is the degree of excellence at an acceptable price
Quality depends on how well the product fits consumer preferences
Even though quality cannot be defined, you know what it is
Quality is the degree to which a specific product conforms to design specifications
11. Which of the f ...
Supply Chain Management vs Logistics ManagementAnupam Kumar
This presentation explores the difference between logistics and supply chain management while tracking the development of the subject of distribution management, its progression to logistics management and its overall integration leading to the development of the subject of supply chain management. This presentation is aimed at explaining the transition of an organization from one stage of operations management to the next. It also explains the increase in the scope of operations management with the advent of the concept of supply chain management or simply SCM.
This presentation is suited for MBA, PGDM or BBA level students of business management and can be used for class lectures, class notes or class discussions. It will also give an idea to the budding entrepreneurs from taking their businesses from one stage of operations management to the next.
The current document is a presentation hand-out for the notes on the Socio-Economic Analysis of a Project. While starting an entrepreneurial project, various analysis are undertaken of which this present analysis tries to evaluate the social impact and economic worth of the project. This presentation gives an introduction to the topic for students of business management and even others.
Analyzing Tourism through the 4-A FrameworkAnupam Kumar
In the study ‘Matching Product Initiatives with Customer
Expectations: Analyzing Tourism through the 4-A Framework’ it has been argued that the time has come to have a re-look at the basic tourism products that one has to offer.
The paper highlights some of the options which became blatant in light of the 4-A framework. This study puts forth the view that as a viable tourism product, one must look at both the accessibility and affordability aspects in tandem.
Strategic management in different business contextAnupam Kumar
Strategic management operates differently in different business conditions and the priorities and expectations of the stakeholders also change accordingly. This presentation is a comparative description of five different types of strategic business contexts.
Strategy talks about the concept of fit with the environment and yet it also talks about developing resources and competences to manage future scenarios. This presentation talks about the concept of fit and stretch which is essential for an organization's well being.
This presentation is about the basic model of strategic management. It talks about the three basic components and the parts that constitute those components.
Dynamics and Dimensions Pertaining to the Purchase of Capital GoodsAnupam Kumar
This paper tries to explore the nuances of the purchase process of modular office equipments and tries to draw a distinction from all the other types of business to business sales/purchase processes. This is an exploratory study and the paper is based on the scientific observations been made by the author over his past 10 years of work experience with the modular office equipment industry in India. The detail gaps have been filled with the help of depth interviews with sales team members of modular office equipment manufacturers and architects from Delhi NCR. The paper explains that most businesses are largely dependent on their partner organizations, like the project management consultants, the architects and even to their vendors themselves, for adoption of a formal purchase process, citing the lack of knowledge and understanding as the basic reason for such a behavior. This paper tries to imply that all types of businesses, whether established or emerging, are adopting the use of partner organizations for their modular office equipment purchase decisions. It further likes to encourage researchers to explore a similar phenomenon in the human resource recruitment processes through campus placements or recruitment agencies. This paper tries to explain the increasing trend of outsourcing in the purchase processes by organizations to their partner organizations.
Indian Furniture Industry: Is It Time to Commoditize?Anupam Kumar
This paper charts out the growth of modular furniture in India and the various influences and imports of furniture from Malaysian, Chinese and other international shores. It further tries to evaluate the strategy of Indian furniture manufacturers, on one side, vis a vis the Chinese and Malaysian players, on the other, and tried to understand the basic difference between the approach of the two.
With the possibility of IKEA opening its operations in India, the paper tries to explore the possibility of having a large branded furniture set-up by an Indian organization to be able to take on the world.
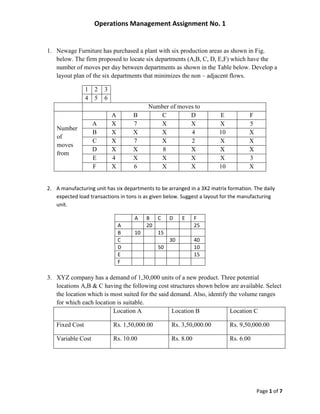
1. Operations Management Assignment No. 1
1. Newage Furniture has purchased a plant with six production areas as shown in Fig.
below. The firm proposed to locate six departments (A,B, C, D, E,F) which have the
number of moves per day between departments as shown in the Table below. Develop a
layout plan of the six departments that minimizes the non – adjacent flows.
1 2 3
4 5 6
Number of moves to
A B C D E F
A X 7 X X X 5
Number
B X X X 4 10 X
of
C X 7 X 2 X X
moves
D X X 8 X X X
from
E 4 X X X X 3
F X 6 X X 10 X
2. A manufacturing unit has six departments to be arranged in a 3X2 matrix formation. The daily
expected load transactions in tons is as given below. Suggest a layout for the manufacturing
unit.
A B C D E F
A 20 25
B 10 15
C 30 40
D 50 10
E 15
F
3. XYZ company has a demand of 1,30,000 units of a new product. Three potential
locations A,B & C having the following cost structures shown below are available. Select
the location which is most suited for the said demand. Also, identify the volume ranges
for which each location is suitable.
Location A Location B Location C
Fixed Cost Rs. 1,50,000.00 Rs. 3,50,000.00 Rs. 9,50,000.00
Variable Cost Rs. 10.00 Rs. 8.00 Rs. 6.00
Page 1 of 7
2. Operations Management Assignment No. 1
4. In a system there are 2 machines and 1 operator. The details are as below. Draw an
activity chart and find capacity utilization in terms of time.
Activity Time
Loading & Starting of A 0.8
Running of A and automatic stop 1.6
A running and unloading product from B 0.4
Inspection of Product from B 1
Loading and start of B 0.8
Running of B and automatic stop 1.6
B running and unloading product from A 0.4
Inspection of product from A 1.0 / Repeat
5. The following are the activities of time utilization both for man and machine. Find the
current level of utilization of man and machine. Can the process be improved?
Sr. No. Activities Duration (in
min.)
1 Fixing the load 6
2 Clamping the load 3
3 Starting machine 0.1
4 Adjustment of Lubricant Flow 0.1
5 Running time of machine 12.4
6 Machine Stopping 0.1
7 Clearing of machine parts 0.3
8 Unloading part 0.3
9 Inspection & Packing of the 0.6
Part
6. A time study of Ghaziabad Grain elevator loading activity revealed a cycle time of 8.57
minutes for a worker rated at 107 %. The allowances are based upon total (480 minutes
per day) time and are as follows: personal time = 25 minutes per day, fatigue = 84
minutes per day, delay = 35 minutes per day. Determine the standard time for an 8 hour
per day operations.
Page 2 of 7
3. Operations Management Assignment No. 1
7. A new medical health care facility is to be located in Delhi. The location factors, factor
rating and scores for the potential sites are as below. Advise the best location.
Sr. Location Factor Factor Ratings
No. Rating Location A Location B
1. Facility utilization 8 3 5
2. Total Patients per month 5 4 3
3. Average time per emergency trip 6 4 5
4. Land and construction costs 3 1 2
5. Employee preference 5 5 3
8. A particular job operation in a plant undergoes the following processes A, B, C, D, E & F
along with time each activity takes in weeks.
– How much time is required for the inventory to be ready for sale?
– Can some activity start at a later time, as this would help optimize the manpower
resources?
9. A network has four activities with expected times as shown in table. The minimum
feasible times and cost per day to gain reductions in the activity times as also given. If
fixed project cost is Rs. 90 per day, what is the lowest cost time schedule?
Activity Standard Minimum Direct Cost of Time Reduction (in Rs.)
Time Time
1–2 5 2 40 each day
1–3 4 2 35(first day), 80( second day)
2–4 4 4 None possible
3–4 6 3 45 (first day), 110 (other days)
Page 3 of 7
4. Operations Management Assignment No. 1
10. A leading company has decided to bring about certain changes in its product design for
which the time estimates are as follows. Estimate the time it would take to get the new
design implemented. The activity precedence detail is:
Activity Activity Time
No. (in Weeks)
1 Redesign Product 6
2 Redesign Packaging 2
3 Order & receive component for redesigned product 3
4 Order & receive component for redesigned packaging 2
5 Assemble Product 4
6 Make up packaging 1
7 Package redesign product 1
8 Test Market redesigned product 6
9 Revise redesigned product 3
10 Revise redesigned packaging 1
11 Present result to Board 1
Activity number must finish before Activity number can start
1 3
2 4
3 5
4 6
5,6 7
7 8
8 9
8 10
9,10 11
11. A firm with an annual demand of 900 units per year estimates its ordering costs at Rs. 15
per order and its carrying cost at Rs. 3 per unit per year. Calculate the Economic Order
Quantity and total cost of inventory for the firm.
Page 4 of 7
5. Operations Management Assignment No. 1
12. A distributor pays Rs. 80 each for an electric switch for which it has an annual demand of
4000 units. Its ordering cost is estimated at only Rs. 20 per order and it estimates carrying
charges at 20%. What is the EOQ for this item?
13. The following table gives data on normal time and cost and crash time and crash cost for
a project. Draw the network for the project and find the minimum total time of project
after crash and the corresponding cost taking into consideration the time minimum crash
cost.
Activity Normal Crash
Time (Days) Cost Time (Days) Cost
1–2 6 60 4 100
1–3 4 60 2 200
2–4 5 50 3 150
2–5 3 45 1 65
3–4 6 90 4 200
4–6 8 80 4 300
5–6 4 40 2 100
6–7 3 45 2 80
14. An assembly operation has three work element taken care by on operator. An industrial
engineer conducted work sampling to determine the standard time for the job. The
duration of study is one shift with 420 minutes of effective time. The observations are
given in the table below. A total unit produced during the study period is 160 units.
Assuming 10% allowance, find standard time.
Sr. Work Element Frequency of Performance
No. Number Performance Rating
1. 1 70 80%
2. 2 80 90%
3. 3 60 100%
15. An oil engine manufacturer purchases lubricants at the rate of Rs. 42 per piece from a
vendor. The requirements of these lubricants are 1800 per year. What should bethe
ordering quantity per order if the cost per placement of an order is Rs. 16 and the
inventory carrying cost per rupee per year is 20 paise.
16. Given the data shown in table below for a PERT network.
a. Draw an AOA network diagram
b. What are the parameters of the ending time distribution (Estimated time of Critital
Path and Standard Deviation of Critical Path)?
Page 5 of 7
6. Operations Management Assignment No. 1
c. Determine the earliest start, latest start and slack time of all events in the system.
Preceding Event Optimistic Most Likely Pessimistic
Event Time Time Time
1 2 5 6 13
1 3 5 7 12
2 4 1.5 2 2.5
2 5 1 3 5
3 5 1 3 5
3 5 4 5 6
4 7 2 3 10
5 7 4 5 6
6 7 3 5 7
17. A stop watch time study was made of an assembly task that involved four elements.
Calculate the normal time, standard time. Allowances are 15 percent of normal time.
Element 1 2 3 4 5 Rating
1 0.04 0.04 0.03 0.03 0.04 100
2 0.12 0.10 0.09 0.10 0.10 90
3 0.16 0.24 0.15 0.16 0.16 115
4 0.13 0.13 0.12 0.14 0.14 120
18. A machine manufacturing mica discs with specified thickness between 0.008 mm and
0.015 mm. Samples of size 4 are drawn every hour and their thickness are recorded as
below. Construct the control charts for mean and range and comment if the process is
under control. The value of A2 is 0.73, D3 is 0 and D4 is 1.8.
Sr. No. Sample Thickness of mica discs (in units of 0.001 mm)
1 14 8 12 12
2 11 10 13 8
3 11 12 16 14
4 17 12 17 16
5 15 12 12 10
6 13 8 15 15
7 14 12 13 10
8 11 10 8 16
9 14 10 12 9
10 12 10 12 14
Page 6 of 7
7. Operations Management Assignment No. 1
19. Following data gives defectives in a sample size of 25 numbers carried out in Jan. 2012.
In Feb. 2012, 25 pieces were against imported on each of the two occasions and 5 pieces
and 8 pieces were found to be defective in each case respectively. Find out whether the
process is under statistical control.
Sub Group No. of Sub Group No. of Sub Group No. of
No. Defectives No. Defectives No. Defectives
1 3 6 4 11 4
2 4 7 6 12 4
3 5 8 3 13 6
4 3 9 4 14 5
5 4 10 3 15 3
20. A sportswear firm has set up automated production line of sweaters. 20 samples of size
50 each were drawn randomly during the first week of production in order to establish the
control limits for the process.
Sample 1 2 3 4 5 6 7 8 9 10 11 12 13 14 15
No.
No. of 2 3 4 1 0 2 4 1 1 3 0 1 2 1 1
Defectives
21. The Delhi Metro Railway uses the number of written passenger complaints per day as a
measure of its service quality. For 10 days the number of complaints received is as given
in the table below. Compute the control limits.
Day No. 1 2 3 4 5 6 7 8 9 10
No. of 4 8 2 0 3 9 10 0 6 4
Complaints
22. Construct a C chart for the following data and check for the process control.
Sample Number 1 2 3 4 5 6 7 8 9 10
Number of non- 23 15 17 15 41 0 25 31 29 0
confirmative
23. The following are the figures for the number of defectives in 22 lots, each containing
2000 rubber bells. Draw the control chart for fraction defectives and comment on the
state of control in the process.
425, 430, 216, 341, 225, 322, 280, 306, 337, 305, 356, 402, 206, 264, 126, 409, 193, 326,
280, 389, 457, 420
24. Repeated samples of size 100 were taken 50 times and the number of defective units
processed was found to be 500 in all. Construct control chart for proportion defectives.
Page 7 of 7