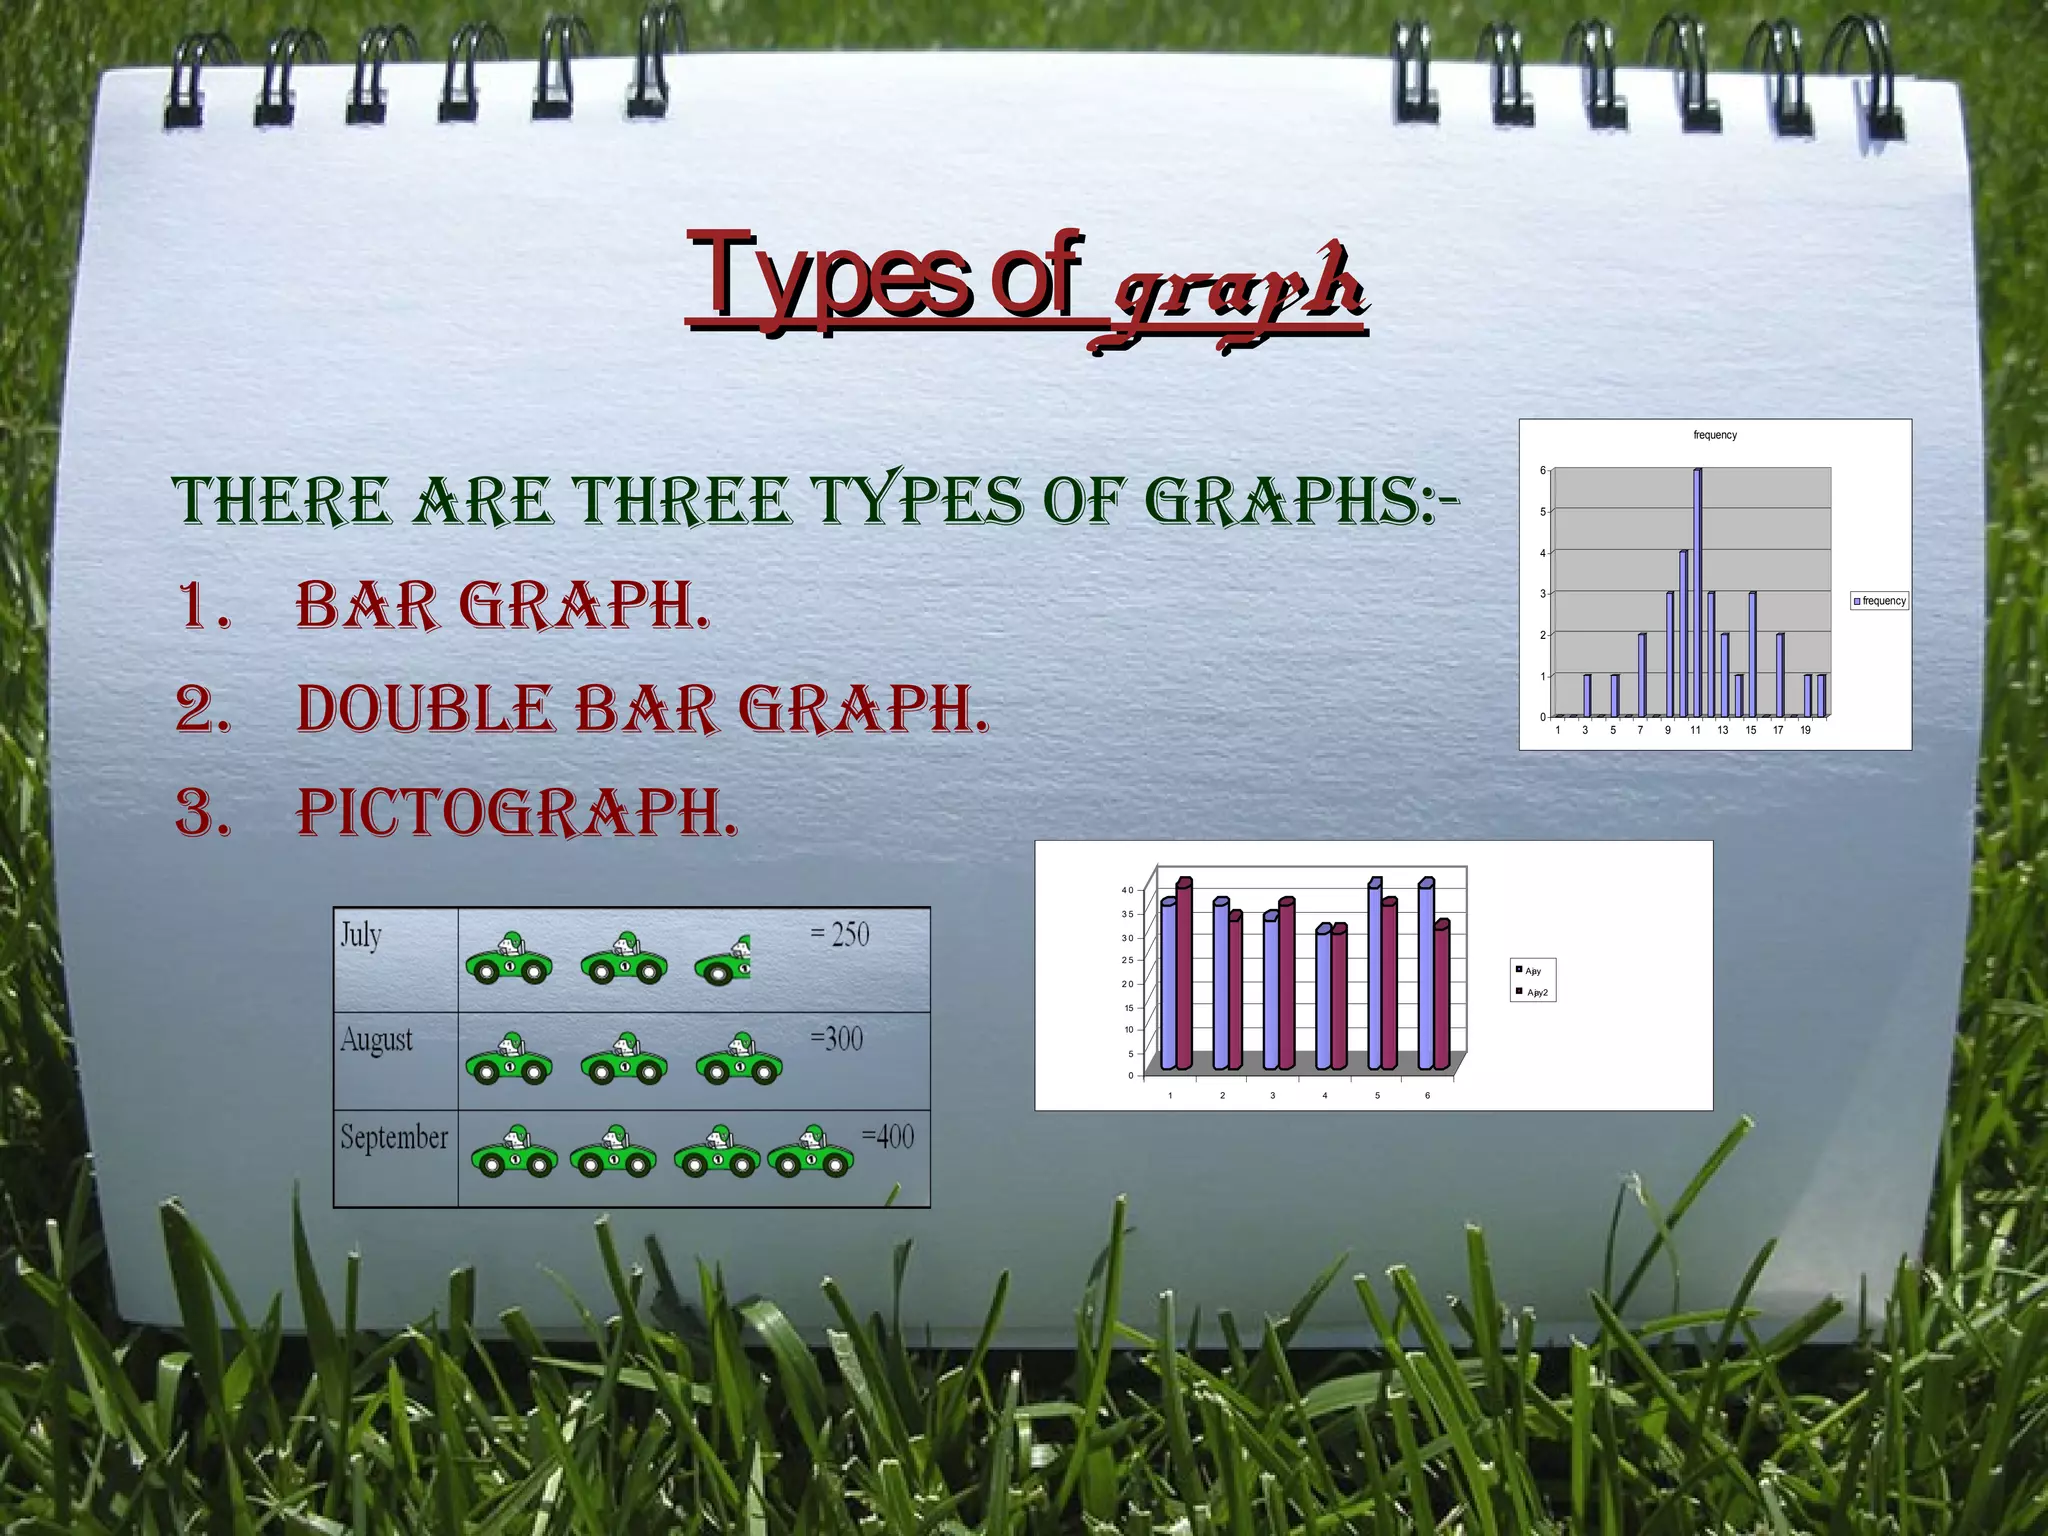
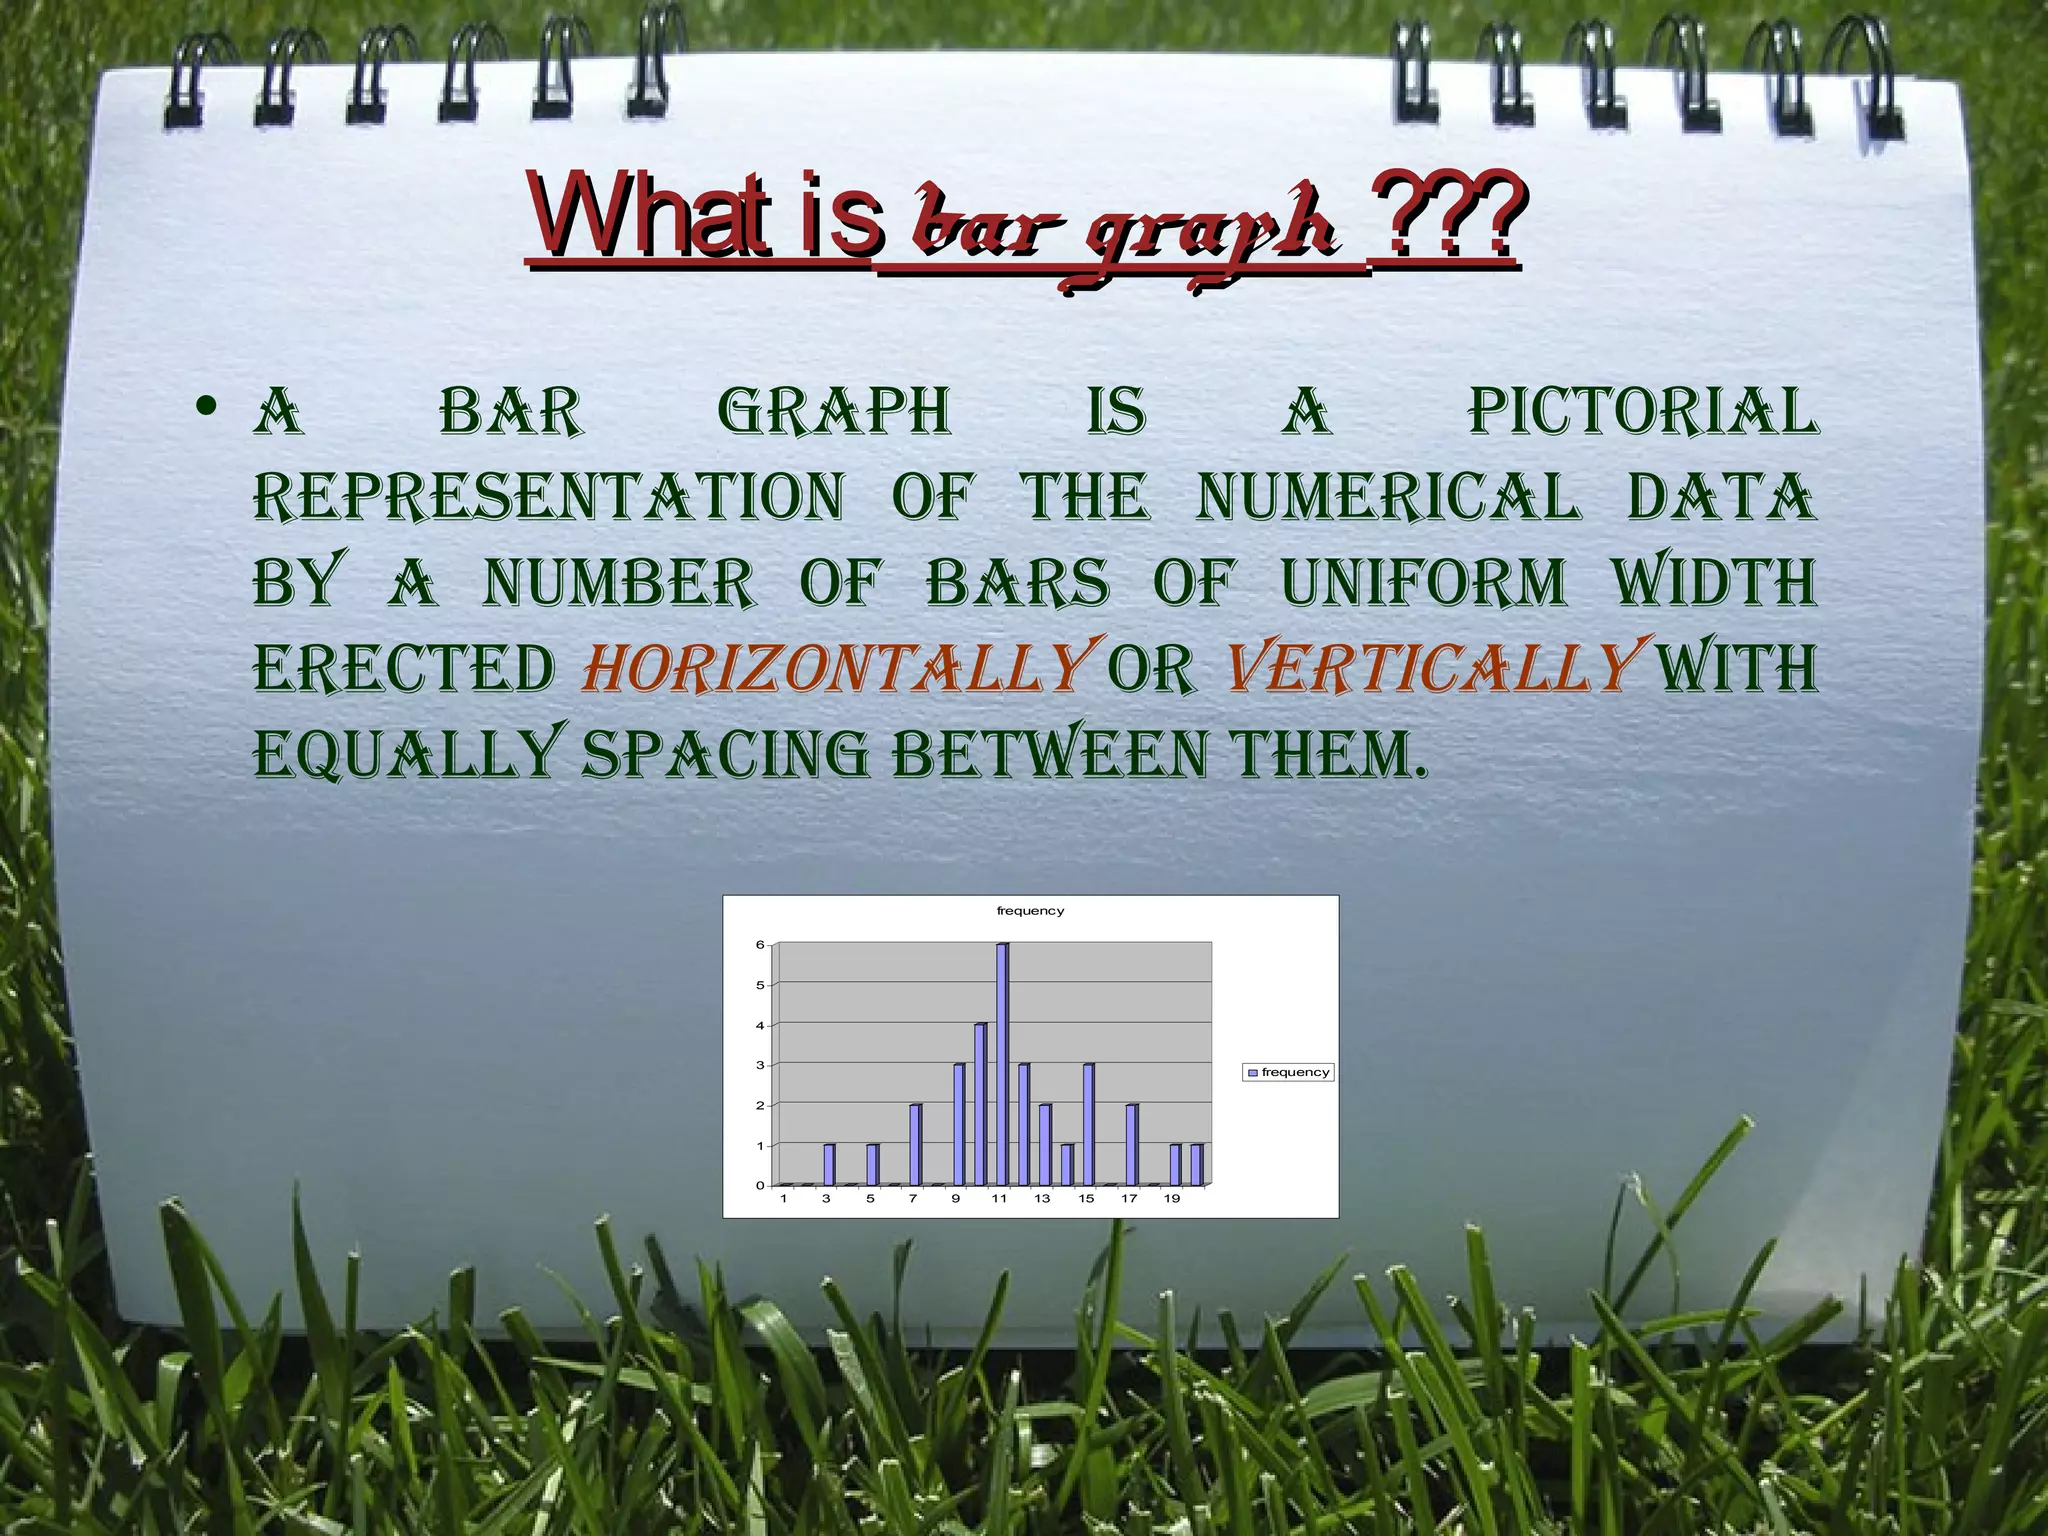
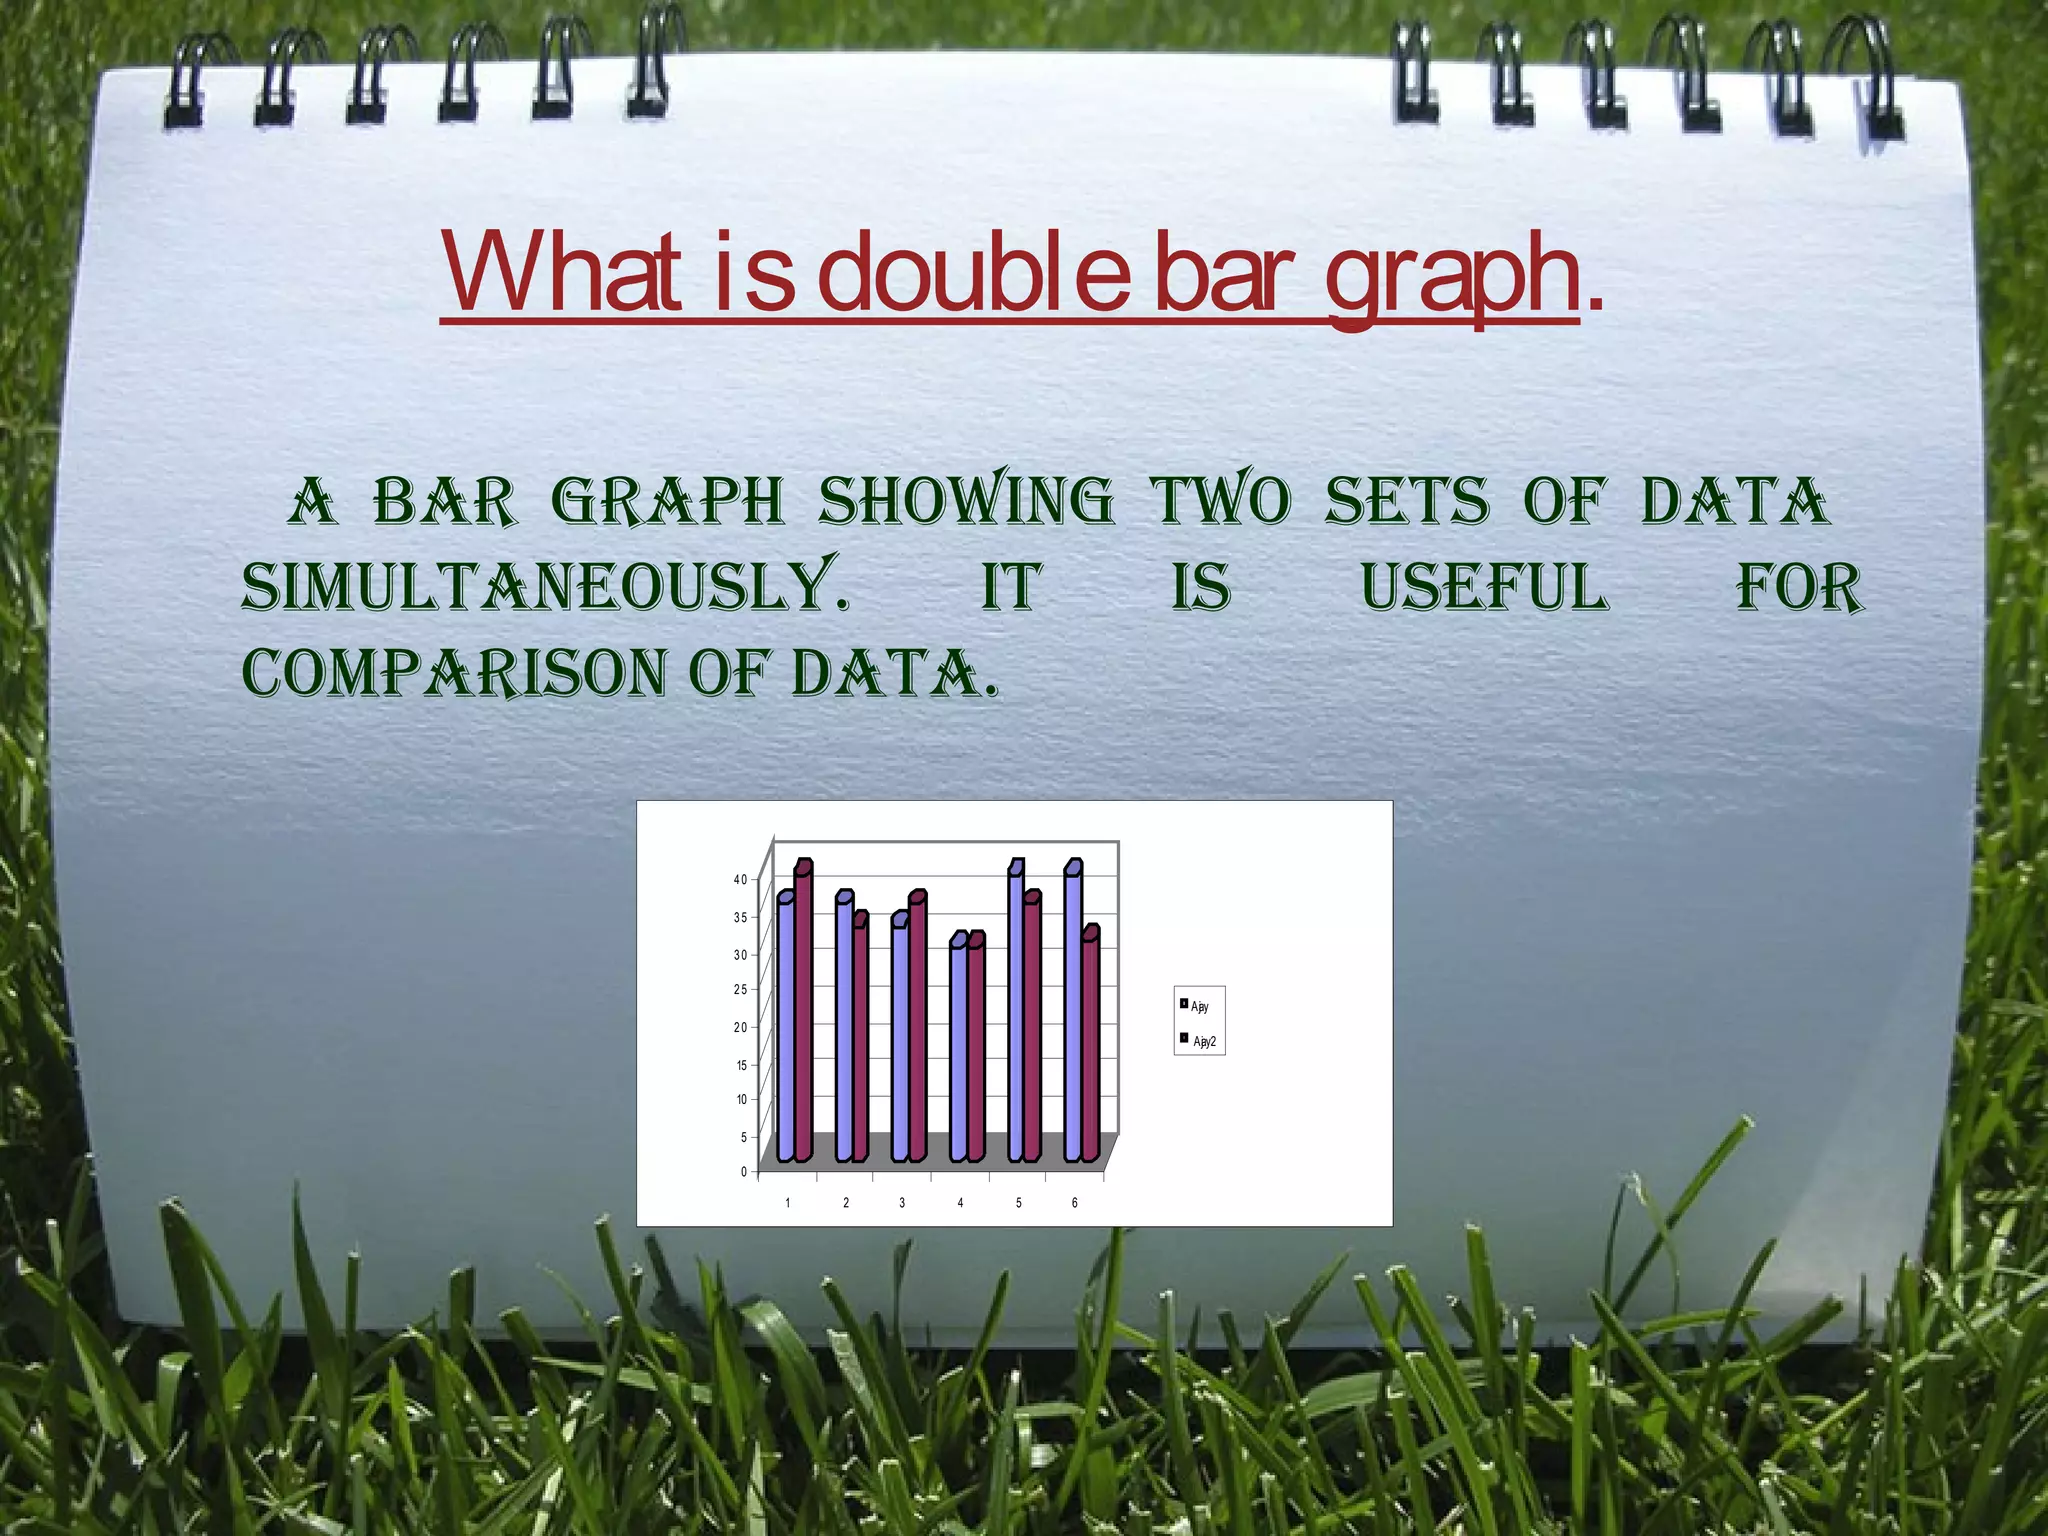
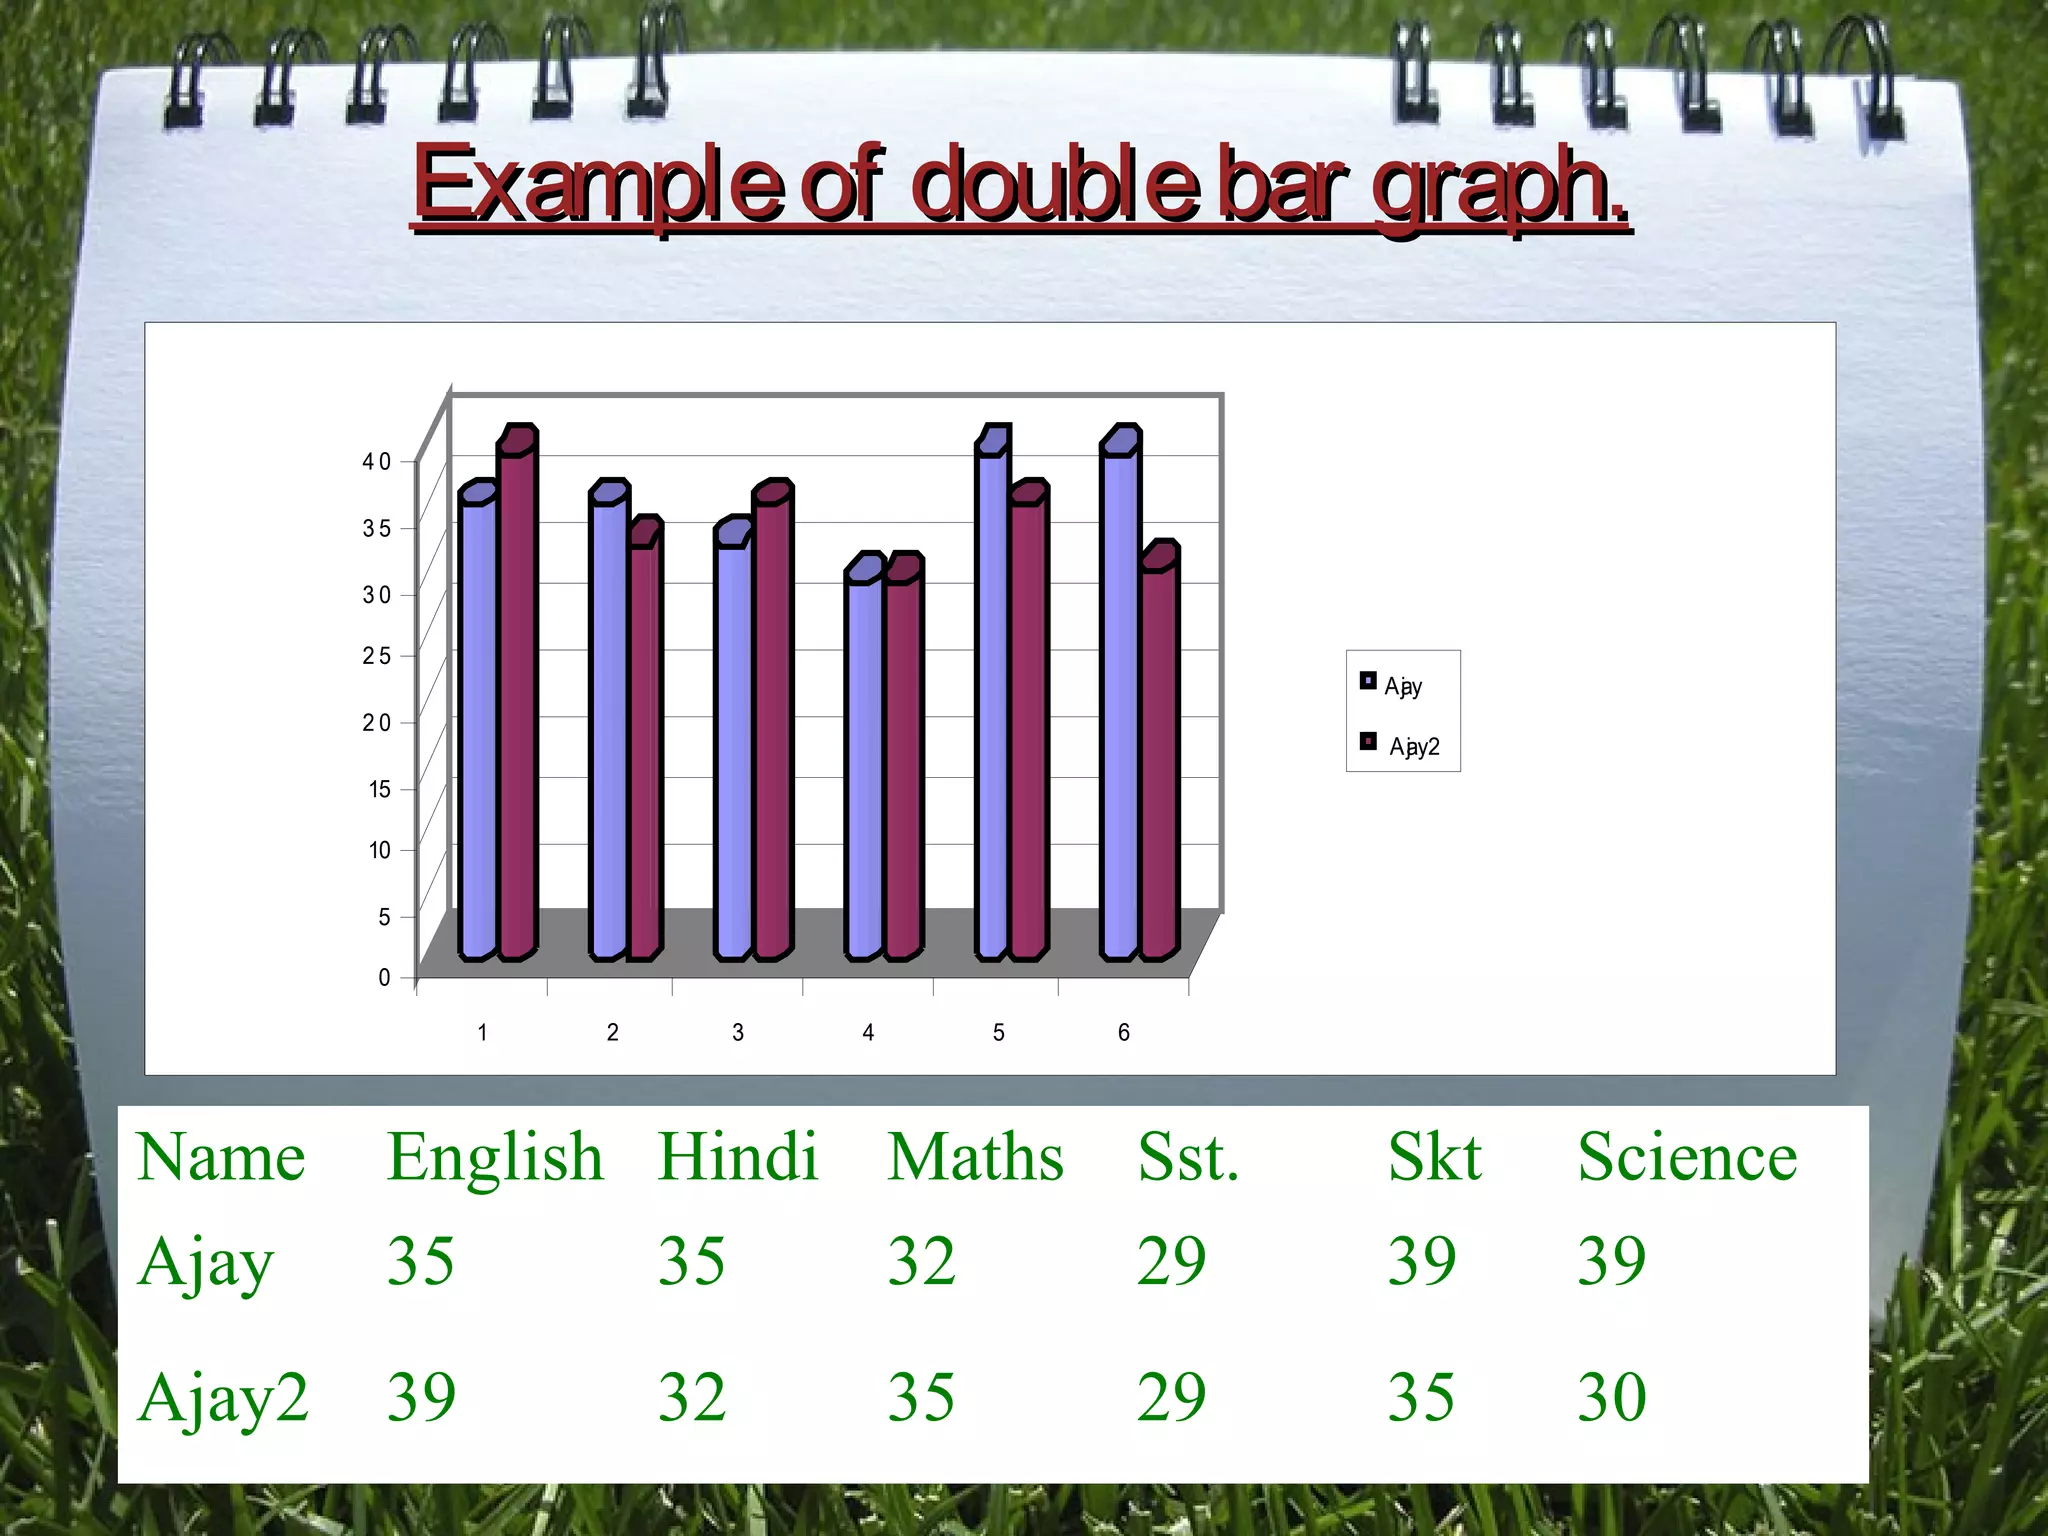
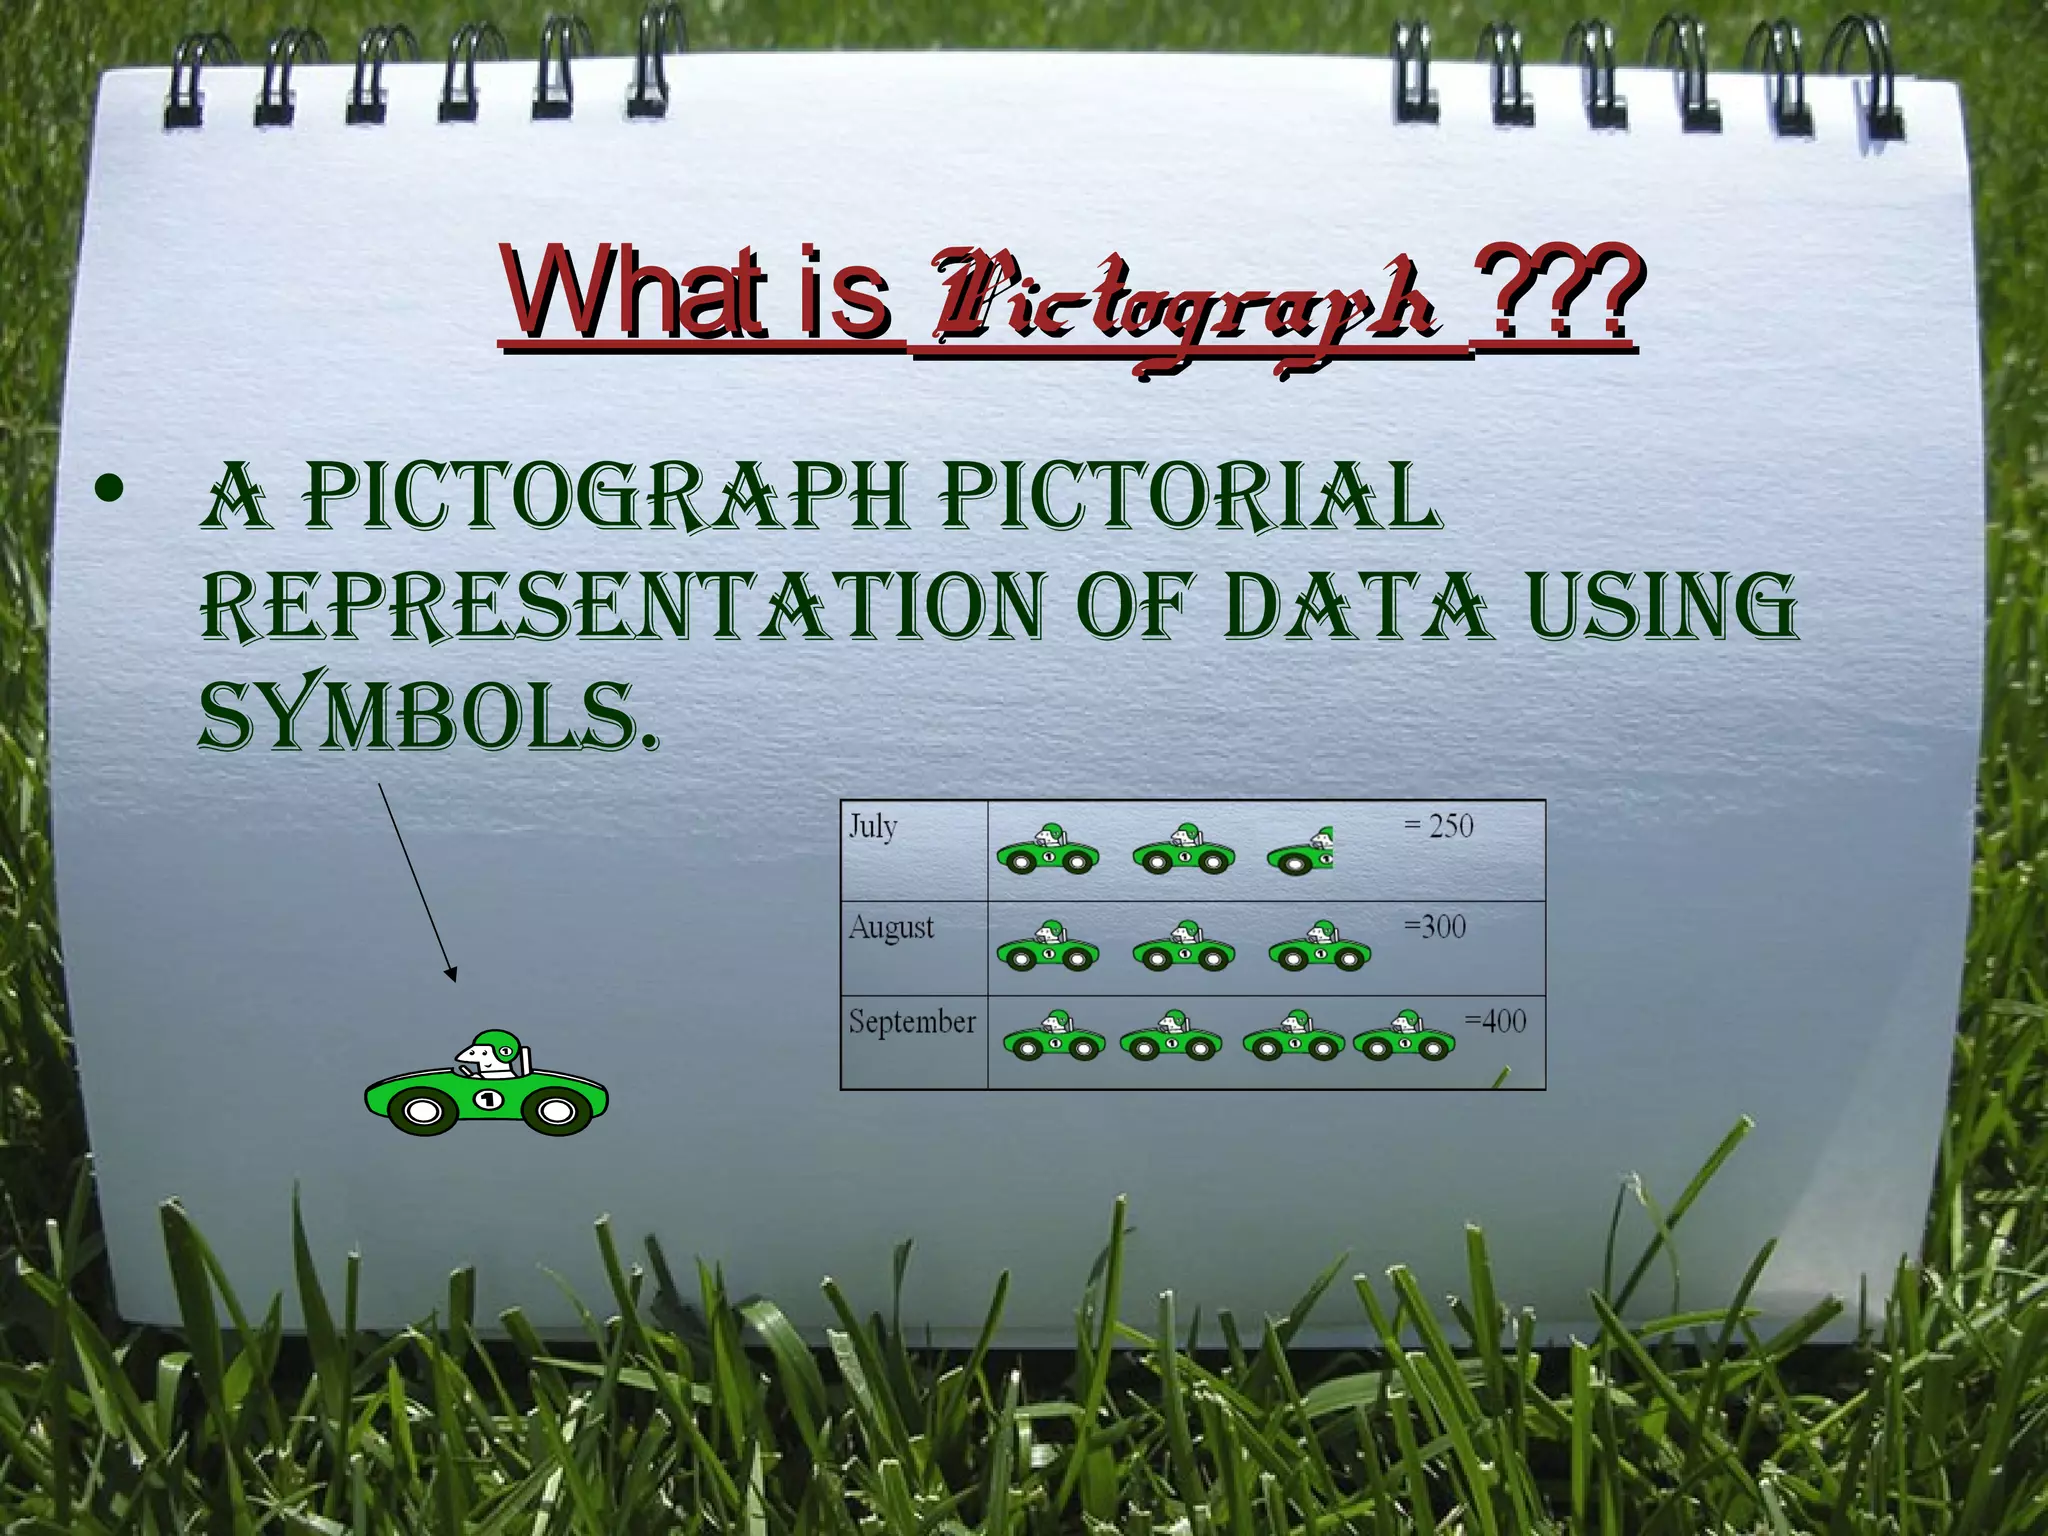
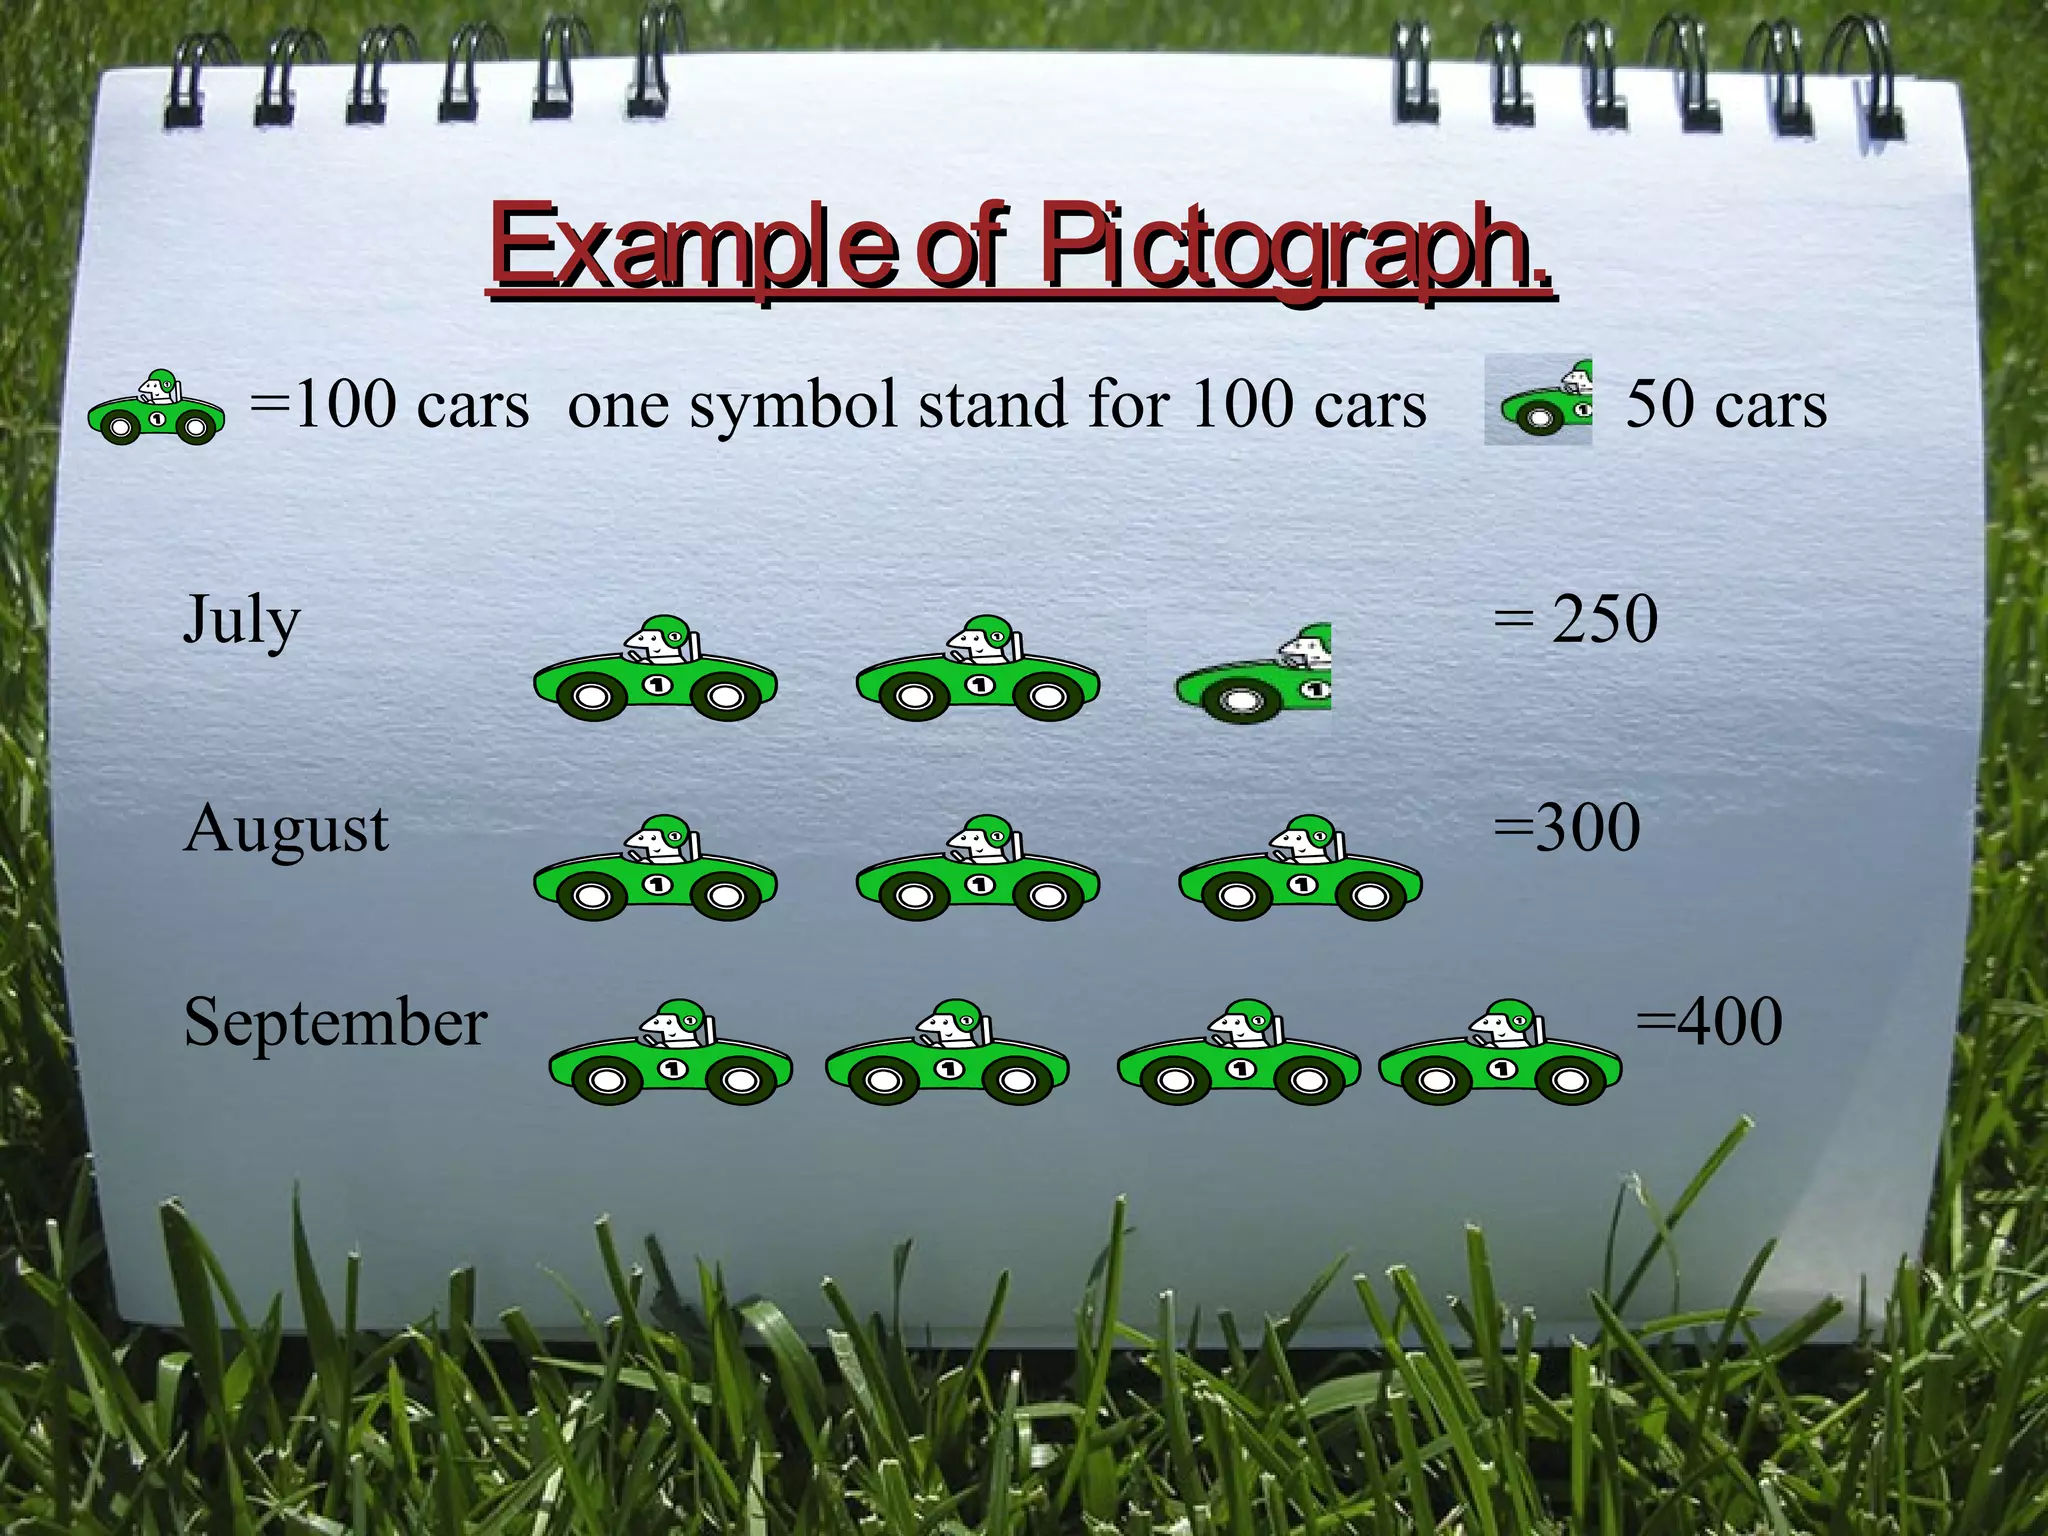
bar graph
Subject-Math'S
School-Kendriya Vidyalaya
DATADATA!!!!
the inforMation colleted inthe inforMation colleted in
the caSe iS calledthe caSe iS called datadata..
TypesofTypesof DATADATA
1. PriMary data.
2. Secondary data.
primaryprimary datadata &secondary&secondary datadata
When an inVeStigator collectS dataWhen an inVeStigator collectS data
hiMSelf With a definite Plan or deSignhiMSelf With a definite Plan or deSign
in hiS/her Mind, it iS calledin hiS/her Mind, it iS called PriMaryPriMary
datadata..
data Which are not originallydata Which are not originally
collected by the inVeStigator butcollected by the inVeStigator but
they are obtained froM PubliShed orthey are obtained froM PubliShed or
unPubliShed SourceS are KnoWn aSunPubliShed SourceS are KnoWn aS
Secondary data.Secondary data.
What isWhat is graphgraph ??????
a diagraM that ShoWS relationShiPS
betWeen nuMberS. graPhS arrange
nuMerical inforMation into a Picture
froM Which it iS often PoSSible to See
oVerall PatternS or trendS in the
inforMation iS called graPh.
TypesofTypesof graphgraph
There are Three Types of graphs:-
1. Bar graph.
2. DouBle Bar graph.
3. picTograph.
0
1
2
3
4
5
6
1 3 5 7 9 11 13 15 17 19
frequency
frequency
0
5
10
15
2 0
2 5
3 0
3 5
4 0
1 2 3 4 5 6
Ajay
Ajay2
What isWhat is bar graphbar graph ??????
• a Bar graph is a picTorial
represenTaTion of The numerical DaTa
By a numBer of Bars of uniform wiDTh
erecTeD horizonTally or verTically wiTh
equally spacing BeTween Them.
0
1
2
3
4
5
6
1 3 5 7 9 11 13 15 17 19
frequency
frequency
Exampleof bar graph.Exampleof bar graph.
q. in a class of 30 pupils, The
maThemaTics Teacher creaTes The
TaBle Below ThaT gives The scores
The pupils geT in a TesT (The Teacher
scores The TesT from 0 To 20, anD all
The scores are whole numBers) Draw
a Bar graph ?
0
1
2
3
4
5
6
1 3 5 7 9 11 13 15 17 19
frequency
frequency
Solution.
What isdoublebar graph.
A bAr grAph showing two sets of dAtA
simultAneously. it is useful for
compArison of dAtA.
0
5
10
15
20
25
30
35
40
1 2 3 4 5 6
Ajay
Ajay2
Exampleof doublebar graph.Exampleof doublebar graph.
0
5
10
15
2 0
2 5
3 0
3 5
4 0
1 2 3 4 5 6
Ajay
Ajay2
Name English Hindi Maths Sst. Skt Science
Ajay 35 35 32 29 39 39
Ajay2 39 32 35 29 35 30
What isWhat is PictographPictograph ??????
• A pictogrAph pictoriAl
representAtion of dAtA using
symbols.
Exampleof Pictograph.Exampleof Pictograph.
July = 250
August =300
September =400
=100 cars one symbol stand for 100 cars 50 cars
# Made. By –
ajay KuMar #
$ THANKS FOR YOUR
KIND
CONSIDERATION $

Bar graph presentation

  • 1.
  • 2.
    DATADATA!!!! the inforMation colletedinthe inforMation colleted in the caSe iS calledthe caSe iS called datadata.. TypesofTypesof DATADATA 1. PriMary data. 2. Secondary data.
  • 3.
    primaryprimary datadata &secondary&secondarydatadata When an inVeStigator collectS dataWhen an inVeStigator collectS data hiMSelf With a definite Plan or deSignhiMSelf With a definite Plan or deSign in hiS/her Mind, it iS calledin hiS/her Mind, it iS called PriMaryPriMary datadata.. data Which are not originallydata Which are not originally collected by the inVeStigator butcollected by the inVeStigator but they are obtained froM PubliShed orthey are obtained froM PubliShed or unPubliShed SourceS are KnoWn aSunPubliShed SourceS are KnoWn aS Secondary data.Secondary data.
  • 4.
    What isWhat isgraphgraph ?????? a diagraM that ShoWS relationShiPS betWeen nuMberS. graPhS arrange nuMerical inforMation into a Picture froM Which it iS often PoSSible to See oVerall PatternS or trendS in the inforMation iS called graPh.
  • 5.
    TypesofTypesof graphgraph There areThree Types of graphs:- 1. Bar graph. 2. DouBle Bar graph. 3. picTograph. 0 1 2 3 4 5 6 1 3 5 7 9 11 13 15 17 19 frequency frequency 0 5 10 15 2 0 2 5 3 0 3 5 4 0 1 2 3 4 5 6 Ajay Ajay2
  • 6.
    What isWhat isbar graphbar graph ?????? • a Bar graph is a picTorial represenTaTion of The numerical DaTa By a numBer of Bars of uniform wiDTh erecTeD horizonTally or verTically wiTh equally spacing BeTween Them. 0 1 2 3 4 5 6 1 3 5 7 9 11 13 15 17 19 frequency frequency
  • 7.
    Exampleof bar graph.Exampleofbar graph. q. in a class of 30 pupils, The maThemaTics Teacher creaTes The TaBle Below ThaT gives The scores The pupils geT in a TesT (The Teacher scores The TesT from 0 To 20, anD all The scores are whole numBers) Draw a Bar graph ?
  • 8.
    0 1 2 3 4 5 6 1 3 57 9 11 13 15 17 19 frequency frequency Solution.
  • 9.
    What isdoublebar graph. AbAr grAph showing two sets of dAtA simultAneously. it is useful for compArison of dAtA. 0 5 10 15 20 25 30 35 40 1 2 3 4 5 6 Ajay Ajay2
  • 10.
    Exampleof doublebar graph.Exampleofdoublebar graph. 0 5 10 15 2 0 2 5 3 0 3 5 4 0 1 2 3 4 5 6 Ajay Ajay2 Name English Hindi Maths Sst. Skt Science Ajay 35 35 32 29 39 39 Ajay2 39 32 35 29 35 30
  • 11.
    What isWhat isPictographPictograph ?????? • A pictogrAph pictoriAl representAtion of dAtA using symbols.
  • 12.
    Exampleof Pictograph.Exampleof Pictograph. July= 250 August =300 September =400 =100 cars one symbol stand for 100 cars 50 cars
  • 13.
    # Made. By– ajay KuMar # $ THANKS FOR YOUR KIND CONSIDERATION $