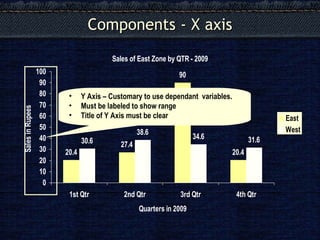
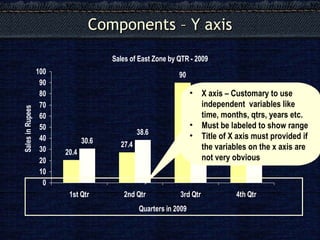
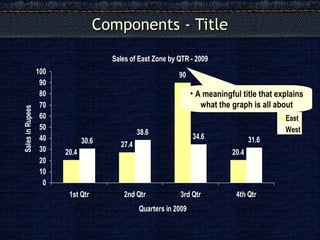
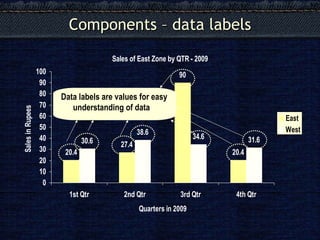
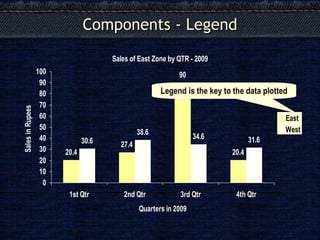
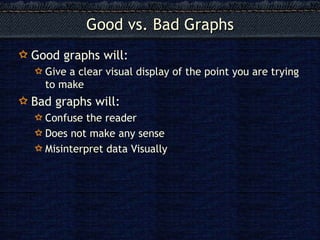
Good Graphs
A picture is worth thousand words
Chart or a Graph Remember, give a Graph / Chart only if  You want  avoid thousand  words Clarify  not  confuse Influence  the viewer Convey a   bigger   picture Less is  more  with graphs
How to create a good graph Ascertain the  purpose   of the chart. Identify   the variables and their relationships. Zero in on to the chart type that  best suits  to visualize the data to show the big picture Check – does it show a  big picture  ?  Think from the  audience view   point Hence the need is to know what is a good chart and understand types of charts to present data
Components - X axis Y Axis – Customary to use dependant  variables. Must be labeled to show range Title of Y Axis must be clear
Components – Y axis X axis – Customary to use independent  variables like time, months, qtrs, years etc. Must be labeled to show range Title of X axis must provided if the variables on the x axis are not very obvious
Components - Title A meaningful title that explains what the graph is all about
Components – data labels Data labels are values for easy understanding of data
Components - Legend Legend is the key to the data plotted
Good vs. Bad Graphs Good graphs will: Give a clear visual display of the point you are trying to make Bad graphs will: Confuse the reader Does not make any sense Misinterpret data Visually
Types of Simple Graphs Line Charts Area Charts Column Charts Bar Charts Segmented Bar / Column Charts 100% Segmented Bar/Column Charts Pie Charts Doughnut Charts
 

Good graph

  • 1.
  • 2.
    A picture isworth thousand words
  • 3.
    Chart or aGraph Remember, give a Graph / Chart only if You want avoid thousand words Clarify not confuse Influence the viewer Convey a bigger picture Less is more with graphs
  • 4.
    How to createa good graph Ascertain the purpose of the chart. Identify the variables and their relationships. Zero in on to the chart type that best suits to visualize the data to show the big picture Check – does it show a big picture ? Think from the audience view point Hence the need is to know what is a good chart and understand types of charts to present data
  • 5.
    Components - Xaxis Y Axis – Customary to use dependant variables. Must be labeled to show range Title of Y Axis must be clear
  • 6.
    Components – Yaxis X axis – Customary to use independent variables like time, months, qtrs, years etc. Must be labeled to show range Title of X axis must provided if the variables on the x axis are not very obvious
  • 7.
    Components - TitleA meaningful title that explains what the graph is all about
  • 8.
    Components – datalabels Data labels are values for easy understanding of data
  • 9.
    Components - LegendLegend is the key to the data plotted
  • 10.
    Good vs. BadGraphs Good graphs will: Give a clear visual display of the point you are trying to make Bad graphs will: Confuse the reader Does not make any sense Misinterpret data Visually
  • 11.
    Types of SimpleGraphs Line Charts Area Charts Column Charts Bar Charts Segmented Bar / Column Charts 100% Segmented Bar/Column Charts Pie Charts Doughnut Charts
  • 12.