Download to read offline


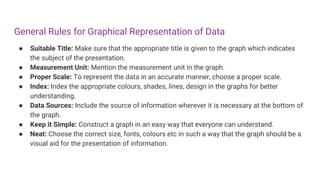
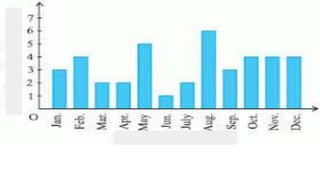
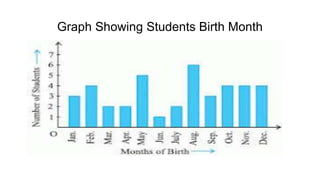


General rules for graphical representation of data include providing a suitable title indicating the subject, including the proper measurement unit, choosing an appropriate scale to accurately represent the data, indexing colors and lines for better understanding, citing data sources, keeping the graph simple and neat for easy understanding, and using the correct size, fonts, and colors to make the graph a clear visual aid. The sample graph shows the birth months of students.